
Voltage Regulator Market Research, 2033
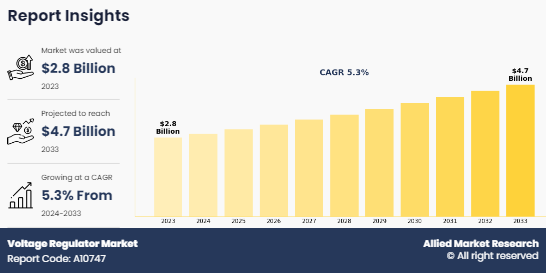
The global voltage regulator market was valued at $2.8 billion in 2023, and is projected to reach $4.7 billion by 2033, growing at a CAGR of 5.3% from 2024 to 2033. The voltage regulator market is witnessing significant growth driven by various factors, including the increase in demand for stable power supply and the advancement in voltage regulation technologies. However, the market expansion is restrained by the presence of alternatives such as static VAR compensators and other power quality improvement devices. Nevertheless, the growing demand for reliable voltage regulation solutions in various sectors and government initiatives to modernize power infrastructure present lucrative opportunities for the voltage regulator market growth.
Introduction
Voltage regulators are essential components in electrical and electronic systems, ensuring a stable output voltage despite fluctuations in input voltage or changes in load. They come in two primary types such as linear and switching, each with its method of regulation. In addition, voltage regulators can be classified based on technology, including electro-mechanical, electronic tap-switching, and ferro-resonant variants. Linear regulators utilize linear control elements to maintain a constant output voltage while switching regulators employ switching elements to adjust voltage levels rapidly.
Meanwhile, electro-mechanical regulators utilize mechanical components like transformers and relays, electronic tap-switching regulators use solid-state switches and microcontrollers, and ferro-resonant regulators exploit the resonant properties of ferromagnetic cores. Voltage regulators play a critical role in ensuring the proper functioning and longevity of electronic devices, electrical systems, and power grids by providing a consistent and reliable voltage supply.
Market Dynamics
The increase in demand for high-quality power supply is a significant factor in the voltage regulator market. These regulators ensure stable voltage levels, crucial for the proper functioning of electronic equipment and machinery. The rise of industries like healthcare, telecommunications, and IT necessitates the need for voltage regulators, as minor fluctuations can cause significant disruptions. Consumers rely on electronic devices for daily life, demanding a reliable power supply for optimal performance. The proliferation of electronics and electrical appliances across sectors, including residential, commercial, and industrial, necessitates a stable power supply for efficient and safe operation. The rise of smart homes and smart grids further increases the need for voltage regulators to ensure the uninterrupted operation of these systems. The increase in demand for power quality and the adoption of electronics and electrical appliances are key driving factors for the market, emphasizing the critical necessity for stable voltage supply in today's technologically-driven world.
Volatility in raw material prices is a significant challenge for the voltage regulator industry, as it affects manufacturing costs and profit margins. Volatility in materials like copper, aluminum, and silicon can disrupt supply chains and manufacturing processes, leading to increased production costs. Manufacturers struggle to maintain competitive pricing amidst unpredictable raw material costs, potentially affecting their market position and profitability. To manage this, companies often employ strategic sourcing practices like hedging or supplier diversification.
High voltage systems, such as transmission and distribution networks, industrial facilities, and renewable energy installations, require precise and reliable voltage regulation to ensure stable operation and prevent equipment damage. Designing and implementing such solutions can be complex and expensive, and factors like system scalability, environmental conditions, and regulatory compliance complicate the process. Addressing these challenges often requires significant research and development investments and collaboration with industry stakeholders to develop innovative solutions that meet the unique requirements of high voltage systems.
The expansion of smart grid infrastructure presents a significant opportunity for the voltage regulator market. Smart grids leverage advanced communication and control technologies to optimize the generation, distribution, and consumption of electricity. As smart grids become more prevalent globally, there is an increased need for voltage regulators to ensure stable and reliable power supply. Voltage fluctuations can disrupt the performance of smart grid systems and lead to inefficiencies in power delivery. Therefore, the deployment of voltage regulators within smart grids helps to maintain optimal voltage levels, enhance grid stability, and improve overall efficiency, driving the demand for voltage regulator solutions.
Moreover, the growing industrialization in emerging economies further fuels the demand for voltage regulators. As these economies experience rapid industrial growth and urbanization, there is an increase in demand for electricity to power industrial machinery, manufacturing processes, and infrastructure development. Voltage regulators play a crucial role in maintaining voltage stability within industrial settings, ensuring the safe and efficient operation of equipment and machinery. With the expansion of industrial sectors in emerging economies, there is a growing market for voltage regulators to address the diverse voltage regulation needs of industries, thereby presenting lucrative opportunities for manufacturers and suppliers in the voltage regulator market.
Segments Overview
The voltage regulator market is segmented into type, technology, phase, voltage, application, and region. On the basis of type, the market is bifurcated into linear, and switching. On the basis of technology, the market is segregated into electro-mechanical voltage regulators, electronic-tap switching voltage regulators, and ferro-resonant voltage regulators. On the basis of phase, the market is bifurcated into single phase, and three phase. On the basis of voltage, the market is segregated into less than 250 KVA, 250 KVA to 500 KVA, and Above 500 KVA. On the basis of application, the market is segmented into residential, commercial, and industrial. On the basis of region, the hydropower turbine market is analyzed across North America, Europe, Asia-Pacific, and LAMEA. Voltage regulator market overview for each segment is give below.

Based on type, the linear segment held the highest market share in 2023, accounting for more than three-fifths of voltage regulator market size. Switching voltage regulators are the most widely used voltage regulators globally due to their efficiency, versatility, and compactness. They operate by rapidly switching input voltages, minimizing power loss as heat during regulation. This is particularly important in battery-powered devices and energy-conscious applications. Switching regulators can handle a wider range of input voltages and provide higher output currents, making them suitable for high-power or wide input voltage variations. They are also more compact and lightweight than linear regulators, making them ideal for space-constrained designs or portable devices.

Based on technology, the electro-tap switching voltage segment held the highest market share in 2023, accounting for more than two-fifths of voltage regulator market share. Electronic-tap switching voltage regulators are gaining popularity worldwide due to their superior performance, efficiency, and flexibility compared to electro-mechanical and ferro-resonant regulators. These regulators use electronic components and microprocessors to continuously monitor and adjust voltage levels, ensuring precise regulation under varying load conditions. They offer faster response times and higher accuracy compared to traditional electro-mechanical regulators. In addition, electronic-tap switching regulators provide greater efficiency and energy savings compared to ferro-resonant regulators, which are known for their robustness but less efficient and produce harmonic distortion in output waveforms.

Based on the voltage, the 250 kVA to 500 kVA dominated the market accounting for nearly half of the voltage regulator market. The market comprises different segments, each catering to specific power requirements. The less than 250 KVA segment held major CAGR 5.8% due to its wide range of applications, including residential, commercial, and small industrial setups. These applications require voltage regulators for stable power supply for electronic equipment, appliances, and machinery. The voltage regulator market demands in this segment is widespread and consistent. The proliferation of small-scale renewable energy systems, such as solar photovoltaic installations and wind turbines, also contributes to the development of the less than 250 KVA segment. As renewable energy adoption continues to grow globally, the demand for voltage regulators in this range is increasing. Advancements in technology have led to the development of compact and efficient voltage regulator solutions suitable for applications within the less than 250 KVA range, offering cost-effective regulation capabilities while occupying minimal space.

On the basis of application, industrial segment dominated the voltage regulator market growing with the CAGR of 5.0% during the forecast period. Voltage regulators help maintain the quality of power supplied to industrial equipment by regulating voltage fluctuations, surges, and sags. This ensures smooth operation and longevity of machinery. Industrial equipment such as CNC machines, robotics, and control systems are often sensitive to voltage variations. Voltage regulators protect these devices from damage by providing a stable voltage supply.

Region-wise, Asia-Pacific dominated the voltage regulator market accounting for nearly half of the market share with the CAGR of 5.6% during the forecast period. Voltage regulators are essential components in power generation and distribution systems to ensure that electricity supplied to homes, businesses, and industries remains within safe voltage levels in Aisa-Pacific. They help stabilize voltage fluctuations and maintain a consistent supply. India faces challenges in maintaining stable power supply across its vast geographical area. Voltage regulators are extensively used in India to mitigate voltage fluctuations and ensure consistent power quality for residential, commercial, and industrial consumers.
Recent Trends of Voltage Regulators in Various Sectors
Automotive Sector Demand: Voltage regulators are in high demand to comply with strict emissions and fuel efficiency standards in automobiles. Meeting regulatory requirements necessitates advanced voltage regulation technologies to optimize energy usage and reduce emissions, driving the adoption of innovative voltage regulation solutions in the automotive industry.
Telecommunications Sector: The telecommunications industry witnesses a rising need for voltage regulators to manage escalating data traffic and ensure uninterrupted network operations. Voltage regulation solutions play a critical role in enhancing network reliability, minimizing downtime, and maintaining consistent power supply, thus addressing the growing demands of modern communication infrastructures.
Linear Voltage Regulators: Linear voltage regulators are experiencing increased adoption owing to their efficiency and performance advantages, particularly in battery-powered devices and Internet of Things (IoT) applications. Their ability to deliver stable output voltage with minimal ripple and noise makes them ideal for powering sensitive electronic components, driving their popularity in various industries.
India Voltage Regulator Patent Analysis
In recent years, India has witnessed a notable surge in patent filings related to voltage regulators, showcasing the country's growing prowess in power electronics and innovation. These patents span various sectors and introduce diverse approaches to voltage regulation, reflecting the increasing demand for efficient and reliable power management solutions in India's rapidly evolving technological landscape. Among these innovations are the "Hybrid Mode Voltage Regulator" (Patent No. 202241030640) developed by the Indian Institute of Technology Madras (IIT Madras), which combines analog and digital techniques to enhance accuracy and efficiency while reducing resolution requirements. Additionally, Intel Corporation's "Voltage Regulator with Binary Search and Linear Control" (Patent No. 202244047862) introduces an apparatus, system, and method for voltage regulator control utilizing non-linear and linear control techniques to optimize voltage regulation based on load conditions.
The emergence of novel voltage regulation technologies in India is driven by the country's burgeoning industrial and technological sectors, which demand cutting-edge solutions to enhance energy efficiency, reliability, and performance. The patents reveal a focus on optimizing voltage regulation techniques to meet the evolving needs of India's growing economy. For instance, the "Frequency Response Matching Based Voltage Regulator for Single Inductor Dual Output Buck Converter" (Patent No. 202331018301) from the National Institute of Technology, Patna, addresses the need for improved voltage regulation efficiency and stability in power converters.
Furthermore, the collaborative efforts between academia, research institutions, and industry players underscore India's commitment to fostering innovation and technological excellence in the field of voltage regulation. By harnessing the expertise of researchers, engineers, and innovators across the country, India is poised to play a pivotal role in shaping the future of voltage regulation technology, not only domestically but also on the global stage.
Competitive Analysis
The major players operating in the voltage regulator market include Siemens AG, General Electric, Eaton Corporation, ABB Ltd., Legrand, Hindustan Power Control System, ROHM Co. Ltd., STMicroelectronics, Infineon Technologies AG, and Toshiba Energy Systems & Solutions Corporation.
Key Benefits For Stakeholders
- This report provides a quantitative analysis of the market segments, current trends, estimations, and dynamics of the voltage regulator market analysis from 2023 to 2033 to identify the prevailing voltage regulator market opportunities.
- The market research is offered along with information related to key drivers, restraints, and opportunities.
- Porter's five forces analysis highlights the potency of buyers and suppliers to enable stakeholders make profit-oriented business decisions and strengthen their supplier-buyer network.
- In-depth analysis of the voltage regulator market segmentation assists to determine the prevailing market opportunities.
- Major countries in each region are mapped according to their revenue contribution to the global market.
- Market player positioning facilitates benchmarking and provides a clear understanding of the present position of the market players.
- The report includes the analysis of the regional as well as global voltage regulator market trends, key players, market segments, application areas, and market growth strategies.
Voltage Regulator Market Report Highlights
| Aspects | Details |
| Market Size By 2033 | USD 4.7 billion |
| Growth Rate | CAGR of 5.3% |
| Forecast period | 2023 - 2033 |
| Report Pages | 300 |
| By Voltage |
|
| By Application |
|
| By Technology |
|
| By Type |
|
| By Phase |
|
| By Region |
|
| Key Market Players | General Electric, Siemens AG, Rohm Co. Ltd., STMicroelectronics N.V., Legrand, Eaton Corporation plc, Infineon Technologies AG, ABB Ltd., Hindustan Power Control System, Toshiba Corporation |
| | Schweitzer Engineering Laboratories Inc., Texas Instruments Incorporated, Howard Industries Inc., Schneider Elektrotechnik GmbH, Others |
Analyst Review
Chief Executive Officers (CXOs) and industry leaders in the voltage regulator market are navigating a landscape ripe with growth opportunities, propelled by increasing global energy demands and a focus on sustainable solutions. Acknowledging the pivotal role of voltage regulators in ensuring a stable power supply and meeting renewable energy targets, these leaders are strategically positioning their companies to address pressing environmental concerns. Market dynamics encompass diverse technologies catering to various capacities and sectors, with CXOs adeptly navigating regulatory environments and capitalizing on incentives to drive innovation and investment.
Within this context, CXOs recognize the importance of energy storage solutions, grid modernization, and enhanced efficiency in voltage regulation technologies. Despite challenges such as initial capital costs and grid integration complexities, visionary leaders perceive these hurdles as opportunities for strategic planning and innovation. As the industry advances, CXOs think the trajectory toward sustainable energy is the future, leveraging their expertise to promote the widespread adoption of voltage regulators across regions worldwide.
The voltage regulator market stands on the brink of transformative growth, with CXOs leading the charge towards a cleaner, greener energy landscape. Through strategic foresight and adept management, these leaders are expected to catalyze innovation, drive investment, and foster widespread adoption, ultimately contributing to a more sustainable and resilient energy future globally.
Competition from substitute technologies poses a significant challenge to the growth of the market.
The rising demand for electronic devices is driving emerging trends in the global market.
Asia-Pacific is the largest region of voltage regulator market
Industrial applications dominate the voltage regulator market.
Key companies in the voltage regulator market include Siemens AG, General Electric, Eaton Corporation, ABB Ltd., Legrand, Hindustan Power Control System, ROHM Co. Ltd., STMicroelectronics, Infineon Technologies AG, and Toshiba Energy Systems & Solutions Corporation.
The global voltage regulator market was valued at $2.8 billion in 2023, and is projected to reach $4.7 billion by 2033, growing at a CAGR of 5.3% from 2024 to 2033.
Loading Table Of Content...
Loading Research Methodology...

