0
New
New
2023
Water Treatment Equipment Market

Water Treatment Equipment Market

by Type (Process Equipment, Mud Treatment, Filtration Systems and Media, Disinfection, Diversions and Screens, Meters, Membranes, Others), by End-use Industry  (Industrial Water Treatment Equipment, Municipal Water Treatment Equipment): Global Opportunity Analysis and Industry Forecast, 2023-2032

Report Code: A01104
May 2023 | Pages: 286
Tables: 109
Charts: 76
  • Formats*:

  • pdf

    Single User License, Five User
    License & Enterprise User License

  • xls

    Data Pack Excel License

  • ppt

    It comes with the additional cost
    of $2500.00 contact sales.


Water Treatment Equipment Market Research, 2032

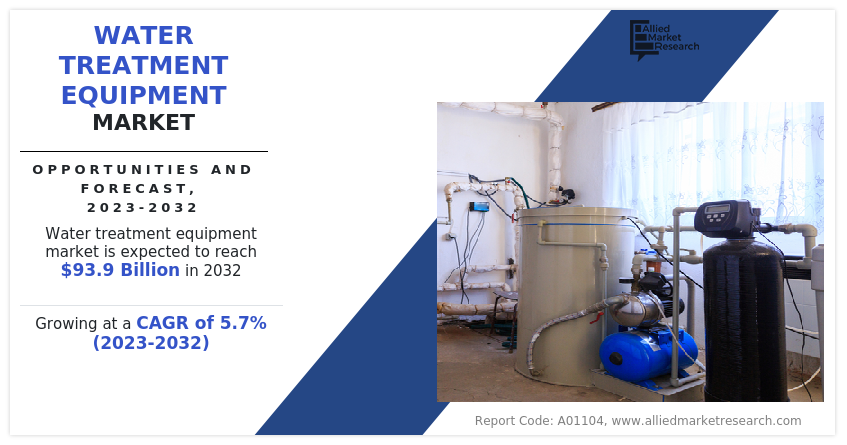
The global water treatment equipment market was valued at $54.3 billion in 2022, and is projected to reach $93.9 billion by 2032, growing at a CAGR of 5.7% from 2023 to 2032.

Report key highlighters

  • Quantitative information mentioned in the global water treatment equipment market includes the market numbers in terms of value (USD Million) with respect to different segments, pricing analysis, annual growth rate, CAGR (2023-32), and growth analysis.
  • The analysis in the report is provided based on type, and end-use industry. The study will also contain qualitative information such as the market dynamics (drivers, restraints, opportunities), Porter's Five Force Analysis, key regulations across the region, and value chain analysis.
  • A few companies, including Calgon Carbon Corporation, Culligan Water, Ecolab, General Electric, Hydranautics, Pentair, Lenntech B.V., Suez, Veolia, and Xylem, hold a large proportion of the water treatment equipment market.
  • This report makes it easier for existing market players and new entrants to the prepreg business to plan their strategies and understand the dynamics of the industry, which ultimately helps them make better decisions.
Water Treatment Equipment Market

Water treatment is the process of removing impurities and contaminants from water to make it safe and suitable for various applications, including drinking, cooking, and industrial use.

The process may involve a combination of physical, chemical, and biological methods to remove contaminants and improve the quality of water. Water treatment is essential for public health, as contaminated water may lead to a variety of waterborne illnesses, including cholera, typhoid fever, and dysentery. In addition, untreated water may contain harmful chemicals, heavy metals, and other pollutants that may damage ecosystems and harm aquatic life.

The water treatment equipment market refers to the industry involved in manufacturing and supplying various types of equipment and technologies used for treating and purifying water. This includes water filtration systems, reverse osmosis systems, ultraviolet (UV) disinfection systems, ion exchange systems, sedimentation systems, and other equipment used to remove impurities, contaminants, and microorganisms from water.

 Water treatment equipment is chosen based on the properties of constituents such as density, quantity, chemical reactivity, boiling point, solubility, melting point, volatility, the purity level of water, and similar others. Water treatment equipment may be used for a variety of applications, including:

  • Municipal water treatment: This includes equipment used by water treatment plants to purify water before it is distributed to homes and businesses.
  • Industrial water treatment: This involves the use of equipment to treat water used in manufacturing processes, cooling systems, and other industrial applications.
  • Residential water treatment: This refers to equipment that may be installed in homes and apartments to improve the quality of drinking water and remove impurities.

Some examples of water treatment equipment include water filtration systems, water softeners, reverse osmosis systems, ultraviolet (UV) sterilizers, and chemical disinfection systems. The type of equipment used may depend on the specific needs of the application and the contaminants that need to be removed.

The global water treatment equipment market is expected to grow significantly in the coming years due to the increase in demand for clean and safe drinking water, the growth in population, and increase in industrialization. However, changes in the regulatory environment and low consumer awareness inhibit the development owing to the price-sensitive nature of this market.  The usage is limited in developing countries as the price of water treatment equipment is relatively higher compared to its traditional counterparts.

Moreover, emerging economies are expected to lead the water treatment equipment market in the coming years. In addition, a rise in awareness regarding energy conservation and sustainability in the construction industry is expected to benefit the water treatment equipment industry.

Moreover, the COVID-19 pandemic has had both direct and indirect impacts on the water treatment equipment market. The global water treatment equipment market relies on complex supply chains involving raw materials, components, and equipment from various regions. The pandemic has caused disruptions in supply chains due to lockdown measures, travel restrictions, and temporary closures of manufacturing facilities.

These disruptions have resulted in delays in production, delivery, and installation of water treatment equipment. Many industries and municipalities faced financial constraints during the pandemic, leading to reduced capital expenditure budgets. As a result, some projects related to the installation or upgrade of water treatment equipment may have been postponed or canceled. The uncertain economic environment and prioritization of other urgent needs contributed to the decline in investment in water treatment equipment.

The pandemic heightened awareness of hygiene and sanitization practices, leading to an increased demand for disinfection technologies in water treatment. UV disinfection systems and other advanced disinfection technologies saw increased interest and adoption as industries and municipalities sought to ensure the safety of their water supplies. The long-term outlook for the water treatment equipment market remains positive while the pandemic initially caused disruptions.

The importance of water quality and sanitation has been reinforced, and the need for resilient water treatment infrastructure has gained prominence. The demand for water treatment equipment is expected to rebound as the global economy recovers and investments in infrastructure resume. The water treatment equipment market is segmented on the basis of type, end-use industry, and region.

On the basis of type, the market is classified into process equipment, mud treatment, filtration systems & media, disinfection, diversions & screens, meters, membranes, and others. On the basis of end-use industry, the market is bifurcated into industrial water treatment equipment and municipal water treatment equipment. The industrial water treatment equipment segment is further segmented into process water treatment, wastewater treatment, and sludge treatment.

Moreover, the municipal water treatment equipment segment is further fragmented into process water treatment, wastewater treatment, and sludge treatment. On the basis of region, the market is analyzed across North America, Europe, Asia-Pacific, and LAMEA.
The major players operating in the industry include Calgon Carbon Corporation, Culligan Water, Ecolab, General Electric, Hydranautics, Pentair, Lenntech B.V., Suez, Veolia, and Xylem. These players have adopted product launches as their key strategy to increase their market shares.

Water Treatment Equipment Market

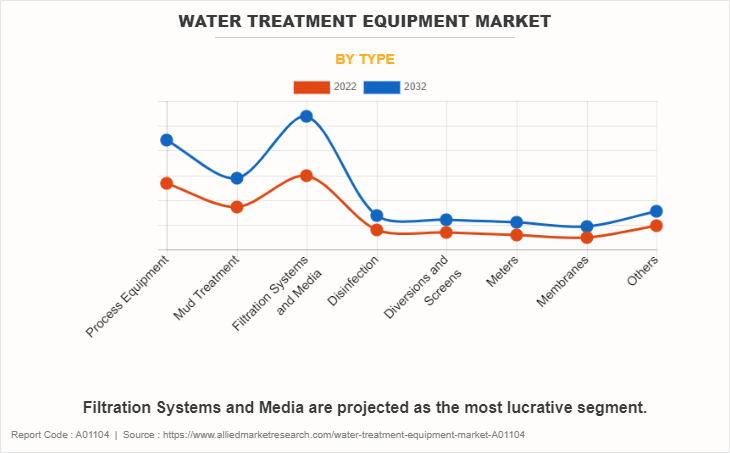
By type, the market is divided into process equipment, mud treatment, filtration systems & media, disinfection, diversions & screens, meters, membranes, and others. The filtration systems & media segment held the largest market share in 2022 and is expected to register the highest CAGR during the forecast period. The demand for filtration systems to treat and purify available water sources is growing as water resources become increasingly scarce. Furthermore, the industrial sector requires water for various processes, such as manufacturing, power generation, and chemical processing. There is an increase in need for filtration systems to treat process water, recycle wastewater, and meet stringent water quality standards as industrial activities expand worldwide.

Water Treatment Equipment Market

By end-use industry, the market is categorized into industrial water treatment equipment and municipal water treatment equipment. The municipal water treatment equipment segment held the largest market share in 2022. Freshwater availability has dropped dramatically, and water pollution has increased at an exponential rate over the period. Increased environmental concerns, as well as more severe wastewater laws and legislation, are also driving the municipal wastewater treatment market.

Water Treatment Equipment Market

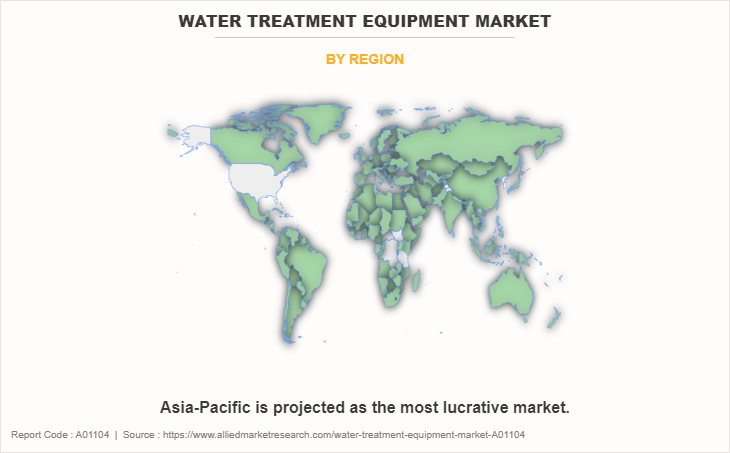
By region, the market is categorized into North America, Europe, Asia-Pacific, and LAMEA. The Asia-Pacific region is one of the fastest-growing regions in the world, with a large population and a growing middle class. the abundant availability of raw materials in the Asia-Pacific area has enticed a number of multinational firms and investors to establish manufacturing facilities there, boosting the growth of the water treatment equipment market in the region.

Key Benefits For Stakeholders

  • This report provides a quantitative analysis of the market segments, current trends, estimations, and dynamics of the water treatment equipment market analysis from 2022 to 2032 to identify the prevailing water treatment equipment market opportunities.
  • The market research is offered along with information related to key drivers, restraints, and opportunities.
  • Porter's five forces analysis highlights the potency of buyers and suppliers to enable stakeholders make profit-oriented business decisions and strengthen their supplier-buyer network.
  • In-depth analysis of the water treatment equipment market segmentation assists to determine the prevailing market opportunities.
  • Major countries in each region are mapped according to their revenue contribution to the global market.
  • Market player positioning facilitates benchmarking and provides a clear understanding of the present position of the market players.
  • The report includes the analysis of the regional as well as global water treatment equipment market trends, key players, market segments, application areas, and market growth strategies.

Water Treatment Equipment Market Report Highlights

Aspects Details
Market Size By 2032 USD 93.9 billion
Growth Rate CAGR of 5.7%
Forecast period 2022 - 2032
Report Pages 286
By Type
  • Process Equipment
  • Mud Treatment
  • Filtration Systems and Media
  • Disinfection
  • Diversions and Screens
  • Meters
  • Membranes
  • Others
By End-use Industry 
  • Industrial Water Treatment Equipment
  • Municipal Water Treatment Equipment
By Region
  • North America  (U.S., Canada, Mexico)
  • Europe  (Germany, France, UK, Italy, Spain, Rest of Europe)
  • Asia-Pacific  (China, India, Japan, South Korea, Australia, Rest of Asia-Pacific)
  • LAMEA  (Brazil, Saudi Arabia, South Africa, UAE, Rest of LAMEA)
Key Market Players Veolia, Suez, General Electric, Hydranautics, Ecolab, Xylem, Pentair, Lenntech B.V., Culligan Water, Calgon Carbon Corporation

Analyst Review

According to the opinions of various CXOs of leading companies, the water treatment equipment market is driven by rapidly expanding industrialization sector, and awareness about environmental sustainability. Moreover, the Asia-Pacific region is projected to register robust growth, significantly from the emerging economies such as China, India, and Indonesia, as they have huge potential with regards to the adoption of water treatment equipment due to growth in population and supportive policies that are aimed to the treatment of wastewater. However, high equipment costs are expected to pose a threat to the water treatment equipment market. Furthermore, the presence of alternative water treatment processes such as UV radiation and membranes, among others, hampers the growth of this market.

The industry is characterized by a high number of new market entrants that seek to tap lucrative opportunities in the global market while existing players enter strategic collaborations to increase capacities & expand their reach into emerging markets. The joint venture, merger, and acquisition activities in the industry have increased significantly over the past decade. Companies constantly seek to establish long-term contract agreements with trusted partners for sustainable business operations globally.

 
  • CHAPTER 1: INTRODUCTION

    • 1.1. Report description

    • 1.2. Key market segments

    • 1.3. Key benefits to the stakeholders

    • 1.4. Research Methodology

      • 1.4.1. Primary research

      • 1.4.2. Secondary research

      • 1.4.3. Analyst tools and models

  • CHAPTER 2: EXECUTIVE SUMMARY

    • 2.1. CXO Perspective

  • CHAPTER 3: MARKET OVERVIEW

    • 3.1. Market definition and scope

    • 3.2. Key findings

      • 3.2.1. Top impacting factors

      • 3.2.2. Top investment pockets

    • 3.3. Porter’s five forces analysis

      • 3.3.1. Bargaining power of suppliers

      • 3.3.2. Bargaining power of buyers

      • 3.3.3. Threat of substitutes

      • 3.3.4. Threat of new entrants

      • 3.3.5. Intensity of rivalry

    • 3.4. Market dynamics

      • 3.4.1. Drivers

        • 3.4.1.1. Increase in industrial water discharge
        • 3.4.1.2. Increase in investments in wastewater treatment facilities.

      • 3.4.2. Restraints

        • 3.4.2.1. High equipment cost

      • 3.4.3. Opportunities

        • 3.4.3.1. Surge in demand for energy-efficient technologies

    • 3.5. COVID-19 Impact Analysis on the market

    • 3.6. Patent Landscape

    • 3.7. Pricing Analysis

    • 3.8. Regulatory Guidelines

  • CHAPTER 4: WATER TREATMENT EQUIPMENT MARKET, BY TYPE

    • 4.1. Overview

      • 4.1.1. Market size and forecast

    • 4.2. Process Equipment

      • 4.2.1. Key market trends, growth factors and opportunities

      • 4.2.2. Market size and forecast, by region

      • 4.2.3. Market share analysis by country

    • 4.3. Mud Treatment

      • 4.3.1. Key market trends, growth factors and opportunities

      • 4.3.2. Market size and forecast, by region

      • 4.3.3. Market share analysis by country

    • 4.4. Filtration Systems and Media

      • 4.4.1. Key market trends, growth factors and opportunities

      • 4.4.2. Market size and forecast, by region

      • 4.4.3. Market share analysis by country

    • 4.5. Disinfection

      • 4.5.1. Key market trends, growth factors and opportunities

      • 4.5.2. Market size and forecast, by region

      • 4.5.3. Market share analysis by country

    • 4.6. Diversions and Screens

      • 4.6.1. Key market trends, growth factors and opportunities

      • 4.6.2. Market size and forecast, by region

      • 4.6.3. Market share analysis by country

    • 4.7. Meters

      • 4.7.1. Key market trends, growth factors and opportunities

      • 4.7.2. Market size and forecast, by region

      • 4.7.3. Market share analysis by country

    • 4.8. Membranes

      • 4.8.1. Key market trends, growth factors and opportunities

      • 4.8.2. Market size and forecast, by region

      • 4.8.3. Market share analysis by country

    • 4.9. Others

      • 4.9.1. Key market trends, growth factors and opportunities

      • 4.9.2. Market size and forecast, by region

      • 4.9.3. Market share analysis by country

  • CHAPTER 5: WATER TREATMENT EQUIPMENT MARKET, BY END-USE INDUSTRY 

    • 5.1. Overview

      • 5.1.1. Market size and forecast

    • 5.2. Industrial Water Treatment Equipment

      • 5.2.1. Key market trends, growth factors and opportunities

      • 5.2.2. Market size and forecast, by region

      • 5.2.3. Market share analysis by country

    • 5.3. Municipal Water Treatment Equipment

      • 5.3.1. Key market trends, growth factors and opportunities

      • 5.3.2. Market size and forecast, by region

      • 5.3.3. Market share analysis by country

  • CHAPTER 6: WATER TREATMENT EQUIPMENT MARKET, BY REGION

    • 6.1. Overview

      • 6.1.1. Market size and forecast By Region

    • 6.2. North America

      • 6.2.1. Key trends and opportunities

      • 6.2.2. Market size and forecast, by Type

      • 6.2.3. Market size and forecast, by End-use Industry 

      • 6.2.4. Market size and forecast, by country

        • 6.2.4.1. U.S.
          • 6.2.4.1.1. Key market trends, growth factors and opportunities
          • 6.2.4.1.2. Market size and forecast, by Type
          • 6.2.4.1.3. Market size and forecast, by End-use Industry 
        • 6.2.4.2. Canada
          • 6.2.4.2.1. Key market trends, growth factors and opportunities
          • 6.2.4.2.2. Market size and forecast, by Type
          • 6.2.4.2.3. Market size and forecast, by End-use Industry 
        • 6.2.4.3. Mexico
          • 6.2.4.3.1. Key market trends, growth factors and opportunities
          • 6.2.4.3.2. Market size and forecast, by Type
          • 6.2.4.3.3. Market size and forecast, by End-use Industry 
    • 6.3. Europe

      • 6.3.1. Key trends and opportunities

      • 6.3.2. Market size and forecast, by Type

      • 6.3.3. Market size and forecast, by End-use Industry 

      • 6.3.4. Market size and forecast, by country

        • 6.3.4.1. Germany
          • 6.3.4.1.1. Key market trends, growth factors and opportunities
          • 6.3.4.1.2. Market size and forecast, by Type
          • 6.3.4.1.3. Market size and forecast, by End-use Industry 
        • 6.3.4.2. France
          • 6.3.4.2.1. Key market trends, growth factors and opportunities
          • 6.3.4.2.2. Market size and forecast, by Type
          • 6.3.4.2.3. Market size and forecast, by End-use Industry 
        • 6.3.4.3. UK
          • 6.3.4.3.1. Key market trends, growth factors and opportunities
          • 6.3.4.3.2. Market size and forecast, by Type
          • 6.3.4.3.3. Market size and forecast, by End-use Industry 
        • 6.3.4.4. Italy
          • 6.3.4.4.1. Key market trends, growth factors and opportunities
          • 6.3.4.4.2. Market size and forecast, by Type
          • 6.3.4.4.3. Market size and forecast, by End-use Industry 
        • 6.3.4.5. Spain
          • 6.3.4.5.1. Key market trends, growth factors and opportunities
          • 6.3.4.5.2. Market size and forecast, by Type
          • 6.3.4.5.3. Market size and forecast, by End-use Industry 
        • 6.3.4.6. Rest of Europe
          • 6.3.4.6.1. Key market trends, growth factors and opportunities
          • 6.3.4.6.2. Market size and forecast, by Type
          • 6.3.4.6.3. Market size and forecast, by End-use Industry 
    • 6.4. Asia-Pacific

      • 6.4.1. Key trends and opportunities

      • 6.4.2. Market size and forecast, by Type

      • 6.4.3. Market size and forecast, by End-use Industry 

      • 6.4.4. Market size and forecast, by country

        • 6.4.4.1. China
          • 6.4.4.1.1. Key market trends, growth factors and opportunities
          • 6.4.4.1.2. Market size and forecast, by Type
          • 6.4.4.1.3. Market size and forecast, by End-use Industry 
        • 6.4.4.2. India
          • 6.4.4.2.1. Key market trends, growth factors and opportunities
          • 6.4.4.2.2. Market size and forecast, by Type
          • 6.4.4.2.3. Market size and forecast, by End-use Industry 
        • 6.4.4.3. Japan
          • 6.4.4.3.1. Key market trends, growth factors and opportunities
          • 6.4.4.3.2. Market size and forecast, by Type
          • 6.4.4.3.3. Market size and forecast, by End-use Industry 
        • 6.4.4.4. South Korea
          • 6.4.4.4.1. Key market trends, growth factors and opportunities
          • 6.4.4.4.2. Market size and forecast, by Type
          • 6.4.4.4.3. Market size and forecast, by End-use Industry 
        • 6.4.4.5. Australia
          • 6.4.4.5.1. Key market trends, growth factors and opportunities
          • 6.4.4.5.2. Market size and forecast, by Type
          • 6.4.4.5.3. Market size and forecast, by End-use Industry 
        • 6.4.4.6. Rest of Asia-Pacific
          • 6.4.4.6.1. Key market trends, growth factors and opportunities
          • 6.4.4.6.2. Market size and forecast, by Type
          • 6.4.4.6.3. Market size and forecast, by End-use Industry 
    • 6.5. LAMEA

      • 6.5.1. Key trends and opportunities

      • 6.5.2. Market size and forecast, by Type

      • 6.5.3. Market size and forecast, by End-use Industry 

      • 6.5.4. Market size and forecast, by country

        • 6.5.4.1. Brazil
          • 6.5.4.1.1. Key market trends, growth factors and opportunities
          • 6.5.4.1.2. Market size and forecast, by Type
          • 6.5.4.1.3. Market size and forecast, by End-use Industry 
        • 6.5.4.2. Saudi Arabia
          • 6.5.4.2.1. Key market trends, growth factors and opportunities
          • 6.5.4.2.2. Market size and forecast, by Type
          • 6.5.4.2.3. Market size and forecast, by End-use Industry 
        • 6.5.4.3. South Africa
          • 6.5.4.3.1. Key market trends, growth factors and opportunities
          • 6.5.4.3.2. Market size and forecast, by Type
          • 6.5.4.3.3. Market size and forecast, by End-use Industry 
        • 6.5.4.4. UAE
          • 6.5.4.4.1. Key market trends, growth factors and opportunities
          • 6.5.4.4.2. Market size and forecast, by Type
          • 6.5.4.4.3. Market size and forecast, by End-use Industry 
        • 6.5.4.5. Rest of LAMEA
          • 6.5.4.5.1. Key market trends, growth factors and opportunities
          • 6.5.4.5.2. Market size and forecast, by Type
          • 6.5.4.5.3. Market size and forecast, by End-use Industry 
  • CHAPTER 7: COMPETITIVE LANDSCAPE

    • 7.1. Introduction

    • 7.2. Top winning strategies

    • 7.3. Product Mapping of Top 10 Player

    • 7.4. Competitive Dashboard

    • 7.5. Competitive Heatmap

    • 7.6. Top player positioning, 2022

  • CHAPTER 8: COMPANY PROFILES

    • 8.1. Ecolab

      • 8.1.1. Company overview

      • 8.1.2. Key Executives

      • 8.1.3. Company snapshot

      • 8.1.4. Operating business segments

      • 8.1.5. Product portfolio

      • 8.1.6. Business performance

    • 8.2. Hydranautics

      • 8.2.1. Company overview

      • 8.2.2. Key Executives

      • 8.2.3. Company snapshot

      • 8.2.4. Operating business segments

      • 8.2.5. Product portfolio

      • 8.2.6. Business performance

      • 8.2.7. Key strategic moves and developments

    • 8.3. Veolia

      • 8.3.1. Company overview

      • 8.3.2. Key Executives

      • 8.3.3. Company snapshot

      • 8.3.4. Operating business segments

      • 8.3.5. Product portfolio

      • 8.3.6. Business performance

    • 8.4. Xylem

      • 8.4.1. Company overview

      • 8.4.2. Key Executives

      • 8.4.3. Company snapshot

      • 8.4.4. Operating business segments

      • 8.4.5. Product portfolio

      • 8.4.6. Business performance

      • 8.4.7. Key strategic moves and developments

    • 8.5. Pentair

      • 8.5.1. Company overview

      • 8.5.2. Key Executives

      • 8.5.3. Company snapshot

      • 8.5.4. Operating business segments

      • 8.5.5. Product portfolio

      • 8.5.6. Business performance

      • 8.5.7. Key strategic moves and developments

    • 8.6. General Electric

      • 8.6.1. Company overview

      • 8.6.2. Key Executives

      • 8.6.3. Company snapshot

      • 8.6.4. Operating business segments

      • 8.6.5. Product portfolio

      • 8.6.6. Business performance

    • 8.7. Suez

      • 8.7.1. Company overview

      • 8.7.2. Key Executives

      • 8.7.3. Company snapshot

      • 8.7.4. Operating business segments

      • 8.7.5. Product portfolio

      • 8.7.6. Business performance

      • 8.7.7. Key strategic moves and developments

    • 8.8. Calgon Carbon Corporation

      • 8.8.1. Company overview

      • 8.8.2. Key Executives

      • 8.8.3. Company snapshot

      • 8.8.4. Operating business segments

      • 8.8.5. Product portfolio

    • 8.9. Culligan Water

      • 8.9.1. Company overview

      • 8.9.2. Key Executives

      • 8.9.3. Company snapshot

      • 8.9.4. Operating business segments

      • 8.9.5. Product portfolio

    • 8.10. Lenntech B.V.

      • 8.10.1. Company overview

      • 8.10.2. Key Executives

      • 8.10.3. Company snapshot

      • 8.10.4. Operating business segments

      • 8.10.5. Product portfolio

  • LIST OF TABLES

  • TABLE 01. GLOBAL WATER TREATMENT EQUIPMENT MARKET, BY TYPE, 2022-2032 ($MILLION)
    TABLE 02. WATER TREATMENT EQUIPMENT MARKET FOR PROCESS EQUIPMENT, BY REGION, 2022-2032 ($MILLION)
    TABLE 03. WATER TREATMENT EQUIPMENT MARKET FOR MUD TREATMENT, BY REGION, 2022-2032 ($MILLION)
    TABLE 04. WATER TREATMENT EQUIPMENT MARKET FOR FILTRATION SYSTEMS AND MEDIA, BY REGION, 2022-2032 ($MILLION)
    TABLE 05. WATER TREATMENT EQUIPMENT MARKET FOR DISINFECTION, BY REGION, 2022-2032 ($MILLION)
    TABLE 06. WATER TREATMENT EQUIPMENT MARKET FOR DIVERSIONS AND SCREENS, BY REGION, 2022-2032 ($MILLION)
    TABLE 07. WATER TREATMENT EQUIPMENT MARKET FOR METERS, BY REGION, 2022-2032 ($MILLION)
    TABLE 08. WATER TREATMENT EQUIPMENT MARKET FOR MEMBRANES, BY REGION, 2022-2032 ($MILLION)
    TABLE 09. WATER TREATMENT EQUIPMENT MARKET FOR OTHERS, BY REGION, 2022-2032 ($MILLION)
    TABLE 10. GLOBAL WATER TREATMENT EQUIPMENT MARKET, BY END-USE INDUSTRY , 2022-2032 ($MILLION)
    TABLE 11. WATER TREATMENT EQUIPMENT MARKET FOR INDUSTRIAL WATER TREATMENT EQUIPMENT, BY REGION, 2022-2032 ($MILLION)
    TABLE 12. WATER TREATMENT EQUIPMENT MARKET FOR MUNICIPAL WATER TREATMENT EQUIPMENT, BY REGION, 2022-2032 ($MILLION)
    TABLE 13. WATER TREATMENT EQUIPMENT MARKET, BY REGION, 2022-2032 ($MILLION)
    TABLE 14. NORTH AMERICA WATER TREATMENT EQUIPMENT MARKET, BY TYPE, 2022-2032 ($MILLION)
    TABLE 15. NORTH AMERICA WATER TREATMENT EQUIPMENT MARKET, BY END-USE INDUSTRY , 2022-2032 ($MILLION)
    TABLE 16. NORTH AMERICA WATER TREATMENT EQUIPMENT MARKET, BY COUNTRY, 2022-2032 ($MILLION)
    TABLE 17. U.S. WATER TREATMENT EQUIPMENT MARKET, BY TYPE, 2022-2032 ($MILLION)
    TABLE 18. U.S. WATER TREATMENT EQUIPMENT MARKET, BY END-USE INDUSTRY , 2022-2032 ($MILLION)
    TABLE 19. CANADA WATER TREATMENT EQUIPMENT MARKET, BY TYPE, 2022-2032 ($MILLION)
    TABLE 20. CANADA WATER TREATMENT EQUIPMENT MARKET, BY END-USE INDUSTRY , 2022-2032 ($MILLION)
    TABLE 21. MEXICO WATER TREATMENT EQUIPMENT MARKET, BY TYPE, 2022-2032 ($MILLION)
    TABLE 22. MEXICO WATER TREATMENT EQUIPMENT MARKET, BY END-USE INDUSTRY , 2022-2032 ($MILLION)
    TABLE 23. EUROPE WATER TREATMENT EQUIPMENT MARKET, BY TYPE, 2022-2032 ($MILLION)
    TABLE 24. EUROPE WATER TREATMENT EQUIPMENT MARKET, BY END-USE INDUSTRY , 2022-2032 ($MILLION)
    TABLE 25. EUROPE WATER TREATMENT EQUIPMENT MARKET, BY COUNTRY, 2022-2032 ($MILLION)
    TABLE 26. GERMANY WATER TREATMENT EQUIPMENT MARKET, BY TYPE, 2022-2032 ($MILLION)
    TABLE 27. GERMANY WATER TREATMENT EQUIPMENT MARKET, BY END-USE INDUSTRY , 2022-2032 ($MILLION)
    TABLE 28. FRANCE WATER TREATMENT EQUIPMENT MARKET, BY TYPE, 2022-2032 ($MILLION)
    TABLE 29. FRANCE WATER TREATMENT EQUIPMENT MARKET, BY END-USE INDUSTRY , 2022-2032 ($MILLION)
    TABLE 30. UK WATER TREATMENT EQUIPMENT MARKET, BY TYPE, 2022-2032 ($MILLION)
    TABLE 31. UK WATER TREATMENT EQUIPMENT MARKET, BY END-USE INDUSTRY , 2022-2032 ($MILLION)
    TABLE 32. ITALY WATER TREATMENT EQUIPMENT MARKET, BY TYPE, 2022-2032 ($MILLION)
    TABLE 33. ITALY WATER TREATMENT EQUIPMENT MARKET, BY END-USE INDUSTRY , 2022-2032 ($MILLION)
    TABLE 34. SPAIN WATER TREATMENT EQUIPMENT MARKET, BY TYPE, 2022-2032 ($MILLION)
    TABLE 35. SPAIN WATER TREATMENT EQUIPMENT MARKET, BY END-USE INDUSTRY , 2022-2032 ($MILLION)
    TABLE 36. REST OF EUROPE WATER TREATMENT EQUIPMENT MARKET, BY TYPE, 2022-2032 ($MILLION)
    TABLE 37. REST OF EUROPE WATER TREATMENT EQUIPMENT MARKET, BY END-USE INDUSTRY , 2022-2032 ($MILLION)
    TABLE 38. ASIA-PACIFIC WATER TREATMENT EQUIPMENT MARKET, BY TYPE, 2022-2032 ($MILLION)
    TABLE 39. ASIA-PACIFIC WATER TREATMENT EQUIPMENT MARKET, BY END-USE INDUSTRY , 2022-2032 ($MILLION)
    TABLE 40. ASIA-PACIFIC WATER TREATMENT EQUIPMENT MARKET, BY COUNTRY, 2022-2032 ($MILLION)
    TABLE 41. CHINA WATER TREATMENT EQUIPMENT MARKET, BY TYPE, 2022-2032 ($MILLION)
    TABLE 42. CHINA WATER TREATMENT EQUIPMENT MARKET, BY END-USE INDUSTRY , 2022-2032 ($MILLION)
    TABLE 43. INDIA WATER TREATMENT EQUIPMENT MARKET, BY TYPE, 2022-2032 ($MILLION)
    TABLE 44. INDIA WATER TREATMENT EQUIPMENT MARKET, BY END-USE INDUSTRY , 2022-2032 ($MILLION)
    TABLE 45. JAPAN WATER TREATMENT EQUIPMENT MARKET, BY TYPE, 2022-2032 ($MILLION)
    TABLE 46. JAPAN WATER TREATMENT EQUIPMENT MARKET, BY END-USE INDUSTRY , 2022-2032 ($MILLION)
    TABLE 47. SOUTH KOREA WATER TREATMENT EQUIPMENT MARKET, BY TYPE, 2022-2032 ($MILLION)
    TABLE 48. SOUTH KOREA WATER TREATMENT EQUIPMENT MARKET, BY END-USE INDUSTRY , 2022-2032 ($MILLION)
    TABLE 49. AUSTRALIA WATER TREATMENT EQUIPMENT MARKET, BY TYPE, 2022-2032 ($MILLION)
    TABLE 50. AUSTRALIA WATER TREATMENT EQUIPMENT MARKET, BY END-USE INDUSTRY , 2022-2032 ($MILLION)
    TABLE 51. REST OF ASIA-PACIFIC WATER TREATMENT EQUIPMENT MARKET, BY TYPE, 2022-2032 ($MILLION)
    TABLE 52. REST OF ASIA-PACIFIC WATER TREATMENT EQUIPMENT MARKET, BY END-USE INDUSTRY , 2022-2032 ($MILLION)
    TABLE 53. LAMEA WATER TREATMENT EQUIPMENT MARKET, BY TYPE, 2022-2032 ($MILLION)
    TABLE 54. LAMEA WATER TREATMENT EQUIPMENT MARKET, BY END-USE INDUSTRY , 2022-2032 ($MILLION)
    TABLE 55. LAMEA WATER TREATMENT EQUIPMENT MARKET, BY COUNTRY, 2022-2032 ($MILLION)
    TABLE 56. BRAZIL WATER TREATMENT EQUIPMENT MARKET, BY TYPE, 2022-2032 ($MILLION)
    TABLE 57. BRAZIL WATER TREATMENT EQUIPMENT MARKET, BY END-USE INDUSTRY , 2022-2032 ($MILLION)
    TABLE 58. SAUDI ARABIA WATER TREATMENT EQUIPMENT MARKET, BY TYPE, 2022-2032 ($MILLION)
    TABLE 59. SAUDI ARABIA WATER TREATMENT EQUIPMENT MARKET, BY END-USE INDUSTRY , 2022-2032 ($MILLION)
    TABLE 60. SOUTH AFRICA WATER TREATMENT EQUIPMENT MARKET, BY TYPE, 2022-2032 ($MILLION)
    TABLE 61. SOUTH AFRICA WATER TREATMENT EQUIPMENT MARKET, BY END-USE INDUSTRY , 2022-2032 ($MILLION)
    TABLE 62. UAE WATER TREATMENT EQUIPMENT MARKET, BY TYPE, 2022-2032 ($MILLION)
    TABLE 63. UAE WATER TREATMENT EQUIPMENT MARKET, BY END-USE INDUSTRY , 2022-2032 ($MILLION)
    TABLE 64. REST OF LAMEA WATER TREATMENT EQUIPMENT MARKET, BY TYPE, 2022-2032 ($MILLION)
    TABLE 65. REST OF LAMEA WATER TREATMENT EQUIPMENT MARKET, BY END-USE INDUSTRY , 2022-2032 ($MILLION)
    TABLE 66. ECOLAB: KEY EXECUTIVES
    TABLE 67. ECOLAB: COMPANY SNAPSHOT
    TABLE 68. ECOLAB: PRODUCT SEGMENTS
    TABLE 69. ECOLAB: PRODUCT PORTFOLIO
    TABLE 70. HYDRANAUTICS: KEY EXECUTIVES
    TABLE 71. HYDRANAUTICS: COMPANY SNAPSHOT
    TABLE 72. HYDRANAUTICS: PRODUCT SEGMENTS
    TABLE 73. HYDRANAUTICS: PRODUCT PORTFOLIO
    TABLE 74. HYDRANAUTICS: KEY STRATERGIES
    TABLE 75. VEOLIA: KEY EXECUTIVES
    TABLE 76. VEOLIA: COMPANY SNAPSHOT
    TABLE 77. VEOLIA: PRODUCT SEGMENTS
    TABLE 78. VEOLIA: PRODUCT PORTFOLIO
    TABLE 79. XYLEM: KEY EXECUTIVES
    TABLE 80. XYLEM: COMPANY SNAPSHOT
    TABLE 81. XYLEM: PRODUCT SEGMENTS
    TABLE 82. XYLEM: PRODUCT PORTFOLIO
    TABLE 83. XYLEM: KEY STRATERGIES
    TABLE 84. PENTAIR: KEY EXECUTIVES
    TABLE 85. PENTAIR: COMPANY SNAPSHOT
    TABLE 86. PENTAIR: PRODUCT SEGMENTS
    TABLE 87. PENTAIR: PRODUCT PORTFOLIO
    TABLE 88. PENTAIR: KEY STRATERGIES
    TABLE 89. GENERAL ELECTRIC: KEY EXECUTIVES
    TABLE 90. GENERAL ELECTRIC: COMPANY SNAPSHOT
    TABLE 91. GENERAL ELECTRIC: PRODUCT SEGMENTS
    TABLE 92. GENERAL ELECTRIC: PRODUCT PORTFOLIO
    TABLE 93. SUEZ: KEY EXECUTIVES
    TABLE 94. SUEZ: COMPANY SNAPSHOT
    TABLE 95. SUEZ: SERVICE SEGMENTS
    TABLE 96. SUEZ: PRODUCT PORTFOLIO
    TABLE 97. SUEZ: KEY STRATERGIES
    TABLE 98. CALGON CARBON CORPORATION: KEY EXECUTIVES
    TABLE 99. CALGON CARBON CORPORATION: COMPANY SNAPSHOT
    TABLE 100. CALGON CARBON CORPORATION: PRODUCT SEGMENTS
    TABLE 101. CALGON CARBON CORPORATION: PRODUCT PORTFOLIO
    TABLE 102. CULLIGAN WATER: KEY EXECUTIVES
    TABLE 103. CULLIGAN WATER: COMPANY SNAPSHOT
    TABLE 104. CULLIGAN WATER: PRODUCT SEGMENTS
    TABLE 105. CULLIGAN WATER: PRODUCT PORTFOLIO
    TABLE 106. LENNTECH B.V.: KEY EXECUTIVES
    TABLE 107. LENNTECH B.V.: COMPANY SNAPSHOT
    TABLE 108. LENNTECH B.V.: PRODUCT SEGMENTS
    TABLE 109. LENNTECH B.V.: PRODUCT PORTFOLIO
  • LIST OF FIGURES

  • FIGURE 01. WATER TREATMENT EQUIPMENT MARKET, 2022-2032
    FIGURE 02. SEGMENTATION OF WATER TREATMENT EQUIPMENT MARKET, 2022-2032
    FIGURE 03. TOP INVESTMENT POCKETS IN WATER TREATMENT EQUIPMENT MARKET (2023-2032)
    FIGURE 04. LOW BARGAINING POWER OF SUPPLIERS
    FIGURE 05. LOW BARGAINING POWER OF BUYERS
    FIGURE 06. LOW THREAT OF SUBSTITUTES
    FIGURE 07. LOW THREAT OF NEW ENTRANTS
    FIGURE 08. LOW INTENSITY OF RIVALRY
    FIGURE 09. DRIVERS, RESTRAINTS AND OPPORTUNITIES: GLOBALWATER TREATMENT EQUIPMENT MARKET
    FIGURE 10. PATENT ANALYSIS BY COMPANY
    FIGURE 11. PATENT ANALYSIS BY COUNTRY
    FIGURE 12. PRICING ANALYSIS: WATER TREATMENT EQUIPMENT MARKET 2022 AND 2032
    FIGURE 13. REGULATORY GUIDELINES: WATER TREATMENT EQUIPMENT MARKET
    FIGURE 14. WATER TREATMENT EQUIPMENT MARKET, BY TYPE, 2022(%)
    FIGURE 15. COMPARATIVE SHARE ANALYSIS OF WATER TREATMENT EQUIPMENT MARKET FOR PROCESS EQUIPMENT, BY COUNTRY 2022 AND 2032(%)
    FIGURE 16. COMPARATIVE SHARE ANALYSIS OF WATER TREATMENT EQUIPMENT MARKET FOR MUD TREATMENT, BY COUNTRY 2022 AND 2032(%)
    FIGURE 17. COMPARATIVE SHARE ANALYSIS OF WATER TREATMENT EQUIPMENT MARKET FOR FILTRATION SYSTEMS AND MEDIA, BY COUNTRY 2022 AND 2032(%)
    FIGURE 18. COMPARATIVE SHARE ANALYSIS OF WATER TREATMENT EQUIPMENT MARKET FOR DISINFECTION, BY COUNTRY 2022 AND 2032(%)
    FIGURE 19. COMPARATIVE SHARE ANALYSIS OF WATER TREATMENT EQUIPMENT MARKET FOR DIVERSIONS AND SCREENS, BY COUNTRY 2022 AND 2032(%)
    FIGURE 20. COMPARATIVE SHARE ANALYSIS OF WATER TREATMENT EQUIPMENT MARKET FOR METERS, BY COUNTRY 2022 AND 2032(%)
    FIGURE 21. COMPARATIVE SHARE ANALYSIS OF WATER TREATMENT EQUIPMENT MARKET FOR MEMBRANES, BY COUNTRY 2022 AND 2032(%)
    FIGURE 22. COMPARATIVE SHARE ANALYSIS OF WATER TREATMENT EQUIPMENT MARKET FOR OTHERS, BY COUNTRY 2022 AND 2032(%)
    FIGURE 23. WATER TREATMENT EQUIPMENT MARKET, BY END-USE INDUSTRY , 2022(%)
    FIGURE 24. COMPARATIVE SHARE ANALYSIS OF WATER TREATMENT EQUIPMENT MARKET FOR INDUSTRIAL WATER TREATMENT EQUIPMENT, BY COUNTRY 2022 AND 2032(%)
    FIGURE 25. COMPARATIVE SHARE ANALYSIS OF WATER TREATMENT EQUIPMENT MARKET FOR MUNICIPAL WATER TREATMENT EQUIPMENT, BY COUNTRY 2022 AND 2032(%)
    FIGURE 26. WATER TREATMENT EQUIPMENT MARKET BY REGION, 2022
    FIGURE 27. U.S. WATER TREATMENT EQUIPMENT MARKET, 2022-2032 ($MILLION)
    FIGURE 28. CANADA WATER TREATMENT EQUIPMENT MARKET, 2022-2032 ($MILLION)
    FIGURE 29. MEXICO WATER TREATMENT EQUIPMENT MARKET, 2022-2032 ($MILLION)
    FIGURE 30. GERMANY WATER TREATMENT EQUIPMENT MARKET, 2022-2032 ($MILLION)
    FIGURE 31. FRANCE WATER TREATMENT EQUIPMENT MARKET, 2022-2032 ($MILLION)
    FIGURE 32. UK WATER TREATMENT EQUIPMENT MARKET, 2022-2032 ($MILLION)
    FIGURE 33. ITALY WATER TREATMENT EQUIPMENT MARKET, 2022-2032 ($MILLION)
    FIGURE 34. SPAIN WATER TREATMENT EQUIPMENT MARKET, 2022-2032 ($MILLION)
    FIGURE 35. REST OF EUROPE WATER TREATMENT EQUIPMENT MARKET, 2022-2032 ($MILLION)
    FIGURE 36. CHINA WATER TREATMENT EQUIPMENT MARKET, 2022-2032 ($MILLION)
    FIGURE 37. INDIA WATER TREATMENT EQUIPMENT MARKET, 2022-2032 ($MILLION)
    FIGURE 38. JAPAN WATER TREATMENT EQUIPMENT MARKET, 2022-2032 ($MILLION)
    FIGURE 39. SOUTH KOREA WATER TREATMENT EQUIPMENT MARKET, 2022-2032 ($MILLION)
    FIGURE 40. AUSTRALIA WATER TREATMENT EQUIPMENT MARKET, 2022-2032 ($MILLION)
    FIGURE 41. REST OF ASIA-PACIFIC WATER TREATMENT EQUIPMENT MARKET, 2022-2032 ($MILLION)
    FIGURE 42. BRAZIL WATER TREATMENT EQUIPMENT MARKET, 2022-2032 ($MILLION)
    FIGURE 43. SAUDI ARABIA WATER TREATMENT EQUIPMENT MARKET, 2022-2032 ($MILLION)
    FIGURE 44. SOUTH AFRICA WATER TREATMENT EQUIPMENT MARKET, 2022-2032 ($MILLION)
    FIGURE 45. UAE WATER TREATMENT EQUIPMENT MARKET, 2022-2032 ($MILLION)
    FIGURE 46. REST OF LAMEA WATER TREATMENT EQUIPMENT MARKET, 2022-2032 ($MILLION)
    FIGURE 47. TOP WINNING STRATEGIES, BY YEAR
    FIGURE 48. TOP WINNING STRATEGIES, BY DEVELOPMENT
    FIGURE 49. TOP WINNING STRATEGIES, BY COMPANY
    FIGURE 50. PRODUCT MAPPING OF TOP 10 PLAYERS
    FIGURE 51. COMPETITIVE DASHBOARD
    FIGURE 52. COMPETITIVE HEATMAP: WATER TREATMENT EQUIPMENT MARKET
    FIGURE 53. TOP PLAYER POSITIONING, 2022
    FIGURE 54. ECOLAB: NET SALES, 2020-2022 ($MILLION)
    FIGURE 55. ECOLAB: RESEARCH & DEVELOPMENT EXPENDITURE, 2020-2022 ($MILLION)
    FIGURE 56. ECOLAB: REVENUE SHARE BY SEGMENT, 2022 (%)
    FIGURE 57. ECOLAB: REVENUE SHARE BY REGION, 2022 (%)
    FIGURE 58. HYDRANAUTICS: NET REVENUE, 2020-2022 ($MILLION)
    FIGURE 59. VEOLIA: NET REVENUE, 2020-2022 ($MILLION)
    FIGURE 60. VEOLIA: REVENUE SHARE BY SEGMENT, 2022 (%)
    FIGURE 61. VEOLIA: REVENUE SHARE BY REGION, 2022 (%)
    FIGURE 62. XYLEM: NET REVENUE, 2020-2022 ($MILLION)
    FIGURE 63. XYLEM: RESEARCH & DEVELOPMENT EXPENDITURE, 2020-2022 ($MILLION)
    FIGURE 64. XYLEM: REVENUE SHARE BY SEGMENT, 2022 (%)
    FIGURE 65. XYLEM: REVENUE SHARE BY REGION, 2022 (%)
    FIGURE 66. PENTAIR: NET SALES, 2020-2022 ($MILLION)
    FIGURE 67. PENTAIR: RESEARCH & DEVELOPMENT EXPENDITURE, 2020-2022 ($MILLION)
    FIGURE 68. PENTAIR: REVENUE SHARE BY SEGMENT, 2022 (%)
    FIGURE 69. PENTAIR: REVENUE SHARE BY REGION, 2022 (%)
    FIGURE 70. GENERAL ELECTRIC: NET REVENUE, 2020-2022 ($MILLION)
    FIGURE 71. GENERAL ELECTRIC: RESEARCH & DEVELOPMENT EXPENDITURE, 2020-2022 ($MILLION)
    FIGURE 72. GENERAL ELECTRIC: REVENUE SHARE BY SEGMENT, 2022 (%)
    FIGURE 73. GENERAL ELECTRIC: REVENUE SHARE BY REGION, 2022 (%)
    FIGURE 74. SUEZ: NET REVENUE, 2020-2022 ($MILLION)
    FIGURE 75. SUEZ: REVENUE SHARE BY SEGMENT, 2022 (%)
    FIGURE 76. SUEZ: REVENUE SHARE BY REGION, 2022 (%)


PURCHASE OPTIONS

Call or Email us

U.S.-Canada Toll-free: +1-800-792-5285
Int'l : +1-503-894-6022
Europe : +44-845-528-1300
Email : help@alliedmarketresearch.com
 
FREQUENTLY ASKED QUESTIONS?

A. Governments and regulatory bodies worldwide have been implementing strict water quality standards and regulations. These regulations have compelled industries to invest in advanced water treatment equipment to meet the required standards and ensure environmental compliance.

A. industrial water treatment equipment and municipal water treatment equipment application are the potential customers of Water Treatment Equipment market industry

A. Asia-Pacific region will provide more business opportunities for Water Treatment Equipment market in coming years.

A. The market players are adopting various growth strategies and also investing in R&D extensively to develop technically advanced unique products which are expected to drive the market size.

A. Calgon Carbon Corporation, Culligan Water, Ecolab, General Electric, Hydranautics, Pentair, Lenntech B.V., Suez, Veolia, and Xylem are the top players in Water Treatment Equipment market.

Looking for Customization?

 Customization Request

Have a Question?

 Speak with Analyst

Any Confusion?

 Inquire Before Buying

Have a glance of the Report

  Request Sample
RELATED TAGS

Purchase Full Report of
Water Treatment Equipment Market

Start reading instantly.
This Report and over 66,905+ more Reports, Available with Avenue Library. T&C*.

  • Online Only
  • $3,570
  • Online cloud access only
  • Restricted print, copy, paste & download
  • Read only
  • Free industry update
    (Within 180 days)
  • Free report update in next update cycle
    (May 2024 - May 2025)
  • Data Pack
  • $3,840
  • Restricted to one authorized user
  • One print only
  • Available in
    Excel
  • Free industry update
    (Within 180 days)
  •   Free report update in next update cycle
    (May 2024 - May 2025)
  • Single User
  • $5,730
  • Restricted to one authorized user
  • One print only
  • Available in
    PDF
  • Free industry update
    (Within 180 days)
  •   Free report update in next update cycle
    (May 2024 - May 2025)
  • Five Users
  • $6,450
  • Limited to five authorized users
  • Print upto five copies
  • Available in
    PDF
  • Free industry update
    (Within 180 days)
  •   Free report update in next update cycle
    (May 2024 - May 2025)
  • Enterprise
    License/PDF

  • $9,600
  • Unlimited
    within
    company/enterprise
  • Available in Excel & PDF
  • Free industry update
    (Within 180 days)
  •   Free report update in next update cycle
    (May 2024 - May 2025)
  • Library
    Membership

  • $999 $ 1,175
    Per User/ Per month/ Billed annually
  • Published Content
    E-access
  • Company Profiles
    E-access
  • Newly Added Content Access
  • 10 PDF
    Downloads
  • 5 Excel Data
    Pack Downloads
  • 250 Company Profiles PDF Downloads
  • Buy Now

*Taxes/Fees, if applicable will be added during checkout. All prices in USD

RELATED REPORTS
 

Why Allied Market Research?


Infallible Methodology

To ensure high-level data integrity, accurate analysis, and impeccable forecasts

Analyst Support

For complete satisfaction

Customization

On-demand customization of scope of the report to exactly meet your needs

TARGETED MARKET VIEW

Targeted market view to provide pertinent information and save time of readers

Get fresh content delivered

Get insights on topics that are crucial for your business. Stay abreast of your interest areas.

Get Industry Data Alerts

Why Allied Market Research?

Infallible Methodology

To ensure high-level data integrity, accurate analysis, and impeccable forecasts

Analyst Support

For complete satisfaction

Customization

On-demand customization of scope of the report to exactly meet your needs

TARGETED MARKET VIEW

Targeted market view to provide pertinent information and save time of readers