Report Code: A07823 | Dec 2020 | Pages: 230 | ||
Tables: 121 | Charts: 49 |
|
Pandemic disrupted the entire world and affected many industries.
Get detailed COVID-19 impact analysis on the Wave Energy Market
Request Now !
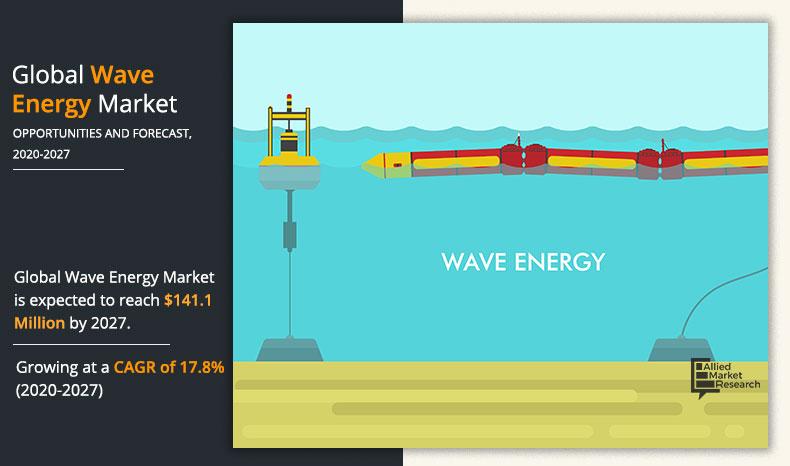
The global wave energy market size was valued at $43.8 million in 2019, and is projected to reach $141.1 million by 2027, growing at a CAGR of 17.8% from 2020 to 2027. Wave energy is the energy generated from the up and down movement of ocean waves. The ocean waves are generated from wind energy. Further, wave energy converters are used to extract the energy from these ocean waves, which in turn is used to generate electricity with the help of turbine and generators. This sector is still in the development stage and thus, there is need to increase the investment and R & D in the upcoming years. Wave energy can be extracted with the help of technologies including oscillating body converters, oscillating water column and overtopping converters.
Covid-19 pandemic has limited impact on the global wave energy market, owing to the restricted operations, shutdown of plants, and halted construction of new projects across the world.
Rapid development in the renewable energy sector and rise in demand for electricity from the marine industry are the key factors that drive the growth of the market during the forecast period. However, high capital investment in installing wave energy power infrastructure are the key factors restraining the growth of the market in the upcoming years. On the contrary, increase in government initiatives and investments in the renewable energy sector is anticipated to create opportunity for the key players in the wave energy industry globally.
The global wave energy market is segmented on the basis of technology, location, application, and region. Based on technology, it is categorized into oscillating water column, oscillating body converters, and overtopping converters. On the basis of location, it is bifurcated into onshore, offshore and near-shore. On the basis of application, it is segmented into power generation, water desalination, pumping of water, and environmental protection. Based on region, the market is analyzed across North America, Europe, Asia-Pacific, and LAMEA.
The key players operating in the global wave energy market are Ocean Power Technologies, Eco Wave Power, Sinn Power GmbH, Nemos GmbH, Ocean Energy Systems, AWS Ocean Energy Ltd., Wave Swell Energy Ltd, Carnegie Clean Energy Limted, Aquamarine Power Ltd., and Amog Consulting.
Other players operating in the market of wave energy are CorPower Ocean, Aquagen Technologies, Atlantis Resources Ltd., D.E. Energy Ltd., Marine Current Turbine Ltd., Ocean Renewable Power Company LLC, and Others.
The key players are adopting numerous strategies such as product launch, partnership, and acquisition, to stay competitive in the wave energy market.
For instance, CorPower Ocean has partnered with ABB, Ltd in the year 2020. Through this partnership, ABB, Ltd. will provide two transformers (one of which is located in buoy prototype). In addition, ABB, Ltd. will also provide equipment such as frequency converters, programming, installation and commissioning through this partnership.
By technology, the oscillating body converter segment held the largest wave energy market share in 2019, owing to the key characteristics of oscillating body converter such as high operating efficiency, small size, reliability and others.
On the basis of location, the near-shore segment dominated the global market in 2019, in terms of share, owing to the gaining importance of the near-shore installations from power generation and water desalination applications across the globe.
By application, in 2019, the power generation segment held the largest market share, this is owing to increase in investment in the renewable energy sector across the globe. In addition, increase in demand for power from the marine industry drive the growth of the market across the globe.
Europe garnered the highest share in the year 2019, in terms of wave energy market revenue, and is anticipated to maintain its dominance throughout the forecast period. This is attributed to the large number of key players and rise in wave energy generation in the region. In addition, rise in investment and government initiatives toward development of ocean wave energy technology is anticipated to drive the wave energy market growth in this region.
Key Benefits For Stakeholders
Wave Energy Market Report Highlights
Aspects | Details |
---|---|
By Technology |
|
By Location |
|
By Application |
|
By Region |
|
Key Market Players | NEMOS GmbH, CorPower Ocean AB, Atargis Energy Corporation, Eco Wave Power, Ltd., SINN Power GmbH, Ocean Power Technologies, Inc., Wave Swell Energy, Ltd., Carnegie Clean Energy Limited, AMOG Consulting, AWS Ocean Energy Ltd. |
CHAPTER 1:INTRODUCTION
1.1.Report description
1.2.Key benefits for stakeholders
1.3.Key market segments
1.4.Research methodology
1.4.1.Primary research
1.4.2.Secondary research
1.4.3.Analyst tools and models
CHAPTER 2:EXECUTIVE SUMMARY
2.1.Key findings
2.2.CXO perspective
CHAPTER 3:MARKET OVERVIEW
3.1.Market definition and scope
3.2.Key forces shaping the market
3.3.Top investment pockets
3.4.Patent analysis
3.4.1.By Region (2013-2019)
3.5.Market dynamics
3.5.1.Drivers
3.5.1.1.Rise in demand for electricity from the coastal communities
3.5.1.2.Easy and Abundant Availability of Wave Energy Source
3.5.2.Restraints
3.5.2.1.High Capital Investment & Insufficient Infrastructure
3.5.3.Opportunities
3.5.3.1.Government Initiatives & Investment in Renewable Energy Sector
3.6.Impact of CORONA (COVID-19) outbreak on the market
3.7.Strategic Developments in Global Wave Energy Market
CHAPTER 4:GLOBAL WAVE ENERGY MARKET, BY TECHNOLOGY
4.1.Overview
4.1.1.Market size and forecast, by technology
4.2.Oscillating Water Column
4.2.1.Key market trends, growth factors, and opportunities
4.2.2.Market size and forecast, by region
4.2.3.Market share analysis, by country
4.3.Oscillating body converters
4.3.1.Key market trends, growth factors, and opportunities
4.3.2.Market size and forecast, by region
4.3.3.Market share analysis, by country
4.4.Overtopping converters
4.4.1.Key market trends, growth factors, and opportunities
4.4.2.Market size and forecast, by region
4.4.3.Market share analysis, by country
CHAPTER 5:GLOBAL WAVE ENERGY MARKET, BY LOCATION
5.1.Overview
5.1.1.Market size and forecast, by location
5.2.Onshore
5.2.1.Key market trends, growth factors, and opportunities
5.2.2.Market size and forecast, by region
5.2.3.Market share analysis, by country
5.3.Offshore
5.3.1.Key market trends, growth factors, and opportunities
5.3.2.Market size and forecast, by region
5.3.3.Market share analysis, by country
5.4.Nearshore
5.4.1.Key market trends, growth factors, and opportunities
5.4.2.Market size and forecast, by region
5.4.3.Market share analysis, by country
CHAPTER 6:GLOBAL WAVE ENERGY MARKET, BY APPLICATION
6.1.Overview
6.1.1.Market size and forecast, by application
6.2.Power Generation
6.2.1.Key market trends, growth factors, and opportunities
6.2.2.Market size and forecast, by region
6.2.3.Market share analysis, by country
6.3.Water Desalination
6.3.1.Key market trends, growth factors, and opportunities
6.3.2.Market size and forecast, by region
6.3.3.Market share analysis, by country
6.4.Pumping of water
6.4.1.Key market trends, growth factors, and opportunities
6.4.2.Market size and forecast, by region
6.4.3.Market share analysis, by country
6.5.Environmental protection
6.5.1.Key market trends, growth factors, and opportunities
6.5.2.Market size and forecast, by region
6.5.3.Market share analysis, by country
CHAPTER 7:WAVE ENERGY MARKET, BY REGION
7.1.Overview
7.1.1.Market size and forecast, by region
7.2.North America
7.2.1.Key market trends, growth factors, and opportunities
7.2.2.Market size and forecast, by technology
7.2.3.Market size and forecast, by location
7.2.4.Market size and forecast, by application
7.2.5.Market size and forecast, by country
7.2.6.The U.S.
7.2.6.1.Market size and forecast, by technology
7.2.6.2.Market size and forecast, by location
7.2.6.3.Market size and forecast, by application
7.2.7.Canada
7.2.7.1.Market size and forecast, by technology
7.2.7.2.Market size and forecast, by location
7.2.7.3.Market size and forecast, by application
7.2.8.Mexico
7.2.8.1.Market size and forecast, by technology
7.2.8.2.Market size and forecast, by location
7.2.8.3.Market size and forecast, by application
7.3.Europe
7.3.1.Key market trends, growth factors, and opportunities
7.3.2.Market size and forecast, by technology
7.3.3.Market size and forecast, by location
7.3.4.Market size and forecast, by application
7.3.5.Market size and forecast, by country
7.3.6.Germany
7.3.6.1.Market size and forecast, by technology
7.3.6.2.Market size and forecast, by location
7.3.6.3.Market size and forecast, by application
7.3.7.France
7.3.7.1.Market size and forecast, by technology
7.3.7.2.Market size and forecast, by location
7.3.7.3.Market size and forecast, by application
7.3.8.UK
7.3.8.1.Market size and forecast, by technology
7.3.8.2.Market size and forecast, by location
7.3.8.3.Market size and forecast, by application
7.3.9.Spain
7.3.9.1.Market size and forecast, by technology
7.3.9.2.Market size and forecast, by location
7.3.9.3.Market size and forecast, by application
7.3.10.Italy
7.3.10.1.Market size and forecast, by technology
7.3.10.2.Market size and forecast, by location
7.3.10.3.Market size and forecast, by application
7.3.11.Rest of Europe
7.3.11.1.Market size and forecast, by technology
7.3.11.2.Market size and forecast, by location
7.3.11.3.Market size and forecast, by application
7.4.Asia-Pacific
7.4.1.Key market trends, growth factors, and opportunities
7.4.2.Market size and forecast, by technology
7.4.3.Market size and forecast, by location
7.4.4.Market size and forecast, by application
7.4.5.Market size and forecast, by country
7.4.6.China
7.4.6.1.Market size and forecast, by technology
7.4.6.2.Market size and forecast, by location
7.4.6.3.Market size and forecast, by application
7.4.7.India
7.4.7.1.Market size and forecast, by technology
7.4.7.2.Market size and forecast, by location
7.4.7.3.Market size and forecast, by application
7.4.8.Japan
7.4.8.1.Market size and forecast, by technology
7.4.8.2.Market size and forecast, by location
7.4.8.3.Market size and forecast, by application
7.4.9.Australia
7.4.9.1.Market size and forecast, by technology
7.4.9.2.Market size and forecast, by location
7.4.9.3.Market size and forecast, by application
7.4.10.South Korea
7.4.10.1.Market size and forecast, by technology
7.4.10.2.Market size and forecast, by location
7.4.10.3.Market size and forecast, by application
7.4.11.Rest of Asia-Pacific
7.4.11.1.Market size and forecast, by technology
7.4.11.2.Market size and forecast, by location
7.4.11.3.Market size and forecast, by application
7.5.LAMEA
7.5.1.Key market trends, growth factors, and opportunities
7.5.2.Market size and forecast, by technology
7.5.3.Market size and forecast, by location
7.5.4.Market size and forecast, by application
7.5.5.Market size and forecast, by country
7.5.6.Brazil
7.5.6.1.Market size and forecast, by technology
7.5.6.2.Market size and forecast, by location
7.5.6.3.Market size and forecast, by application
7.5.7.Saudi Arabia
7.5.7.1.Market size and forecast, by technology
7.5.7.2.Market size and forecast, by location
7.5.7.3.Market size and forecast, by application
7.5.8.South Africa
7.5.8.1.Market size and forecast, by technology
7.5.8.2.Market size and forecast, by location
7.5.8.3.Market size and forecast, by application
7.5.9.Rest of LAMEA
7.5.9.1.Market size and forecast, by technology
7.5.9.2.Market size and forecast, by location
7.5.9.3.Market size and forecast, by application
CHAPTER 8:COMPETITIVE LANDSCAPE
8.1.Introduction
8.1.1.Market player positioning, 2019
8.2.Top winning strategies
8.2.1.Top winning strategies, by year
8.2.2.Top winning strategies, by development
8.2.3.Top winning strategies, by company
8.3.Competitive heatmap
8.4.Key developments
8.4.1.New product launches
8.4.2.Joint Venture
8.4.3.Business Expansions
8.4.4.Agreements
8.4.5.Partnership
8.4.6.Collaborations
CHAPTER 9:COMPANY PROFILES
9.1.NEMOS GmbH
9.1.1.Company overview
9.1.2.Company snapshot
9.1.3.Product portfolio
9.2.CorPower Ocean AB
9.2.1.Company overview
9.2.2.Company snapshot
9.2.3.Product portfolio
9.2.4.Key strategic moves and developments
9.3.Ocean Power Technologies, Inc.
9.3.1.Company overview
9.3.2.Company snapshot
9.3.3.Product portfolio
9.3.4.Business performance
9.3.5.Key strategic moves and developments
9.4.SINN Power GmbH
9.4.1.Company overview
9.4.2.Company snapshot
9.4.3.Product portfolio
9.4.4.Key strategic moves and developments
9.5.AWS Ocean Energy Ltd.
9.5.1.Company overview
9.5.2.Company snapshot
9.5.3.Product portfolio
9.6.Carnegie Clean Energy Limited
9.6.1.Company overview
9.6.2.Company snapshot
9.6.3.Product portfolio
9.6.4.Business performance
9.6.5.Key strategic moves and developments
9.7.Wave Swell Energy, Ltd.
9.7.1.Company overview
9.7.2.Company snapshot
9.7.3.Product portfolio
9.8.AMOG Consulting
9.8.1.Company overview
9.8.2.Company snapshot
9.8.3.Product portfolio
9.9.Eco Wave Power, Ltd.
9.9.1.Company overview
9.9.2.Company snapshot
9.9.3.Product portfolio
9.9.4.Key strategic moves and developments
9.10.Atargis Energy Corporation
9.10.1.Company overview
9.10.2.Company snapshot
9.10.3.Product portfolio
9.10.4.Key strategic moves and developments
LIST OF TABLES
TABLE 01.GLOBAL WAVE ENERGY MARKET, BY TECHNOLOGY 2019–2027 ($MILLION)
TABLE 02.GLOBAL WAVE ENERGY MARKET FOR OSCILLATING WATER COLUMN, BY REGION, 2019–2027 ($MILLION)
TABLE 03.GLOBAL WAVE ENERGY MARKET FOR OSCILLATING BODY CONVERTERS, BY REGION, 2019–2027 ($MILLION)
TABLE 04.GLOBAL WAVE ENERGY MARKET FOR OVERTOPPING CONVERTERS, BY REGION, 2019–2027 ($MILLION)
TABLE 05.GLOBAL WAVE ENERGY MARKET, BY LOCATION 2019–2027 ($MILLION)
TABLE 06.GLOBAL ONSHORE WAVE ENERGY MARKET, BY REGION, 2019–2027 ($MILLION)
TABLE 07.GLOBAL OFFSHORE WAVE ENERGY MARKET, BY REGION, 2019–2027 ($MILLION)
TABLE 08.GLOBAL NEARSHORE WAVE ENERGY MARKET, BY REGION, 2019–2027 ($MILLION)
TABLE 09.GLOBAL WAVE ENERGY MARKET, BY APPLICATION 2019–2027 ($MILLION)
TABLE 10.GLOBAL WAVE ENERGY MARKET FOR POWER GENERATION, BY REGION, 2019–2027 ($MILLION)
TABLE 11.GLOBAL WAVE ENERGY MARKET FOR WATER DESALINATION, BY REGION, 2019–2027 ($MILLION)
TABLE 12.GLOBAL WAVE ENERGY MARKET FOR PUMPING OF WATER, BY REGION, 2019–2027 ($MILLION)
TABLE 13.GLOBAL WAVE ENERGY MARKET FOR ENVIRONMENTAL PROTECTION, BY REGION, 2019–2027 ($MILLION)
TABLE 14.GLOBAL WAVE ENERGY MARKET, BY REGION 2019–2027 ($MILLION)
TABLE 15.NORTH AMERICA WAVE ENERGY MARKET, BY TECHNOLOGY 2019–2027 ($MILLION)
TABLE 16.NORTH AMERICA WAVE ENERGY MARKET, BY LOCATION 2019–2027 ($MILLION)
TABLE 17.NORTH AMERICA WAVE ENERGY MARKET, BY APPLICATION 2019–2027 ($MILLION)
TABLE 18.NORTH AMERICA WAVE ENERGY MARKET, BY COUNTRY 2019–2027($MILLION)
TABLE 19.THE U.S. WAVE ENERGY MARKET, BY TECHNOLOGY 2019–2027($MILLION)
TABLE 20.THE U.S. WAVE ENERGY MARKET, BY LOCATION 2019–2027($MILLION)
TABLE 21.THE U.S. WAVE ENERGY MARKET, BY APPLICATION 2019–2027 ($MILLION)
TABLE 22.CANADA WAVE ENERGY MARKET, BY TECHNOLOGY 2019–2027($MILLION)
TABLE 23.CANADA WAVE ENERGY MARKET, BY LOCATION 2019–2027($MILLION)
TABLE 24.CANADA WAVE ENERGY MARKET, BY APPLICATION 2019–2027 ($MILLION)
TABLE 25.MEXICO WAVE ENERGY MARKET, BY TECHNOLOGY 2019–2027($MILLION)
TABLE 26.MEXICO WAVE ENERGY MARKET, BY LOCATION 2019–2027($MILLION)
TABLE 27.MEXICO WAVE ENERGY MARKET, BY APPLICATION 2019–2027 ($MILLION)
TABLE 28.EUROPE WAVE ENERGY MARKET, BY TECHNOLOGY 2019–2027 ($MILLION)
TABLE 29.EUROPE WAVE ENERGY MARKET, BY LOCATION 2019–2027 ($MILLION)
TABLE 30.EUROPE WAVE ENERGY MARKET, BY APPLICATION 2019–2027 ($MILLION)
TABLE 31.EUROPE WAVE ENERGY MARKET, BY COUNTRY 2019–2027 ($MILLION)
TABLE 32.GERMANY WAVE ENERGY MARKET, BY TECHNOLOGY 2019–2027($MILLION)
TABLE 33.GERMANY WAVE ENERGY MARKET, BY LOCATION 2019–2027($MILLION)
TABLE 34.GERMANY WAVE ENERGY MARKET, BY APPLICATION 2019–2027 ($MILLION)
TABLE 35.FRANCE WAVE ENERGY MARKET, BY TECHNOLOGY 2019–2027($MILLION)
TABLE 36.FRANCE WAVE ENERGY MARKET, BY LOCATION 2019–2027($MILLION)
TABLE 37.FRANCE WAVE ENERGY MARKET, BY APPLICATION 2019–2027 ($MILLION)
TABLE 38.UK WAVE ENERGY MARKET, BY TECHNOLOGY 2019–2027($MILLION)
TABLE 39.UK WAVE ENERGY MARKET, BY LOCATION 2019–2027($MILLION)
TABLE 40.UK WAVE ENERGY MARKET, BY APPLICATION 2019–2027 ($MILLION)
TABLE 41.SPAIN WAVE ENERGY MARKET, BY TECHNOLOGY 2019–2027($MILLION)
TABLE 42.SPAIN WAVE ENERGY MARKET, BY LOCATION 2019–2027($MILLION)
TABLE 43.SPAIN WAVE ENERGY MARKET, BY APPLICATION 2019–2027 ($MILLION)
TABLE 44.ITALY WAVE ENERGY MARKET, BY TECHNOLOGY 2019–2027($MILLION)
TABLE 45.ITALY WAVE ENERGY MARKET, BY LOCATION 2019–2027($MILLION)
TABLE 46.ITALY WAVE ENERGY MARKET, BY APPLICATION 2019–2027 ($MILLION)
TABLE 47.REST OF EUROPE WAVE ENERGY MARKET, BY TECHNOLOGY 2019–2027($MILLION)
TABLE 48.REST OF EUROPE WAVE ENERGY MARKET, BY LOCATION 2019–2027($MILLION)
TABLE 49.REST OF EUROPE WAVE ENERGY MARKET, BY APPLICATION 2019–2027 ($MILLION)
TABLE 50.ASIA-PACIFIC WAVE ENERGY MARKET, BY TECHNOLOGY 2019–2027 ($MILLION)
TABLE 51.ASIA-PACIFIC WAVE ENERGY MARKET, BY LOCATION 2019–2027 ($MILLION)
TABLE 52.ASIA-PACIFIC WAVE ENERGY MARKET, BY APPLICATION 2019–2027 ($MILLION)
TABLE 53.ASIA-PACIFIC WAVE ENERGY MARKET, BY COUNTRY 2019–2027 ($MILLION)
TABLE 54.CHINA WAVE ENERGY MARKET, BY TECHNOLOGY 2019–2027($MILLION)
TABLE 55.CHINA WAVE ENERGY MARKET, BY LOCATION 2019–2027($MILLION)
TABLE 56.CHINA WAVE ENERGY MARKET, BY APPLICATION 2019–2027 ($MILLION)
TABLE 57.INDIA WAVE ENERGY MARKET, BY TECHNOLOGY 2019–2027($MILLION)
TABLE 58.INDIA WAVE ENERGY MARKET, BY LOCATION 2019–2027($MILLION)
TABLE 59.INDIA WAVE ENERGY MARKET, BY APPLICATION 2019–2027 ($MILLION)
TABLE 60.JAPAN WAVE ENERGY MARKET, BY TECHNOLOGY 2019–2027($MILLION)
TABLE 61.JAPAN WAVE ENERGY MARKET, BY LOCATION 2019–2027($MILLION)
TABLE 62.JAPAN WAVE ENERGY MARKET, BY APPLICATION 2019–2027 ($MILLION)
TABLE 63.AUSTRALIA WAVE ENERGY MARKET, BY TECHNOLOGY 2019–2027($MILLION)
TABLE 64.AUSTRALIA WAVE ENERGY MARKET, BY LOCATION 2019–2027($MILLION)
TABLE 65.AUSTRALIA WAVE ENERGY MARKET, BY APPLICATION 2019–2027 ($MILLION)
TABLE 66.SOUTH KOREA WAVE ENERGY MARKET, BY TECHNOLOGY 2019–2027($MILLION)
TABLE 67.SOUTH KOREA WAVE ENERGY MARKET, BY LOCATION 2019–2027($MILLION)
TABLE 68.SOUTH KOREA WAVE ENERGY MARKET, BY APPLICATION 2019–2027 ($MILLION)
TABLE 69.REST OF ASIA-PACIFIC WAVE ENERGY MARKET, BY TECHNOLOGY 2019–2027($MILLION)
TABLE 70.REST OF ASIA-PACIFIC WAVE ENERGY MARKET, BY LOCATION 2019–2027($MILLION)
TABLE 71.REST OF ASIA-PACIFIC WAVE ENERGY MARKET, BY APPLICATION 2019–2027 ($MILLION)
TABLE 72.LAMEA WAVE ENERGY MARKET, BY TECHNOLOGY 2019–2027 ($MILLION)
TABLE 73.LAMEA WAVE ENERGY MARKET, BY LOCATION 2019–2027 ($MILLION)
TABLE 74.LAMEA WAVE ENERGY MARKET, BY APPLICATION 2019–2027 ($MILLION)
TABLE 75.LAMEA WAVE ENERGY MARKET, BY COUNTRY 2019–2027 ($MILLION)
TABLE 76.BRAZIL WAVE ENERGY MARKET, BY TECHNOLOGY 2019–2027($MILLION)
TABLE 77.BRAZIL WAVE ENERGY MARKET, BY LOCATION 2019–2027($MILLION)
TABLE 78.BRAZIL WAVE ENERGY MARKET, BY APPLICATION 2019–2027 ($MILLION)
TABLE 79.SAUDI ARABIA WAVE ENERGY MARKET, BY TECHNOLOGY 2019–2027($MILLION)
TABLE 80.SAUDI ARABIA WAVE ENERGY MARKET, BY LOCATION 2019–2027($MILLION)
TABLE 81.SAUDI ARABIA WAVE ENERGY MARKET, BY APPLICATION 2019–2027 ($MILLION)
TABLE 82.SOUTH AFRICA WAVE ENERGY MARKET, BY TECHNOLOGY 2019–2027($MILLION)
TABLE 83.SOUTH AFRICA WAVE ENERGY MARKET, BY LOCATION 2019–2027($MILLION)
TABLE 84.SOUTH AFRICA WAVE ENERGY MARKET, BY APPLICATION 2019–2027 ($MILLION)
TABLE 85.REST OF LAMEA WAVE ENERGY MARKET, BY TECHNOLOGY 2019–2027($MILLION)
TABLE 86.REST OF LAMEA WAVE ENERGY MARKET, BY LOCATION 2019–2027($MILLION)
TABLE 87.REST OF LAMEA WAVE ENERGY MARKET, BY APPLICATION 2019–2027 ($MILLION)
TABLE 88.KEY NEW PRODUCT LAUNCHES (2017-2020)
TABLE 89.KEY JOINT VENTURE (2017-2020)
TABLE 90.KEY BUSINESS EXPANSIONS (2017-2020)
TABLE 91.KEY AGREEMENTS (2017-2020)
TABLE 92.KEY PARTNERSHIP (2017-2020)
TABLE 93.KEY COLLABORATIONS (2017-2020)
TABLE 94.NEMOS GMBH: COMPANY SNAPSHOT
TABLE 95.NEMOS GMBH: PRODUCT PORTFOLIO
TABLE 96.CORPOWER: COMPANY SNAPSHOT
TABLE 97.CORPOWER: PRODUCT PORTFOLIO
TABLE 98.CORPOWER: KEY STRATEGIC MOVES AND DEVELOPMENTS
TABLE 99.OCEAN POWER: COMPANY SNAPSHOT
TABLE 100.OCEAN POWER: PRODUCT PORTFOLIO
TABLE 101.OVERALL FINANCIAL STATUS ($MILLION)
TABLE 102.OCEAN POWER: KEY STRATEGIC MOVES AND DEVELOPMENTS
TABLE 103.SINN: COMPANY SNAPSHOT
TABLE 104.SINN: PRODUCT PORTFOLIO
TABLE 105.SINN: KEY STRATEGIC MOVES AND DEVELOPMENTS
TABLE 106.AWS: COMPANY SNAPSHOT
TABLE 107.AWS: PRODUCT PORTFOLIO
TABLE 108.CARNEGIE: COMPANY SNAPSHOT
TABLE 109.CARNEGIE: PRODUCT PORTFOLIO
TABLE 110.OVERALL FINANCIAL STATUS ($MILLION)
TABLE 111.CARNEGIE: KEY STRATEGIC MOVES AND DEVELOPMENTS
TABLE 112.WSE: COMPANY SNAPSHOT
TABLE 113.WSE: PRODUCT PORTFOLIO
TABLE 114.AMOG CONSULTING: COMPANY SNAPSHOT
TABLE 115.AMOG CONSULTING: PRODUCT PORTFOLIO
TABLE 116.ECO WAVE POWER, LTD.: COMPANY SNAPSHOT
TABLE 117.ECO WAVE POWER LTD.: PRODUCT PORTFOLIO
TABLE 118.ECO WAVE POWER, LTD.: KEY STRATEGIC MOVES AND DEVELOPMENTS
TABLE 119.ATARGIS ENERGY CORPORATION: COMPANY SNAPSHOT
TABLE 120.ATARGIS ENERGY CORPORATION: PRODUCT PORTFOLIO
TABLE 121.ATARGIS ENERGY CORPORATION: KEY STRATEGIC MOVES AND DEVELOPMENTS
LIST OF FIGURES
FIGURE 01.KEY MARKET SEGMENTS
FIGURE 02.MODERATE BARGAINING POWER OF SUPPLIERS
FIGURE 03.MODERATE THREAT OF NEW ENTRANTS
FIGURE 04.MODERATE THREAT OF SUBSTITUTES
FIGURE 05.MODERATE INTENSITY OF COMPETITIVE RIVALRY
FIGURE 06.MODERATE BARGAINING POWER OF BUYERS
FIGURE 07.TOP INVESTMENT POCKETS
FIGURE 08.PATENT ANALYSIS, BY REGION
FIGURE 09.WAVE ENERGY MARKET DYNAMICS
FIGURE 10.GLOBAL WAVE ENERGY MARKET REVENUE, BY TECHNOLOGY ($MILLION)
FIGURE 11.COMPARATIVE ANALYSIS OF WAVE ENERGY MARKET FOR OSCILLATING WATER COLUMN, BY COUNTRY, 2019 & 2027 ($MILLION)
FIGURE 12.COMPARATIVE ANALYSIS OF WAVE ENERGY MARKET FOR OSCILLATING BODY CONVERTERS, BY COUNTRY, 2019 & 2027 ($MILLION)
FIGURE 13.COMPARATIVE ANALYSIS OF WAVE ENERGY MARKET FOR OVERTOPPING CONVERTERS, BY COUNTRY, 2019 & 2027 ($MILLION)
FIGURE 14.GLOBAL WAVE ENERGY MARKET REVENUE, BY LOCATION ($MILLION)
FIGURE 15.COMPARATIVE ANALYSIS OF ONSHORE WAVE ENERGY MARKET, BY COUNTRY, 2019 & 2027 ($MILLION)
FIGURE 16.COMPARATIVE ANALYSIS OF OFFSHORE WAVE ENERGY MARKET, BY COUNTRY, 2019 & 2027 ($MILLION)
FIGURE 17.COMPARATIVE ANALYSIS OF NEARSHORE WAVE ENERGY MARKET, BY COUNTRY, 2019 & 2027 ($MILLION)
FIGURE 18.GLOBAL WAVE ENERGY MARKET REVENUE, BY APPLICATION ($MILLION)
FIGURE 19.COMPARATIVE ANALYSIS OF WAVE ENERGY MARKET FOR POWER GENERATION, BY COUNTRY, 2019 & 2027 ($MILLION)
FIGURE 20.COMPARATIVE ANALYSIS OF WAVE ENERGY MARKET FOR WATER DESALINATION, BY COUNTRY, 2019 & 2027 ($MILLION)
FIGURE 21.COMPARATIVE ANALYSIS OF WAVE ENERGY MARKET FOR PUMPING OF WATER, BY COUNTRY, 2019 & 2027 ($MILLION)
FIGURE 22.COMPARATIVE ANALYSIS OF WAVE ENERGY MARKET FOR ENVIRONMENTAL PROTECTION, BY COUNTRY, 2019 & 2027 ($MILLION)
FIGURE 23.THE U.S. WAVE ENERGY MARKET REVENUE (2019-2027) ($MILLION)
FIGURE 24.CANADA WAVE ENERGY MARKET REVENUE (2019-2027) ($MILLION)
FIGURE 25.MEXICO WAVE ENERGY MARKET REVENUE (2019-2027) ($MILLION)
FIGURE 26.GERMANY WAVE ENERGY MARKET REVENUE (2019-2027) ($MILLION)
FIGURE 27.FRANCE WAVE ENERGY MARKET REVENUE (2019-2027) ($MILLION)
FIGURE 28.UK WAVE ENERGY MARKET REVENUE (2019-2027) ($MILLION)
FIGURE 29.SPAIN WAVE ENERGY MARKET REVENUE (2019-2027) ($MILLION)
FIGURE 30.ITALY WAVE ENERGY MARKET REVENUE (2019-2027) ($MILLION)
FIGURE 31.REST OF EUROPE WAVE ENERGY MARKET REVENUE (2019-2027) ($MILLION)
FIGURE 32.CHINA WAVE ENERGY MARKET REVENUE (2019-2027) ($MILLION)
FIGURE 33.INDIA WAVE ENERGY MARKET REVENUE (2019-2027) ($MILLION)
FIGURE 34.JAPAN WAVE ENERGY MARKET REVENUE (2019-2027) ($MILLION)
FIGURE 35.AUSTRALIA WAVE ENERGY MARKET REVENUE (2019-2027) ($MILLION)
FIGURE 36.SOUTH KOREA WAVE ENERGY MARKET REVENUE (2019-2027) ($MILLION)
FIGURE 37.REST OF ASIA-PACIFIC WAVE ENERGY MARKET REVENUE (2019-2027) ($MILLION)
FIGURE 38.BRAZIL WAVE ENERGY MARKET REVENUE (2019-2027) ($MILLION)
FIGURE 39.SAUDI ARABIA WAVE ENERGY MARKET REVENUE (2019-2027) ($MILLION)
FIGURE 40.SOUTH AFRICA WAVE ENERGY MARKET REVENUE (2019-2027) ($MILLION)
FIGURE 41.REST OF LAMEA WAVE ENERGY MARKET REVENUE (2019-2027) ($MILLION)
FIGURE 42.MARKET PLAYER POSITIONING, 2019
FIGURE 43.TOP WINNING STRATEGIES, BY YEAR, 2017–2020
FIGURE 44.TOP WINNING STRATEGIES, BY DEVELOPMENT, 2017–2020 (%)
FIGURE 45.TOP WINNING STRATEGIES, BY COMPANY, 2017–2020
FIGURE 46.COMPETITIVE HEATMAP OF KEY PLAYERS
FIGURE 47.OCEAN POWER: REVENUE, 2017–2019 ($MILLION)
FIGURE 48.OCEAN POWER: REVENUE SHARE BY REGION, 2019 (%)
FIGURE 49.CARNEGIE: REVENUE, 2017–2019 ($MILLION)
Rapid adoption of wave energy generation is the key factor attributed to the leading position of Europe in the global wave energy market. The Europe region is further expected to provide lucrative opportunities to leading wave energy converter product manufacturers, owing to its huge potential to set up manufacturing plants and surge in demand for electricity from the coastal communities in the region.
Easy and wide availability of wave energy across the globe is expected drive the growth of the wave energy market in the upcoming years. However, high capital investment is the key factor expected to hinder the market growth during the forecast period. On the contrary, increase in government initiatives and investments in the renewable energy sector is anticipated to provide remunerative opportunity for the key players to maintain the pace in the wave energy market in the upcoming years.
Among the analyzed geographical regions, Asia-Pacific is expected to account for the highest revenue growth rate in the wave energy market throughout the forecast period, followed by North America, Europe, and LAMEA.
A. The applications of the global wave energy market are electricity generation, water desalination, water pumping, and environmental protection.
A. Effecting factors in the growth of the wave energy market are growing demand for electricity from the marine industry and easy & abundant availability of the ocean wave energy.
A. To get latest version of wave energy market report can be obtained on demand from the website.
A. In terms of revenue, the total market value of the global wave energy market was valued at $43.8 million in 2019 and is expected to reach $141.1 million by 2027.
A. Key growth strategies adopted by the industry players in the wave energy market are product launch, agreement, business expansion and others.
A. The top ten market players are selected based on two key attributes - competitive strength and market positioning.
A. On the basis of technology, oscillating body converters holds the highest market share in the wave energy market. By location, nearshore segment registered the maximum market share in this market. On the basis of application power generation holds the highest market share in the market.
A. Company profiles has been selected on the basis of various key factors including key development strategies, market revenue, product offering, and others.
A. In terms of revenue, the market value of wave energy market is $44.7 million in the year 2020, growing at CAGR of 17.8% from 2020 to 2027.
A. On the basis of technology, oscillating body converters segment will influence the growth of the wave energy market growth during the forecast period. On the basis of location, nearshore wave energy location is expected to influence the growth of the wave energy market. On the basis of application, environmental protection will propel the growth of the market.
Start reading instantly.
This Report and over 67,132+ more Reports, Available with Avenue Library. T&C*.
Enterprise
License/PDF
Library
Membership
*Taxes/Fees, if applicable will be added during checkout. All prices in USD
To ensure high-level data integrity, accurate analysis, and impeccable forecasts
For complete satisfaction
On-demand customization of scope of the report to exactly meet your needs
Targeted market view to provide pertinent information and save time of readers
Get insights on topics that are crucial for your business. Stay abreast of your interest areas.
Get Industry Data AlertsTo ensure high-level data integrity, accurate analysis, and impeccable forecasts
For complete satisfaction
On-demand customization of scope of the report to exactly meet your needs
Targeted market view to provide pertinent information and save time of readers