0
2022
Wax Market

Wax Market

by Application (Candles, Packaging, Emulsions, Hot Melts, Floor Polishes, Others), by Type (Paraffin/Mineral Wax, Synthetic Wax, Natural Wax, Others): Global Opportunity Analysis and Industry Forecast, 2020-2030

✷  Report Code: A04224
Apr 2022 | Pages: 280
Tables: 169
Charts: 63
  • Formats*:

  • pdf

    Single User License, Five User
    License & Enterprise User License

  • xls

    Data Pack Excel License

  • ppt

    It comes with the additional cost
    of $2500.00 contact sales.


Wax Market Research, 2030

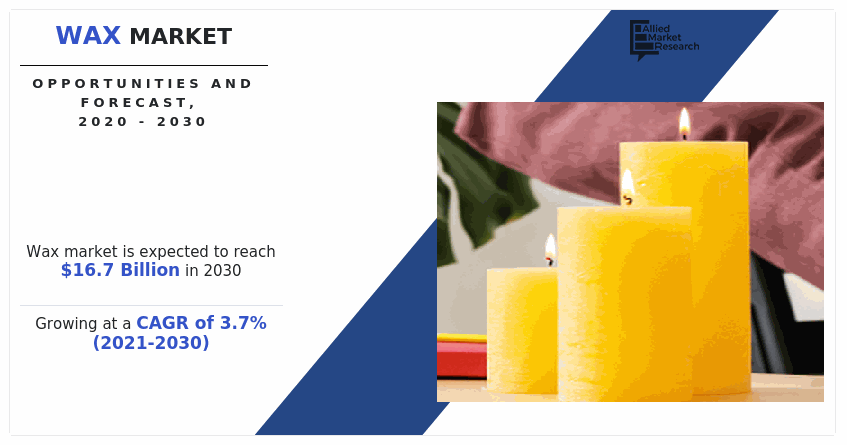
The global wax market was valued at $11.6 billion in 2020, and is projected to reach $16.7 billion by 2030, growing at a CAGR of 3.7% from 2021 to 2030.

The supply of raw materials to the industries decreased and caused a disturbance in supply and demand balance. Owing to all these factors, the oil market is negatively impacted by COVID-19 and the production of wax is decreased.

Wax Market, Wax Market Size, Wax Market Share, Wax Market Growth, Wax Market Trend, Wax Market Analysis, Wax Market Forecast, -, -, -

Wax is the member of organic compounds that is malleable and hydrophobic at ambient temperatures. It includes lipids and higher alkanes that are insoluble in water but are soluble in nonpolar, organic solvents.  Mineral, natural, and synthetic waxes are made from petroleum-based materials, including base oil and natural gas, as well as compounds like polyethylene, plants, and animals. Wax is used extensively in coating and printing compositions. Properties including mark and scratch resistance, rub resistance, and water repellency make it popular in paint, coating, and printing ink industries. It is used in variety of inks, including letterpress, lithographic, gravure, and flexographic. Other properties of wax in the coating and ink industry include in blockage, improvement in friction, anti-setting, and anti-sagging.

The major factor driving the growth of the market is increase in demand for wax  from candle and packaging industries. . Growth in personal care industry in the Asia-Pacific ​is other factor driving the market growth. The demand for home decor items, including colored and scented candles fuel the market growth of wax. The use of candles shifted from a commodity that gives light to a luxury. Candles are now used as a decorative item and make a perfect gift. Thus, the trend among people to use candles of  their choice , including color and fragrance ,which lightens up the ambiance of the room increase the demand for wax.

Another trend in the industry is the use and demand for bio-based waxes. This demand is primarily due to the fact that consumers are concerned about the potential adverse health effects of chemical products. Therefore, there is a shift to organic or green products that are emerging in the wax market. Several manufacturers of cosmetics and care products develop bio-based products. For example, Burt's Bees (USA), in October 2017 ,launched beeswax-based balms and other cosmetics and, in 2020, sold one balm per second across the globe. On the other hand, fluctuations in commodity prices and environmental problems hinder market growth.

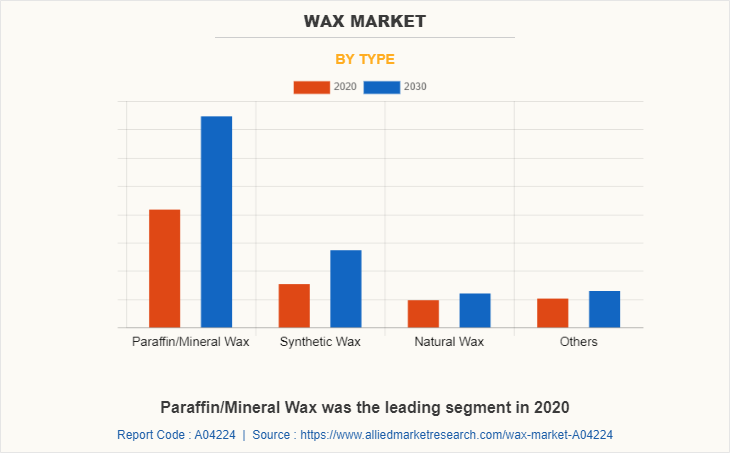
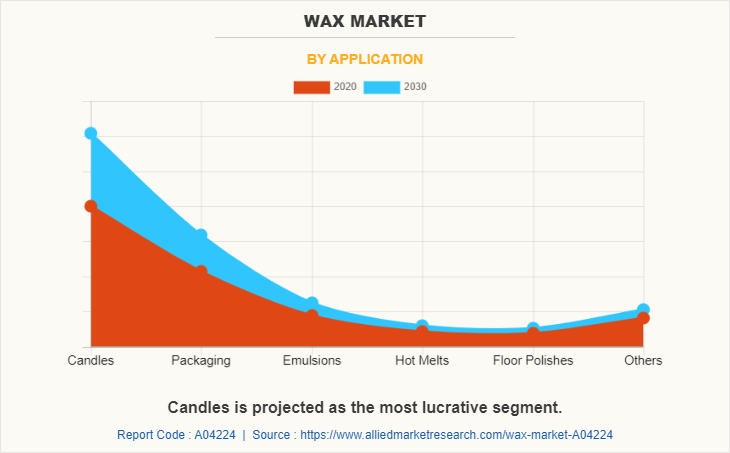
The wax market is segmented on the basis of type, application, and region. By type, the market is segregated into paraffin/mineral wax, synthetic wax, natural wax, and others. On the basis of application, it is fragmented into candles, packaging, emulsions, hot melts, floor polishes, and others. Region-wise, it is analyzed across North America, Europe, Asia-Pacific, and LAMEA.

The key players profiled in this report include Akzo Nobel N.V., Baker Hugher Company, BASF SE, Cepsa, China National Petroleum Corporation, Evonik Industries AG, Exxon Mobil Corporation, HollyFrontier Sinclair Corporation, Honeywell International Inc., The International Group Inc.

The global wax market report provides in-depth competitive analysis as well as profiles of these major players.

Wax Market

By type, the paraffin/mineral wax segment accounted for around 70.0% of the wax market share in 2020. In packaging industry paraffin wax is used for coating the packaged material. In cosmetics, paraffin wax is used as an additive. Moreover, paraffin wax is used in electrical insulation and in the lubrication industry.

Wax Market

On the basis of application, the candles segment accounted for around 60.2% of the global wax market share in 2020. An increasing number of distribution channels, including décor and mass merchandise stores and e-commerce platforms aided in propelling candle demand across the globe. The packaging application segment accounted for the second-largest revenue share in 2021.

Wax Market

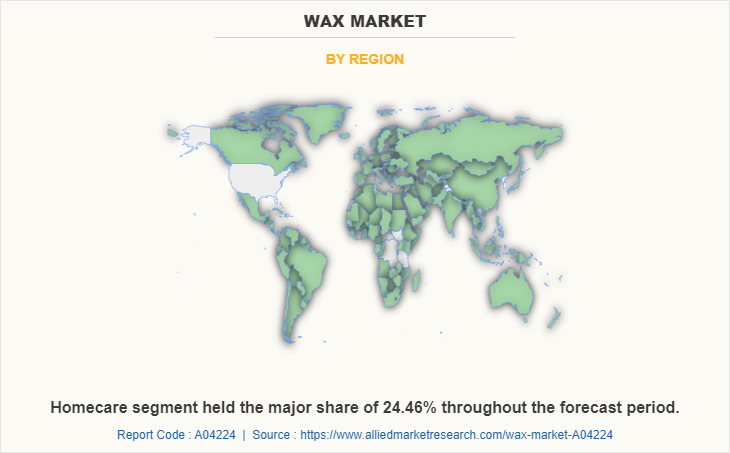
Region-wise, the Asia-pacific segment accounted for around 31.1% of the global wax market share in 2020.  The market growth is anticipated, owing to low labor, raw material, and operational costs. The rise in utilization of cosmetic products, including creams, lotions, sunscreens, and makeup among the youth of Japan, India, Indonesia, Korea, and China is expected to boost market growth.

Impact of COVID-19 on Global Wax Market

  •  
  • The outbreak of COVID-19 led to partial or complete shutdown of production facilities that do not come under essential goods, owing to prolonged lockdown in major countries, including the U.S., China, Japan, India, and Germany. It led to either closure or suspension of their production activities in most of the industrial units across the globe.
  • COVID-19 pandemic stagnated production activities in various areas such as packaging, cosmetics, chemicals, and candle making. Supply chain disruptions disrupted the supply of raw materials to these industries. As a result, the demand for wax from these industries that depended on wax for production declined. In addition, the decline in demand for cosmetics, candles, and consumer goods reduced the demand for waxes across the globe.

Key Benefits For Stakeholders

  • This report provides a quantitative analysis of the market segments, current trends, estimations, and dynamics of the wax market analysis from 2020 to 2030 to identify the prevailing wax market opportunities.
  • The market research is offered along with information related to key drivers, restraints, and opportunities.
  • Porter's five forces analysis highlights the potency of buyers and suppliers to enable stakeholders make profit-oriented business decisions and strengthen their supplier-buyer network.
  • In-depth analysis of the wax market segmentation assists to determine the prevailing market opportunities.
  • Major countries in each region are mapped according to their revenue contribution to the global market.
  • Market player positioning facilitates benchmarking and provides a clear understanding of the present position of the market players.
  • The report includes the analysis of the regional as well as global wax market trends, key players, market segments, application areas, and market growth strategies.

Wax Market Report Highlights

Aspects Details
By Application
  • Candles
  • Packaging
  • Emulsions
  • Hot Melts
  • Floor Polishes
  • Others
By Type
  • Paraffin/Mineral Wax
  • Synthetic Wax
  • Natural Wax
  • Others
By Region
  • North America  (U.S., Canada, Mexico)
  • Europe  (France, Italy, Germany, Spain, U.K., Rest of Europe)
  • Asia-Pacific  (China, India, Japan, South Korea, Australia, Rest of Asia-Pacific)
  • LAMEA  (Brazil, South Africa, Saudi Arabia, Rest of LAMEA)
Key Market Players BASF SE, china national petroleum corporation, Akzo Nobel N.V., Honeywell International Inc., HollyFrontier Sinclair Corporation, Exxon Mobil Corporation, Baker Hughes Company, Cepsa, Evonik Industries AG, The International Group Inc.
 
  • CHAPTER 1:INTRODUCTION

    • 1.1.Report description

    • 1.2.Key market segments

    • 1.3.Key benefits to the stakeholders

    • 1.4.Research Methodology

      • 1.4.1.Secondary research

      • 1.4.2.Primary research

      • 1.4.3.Analyst tools and models

  • CHAPTER 2:EXECUTIVE SUMMARY

    • 2.1.Key findings of the study

    • 2.2.CXO Perspective

  • CHAPTER 3:MARKET OVERVIEW

    • 3.1.Market definition and scope

    • 3.2.Key findings

      • 3.2.1.Top investment pockets

    • 3.3.Porter’s five forces analysis

    • 3.4.Top player positioning

    • 3.5.Market dynamics

      • 3.5.1.Drivers

      • 3.5.2.Restraints

      • 3.5.3.Opportunities

    • 3.6.COVID-19 Impact Analysis on the market

    • 3.7.Pricing Analysis

    • 3.8.Regulatory Guidelines

    • 3.9.Patent Landscape

  • CHAPTER 4: WAX MARKET, BY APPLICATION

    • 4.1 Overview

      • 4.1.1 Market size and forecast

    • 4.2 Candles

      • 4.2.1 Key market trends, growth factors and opportunities

      • 4.2.2 Market size and forecast, by region

      • 4.2.3 Market analysis by country

    • 4.3 Packaging

      • 4.3.1 Key market trends, growth factors and opportunities

      • 4.3.2 Market size and forecast, by region

      • 4.3.3 Market analysis by country

    • 4.4 Emulsions

      • 4.4.1 Key market trends, growth factors and opportunities

      • 4.4.2 Market size and forecast, by region

      • 4.4.3 Market analysis by country

    • 4.5 Hot Melts

      • 4.5.1 Key market trends, growth factors and opportunities

      • 4.5.2 Market size and forecast, by region

      • 4.5.3 Market analysis by country

    • 4.6 Floor Polishes

      • 4.6.1 Key market trends, growth factors and opportunities

      • 4.6.2 Market size and forecast, by region

      • 4.6.3 Market analysis by country

    • 4.7 Others

      • 4.7.1 Key market trends, growth factors and opportunities

      • 4.7.2 Market size and forecast, by region

      • 4.7.3 Market analysis by country

  • CHAPTER 5: WAX MARKET, BY TYPE

    • 5.1 Overview

      • 5.1.1 Market size and forecast

    • 5.2 Paraffin/Mineral Wax

      • 5.2.1 Key market trends, growth factors and opportunities

      • 5.2.2 Market size and forecast, by region

      • 5.2.3 Market analysis by country

    • 5.3 Synthetic Wax

      • 5.3.1 Key market trends, growth factors and opportunities

      • 5.3.2 Market size and forecast, by region

      • 5.3.3 Market analysis by country

    • 5.4 Natural Wax

      • 5.4.1 Key market trends, growth factors and opportunities

      • 5.4.2 Market size and forecast, by region

      • 5.4.3 Market analysis by country

    • 5.5 Others

      • 5.5.1 Key market trends, growth factors and opportunities

      • 5.5.2 Market size and forecast, by region

      • 5.5.3 Market analysis by country

  • CHAPTER 6: WAX MARKET, BY REGION

    • 6.1 Overview

      • 6.1.1 Market size and forecast

    • 6.2 North America

      • 6.2.1 Key trends and opportunities

      • 6.2.2 North America Market size and forecast, by Application

      • 6.2.3 North America Market size and forecast, by Type

      • 6.2.4 North America Market size and forecast, by country

        • 6.2.4.1 U.S.
          • 6.2.4.1.1 Market size and forecast, by Application
          • 6.2.4.1.2 Market size and forecast, by Type
        • 6.2.4.2 Canada
          • 6.2.4.2.1 Market size and forecast, by Application
          • 6.2.4.2.2 Market size and forecast, by Type
        • 6.2.4.3 Mexico
          • 6.2.4.3.1 Market size and forecast, by Application
          • 6.2.4.3.2 Market size and forecast, by Type
    • 6.3 Europe

      • 6.3.1 Key trends and opportunities

      • 6.3.2 Europe Market size and forecast, by Application

      • 6.3.3 Europe Market size and forecast, by Type

      • 6.3.4 Europe Market size and forecast, by country

        • 6.3.4.1 Germany
          • 6.3.4.1.1 Market size and forecast, by Application
          • 6.3.4.1.2 Market size and forecast, by Type
        • 6.3.4.2 France
          • 6.3.4.2.1 Market size and forecast, by Application
          • 6.3.4.2.2 Market size and forecast, by Type
        • 6.3.4.3 Italy
          • 6.3.4.3.1 Market size and forecast, by Application
          • 6.3.4.3.2 Market size and forecast, by Type
        • 6.3.4.4 Spain
          • 6.3.4.4.1 Market size and forecast, by Application
          • 6.3.4.4.2 Market size and forecast, by Type
        • 6.3.4.5 U.K.
          • 6.3.4.5.1 Market size and forecast, by Application
          • 6.3.4.5.2 Market size and forecast, by Type
        • 6.3.4.6 Rest of Europe
          • 6.3.4.6.1 Market size and forecast, by Application
          • 6.3.4.6.2 Market size and forecast, by Type
    • 6.4 Asia-Pacific

      • 6.4.1 Key trends and opportunities

      • 6.4.2 Asia-Pacific Market size and forecast, by Application

      • 6.4.3 Asia-Pacific Market size and forecast, by Type

      • 6.4.4 Asia-Pacific Market size and forecast, by country

        • 6.4.4.1 China
          • 6.4.4.1.1 Market size and forecast, by Application
          • 6.4.4.1.2 Market size and forecast, by Type
        • 6.4.4.2 India
          • 6.4.4.2.1 Market size and forecast, by Application
          • 6.4.4.2.2 Market size and forecast, by Type
        • 6.4.4.3 Japan
          • 6.4.4.3.1 Market size and forecast, by Application
          • 6.4.4.3.2 Market size and forecast, by Type
        • 6.4.4.4 South Korea
          • 6.4.4.4.1 Market size and forecast, by Application
          • 6.4.4.4.2 Market size and forecast, by Type
        • 6.4.4.5 Australia
          • 6.4.4.5.1 Market size and forecast, by Application
          • 6.4.4.5.2 Market size and forecast, by Type
        • 6.4.4.6 Rest of Asia-Pacific
          • 6.4.4.6.1 Market size and forecast, by Application
          • 6.4.4.6.2 Market size and forecast, by Type
    • 6.5 LAMEA

      • 6.5.1 Key trends and opportunities

      • 6.5.2 LAMEA Market size and forecast, by Application

      • 6.5.3 LAMEA Market size and forecast, by Type

      • 6.5.4 LAMEA Market size and forecast, by country

        • 6.5.4.1 Brazil
          • 6.5.4.1.1 Market size and forecast, by Application
          • 6.5.4.1.2 Market size and forecast, by Type
        • 6.5.4.2 South Africa
          • 6.5.4.2.1 Market size and forecast, by Application
          • 6.5.4.2.2 Market size and forecast, by Type
        • 6.5.4.3 Saudi Arabia
          • 6.5.4.3.1 Market size and forecast, by Application
          • 6.5.4.3.2 Market size and forecast, by Type
        • 6.5.4.4 Rest of LAMEA
          • 6.5.4.4.1 Market size and forecast, by Application
          • 6.5.4.4.2 Market size and forecast, by Type
  • CHAPTER 7: COMPANY LANDSCAPE

    • 7.1. Introduction

    • 7.2. Top winning strategies

    • 7.3. Product Mapping of Top 10 Player

    • 7.4. Competitive Dashboard

    • 7.5. Competitive Heatmap

    • 7.6. Key developments

  • CHAPTER 8: COMPANY PROFILES

    • 8.1 Akzo Nobel N.V.

      • 8.1.1 Company overview

      • 8.1.2 Company snapshot

      • 8.1.3 Operating business segments

      • 8.1.4 Product portfolio

      • 8.1.5 Business performance

      • 8.1.6 Key strategic moves and developments

    • 8.2 Baker Hughes Company

      • 8.2.1 Company overview

      • 8.2.2 Company snapshot

      • 8.2.3 Operating business segments

      • 8.2.4 Product portfolio

      • 8.2.5 Business performance

      • 8.2.6 Key strategic moves and developments

    • 8.3 BASF SE

      • 8.3.1 Company overview

      • 8.3.2 Company snapshot

      • 8.3.3 Operating business segments

      • 8.3.4 Product portfolio

      • 8.3.5 Business performance

      • 8.3.6 Key strategic moves and developments

    • 8.4 Cepsa

      • 8.4.1 Company overview

      • 8.4.2 Company snapshot

      • 8.4.3 Operating business segments

      • 8.4.4 Product portfolio

      • 8.4.5 Business performance

      • 8.4.6 Key strategic moves and developments

    • 8.5 china national petroleum corporation

      • 8.5.1 Company overview

      • 8.5.2 Company snapshot

      • 8.5.3 Operating business segments

      • 8.5.4 Product portfolio

      • 8.5.5 Business performance

      • 8.5.6 Key strategic moves and developments

    • 8.6 Evonik Industries AG

      • 8.6.1 Company overview

      • 8.6.2 Company snapshot

      • 8.6.3 Operating business segments

      • 8.6.4 Product portfolio

      • 8.6.5 Business performance

      • 8.6.6 Key strategic moves and developments

    • 8.7 Exxon Mobil Corporation

      • 8.7.1 Company overview

      • 8.7.2 Company snapshot

      • 8.7.3 Operating business segments

      • 8.7.4 Product portfolio

      • 8.7.5 Business performance

      • 8.7.6 Key strategic moves and developments

    • 8.8 HollyFrontier Sinclair Corporation

      • 8.8.1 Company overview

      • 8.8.2 Company snapshot

      • 8.8.3 Operating business segments

      • 8.8.4 Product portfolio

      • 8.8.5 Business performance

      • 8.8.6 Key strategic moves and developments

    • 8.9 Honeywell International Inc.

      • 8.9.1 Company overview

      • 8.9.2 Company snapshot

      • 8.9.3 Operating business segments

      • 8.9.4 Product portfolio

      • 8.9.5 Business performance

      • 8.9.6 Key strategic moves and developments

    • 8.10 The International Group Inc.

      • 8.10.1 Company overview

      • 8.10.2 Company snapshot

      • 8.10.3 Operating business segments

      • 8.10.4 Product portfolio

      • 8.10.5 Business performance

      • 8.10.6 Key strategic moves and developments

  • LIST OF TABLES

  • TABLE 01. GLOBAL WAX MARKET, BY TYPE, 2020–2030 (KILOTONS)
    TABLE 02. GLOBAL WAX MARKET, BY TYPE, 2020–2030($MILLION)
    TABLE 03. PARAFFIN/MINERAL WAX MARKET, BY REGION, 2020-2030 (KILOTONS)
    TABLE 04. PARAFFIN/MINERAL WAX MARKET, BY REGION, 2020-2030 ($MILLION)
    TABLE 05. SYNTHETIC WAX MARKET, BY REGION, 2020-2030 (KILOTONS)
    TABLE 06. SYNTHETIC WAX MARKET, BY REGION, 2020-2030 ($MILLION)
    TABLE 07. NATURAL WAX MARKET, BY REGION, 2020-2030 (KILOTONS)
    TABLE 08. NATURAL WAX MARKET, BY REGION, 2020-2030 ($MILLION)
    TABLE 09. OTHER WAX MARKET, BY REGION, 2020-2030 (KILOTONS)
    TABLE 10. OTHER WAX MARKET, BY REGION, 2020-2030 ($MILLION)
    TABLE 11. GLOBAL WAX MARKET, BY APPLICATION, 2020–2030 (KILOTONS)
    TABLE 12. GLOBAL WAX MARKET, BY APPLICATION, 2020–2030 ($MILLION)
    TABLE 13. WAX MARKET, FOR CANDLES, BY REGION, 2020-2030 (KILOTONS)
    TABLE 14. WAX MARKET,FOR CANDLES, BY REGION, 2020-2030 ($MILLION)
    TABLE 15. WAX MARKET, FOR PACKAGING, BY REGION, 2020-2030 (KILOTONS)
    TABLE 16. WAX MARKET, FOR PACKAGING, BY REGION, 2020-2030 ($MILLION)
    TABLE 17. WAX MARKET, FOR EMULSIONS, BY REGION, 2020-2030 (KILOTONS)
    TABLE 18. WAX MARKET, FOR EMULSIONS, BY REGION, 2020-2030 ($MILLION)
    TABLE 19. WAX MARKET, FOR HOT MELTS, BY REGION, 2020-2030 (KILOTONS)
    TABLE 20. WAX MARKET, FOR HOT MELTS, BY REGION, 2020-2030 ($MILLION)
    TABLE 21. WAX MARKET, FOR FLOOR POLISHES, BY REGION, 2020-2030 (KILOTONS)
    TABLE 22. WAX MARKET, FOR FLOOR POLISHES, BY REGION, 2020-2030 ($MILLION)
    TABLE 23. WAX MARKET, FOR OTHER APPLICATION, BY REGION, 2020-2030 (KILOTONS)
    TABLE 24. WAX MARKET,FOR OTHERS, BY REGION, 2020-2030 ($MILLION)
    TABLE 25. WAX MARKET, BY REGION, 2020-2030 (KILOTONS)
    TABLE 26. WAX MARKET, BY REGION, 2020-2030 ($MILLION)
    TABLE 27. NORTH AMERICA WAX MARKET, BY TYPE, 2020-2030 (KILOTONS)
    TABLE 28. NORTH AMERICA WAX MARKET, BY TYPE, 2020-2030 ($MILLION)
    TABLE 29. NORTH AMERICA WAX MARKET, BY APPLICATION, 2020-2030 (KILOTONS)
    TABLE 30. NORTH AMERICA WAX MARKET, BY APPLICATION, 2020-2030 ($MILLION)
    TABLE 31. NORTH AMERICA WAX MARKET, BY COUNTRY, 2020-2030 (KILOTONS)
    TABLE 32. NORTH AMERICA WAX MARKET, BY COUNTRY, 2020-2030 ($MILLION)
    TABLE 33. U.S. WAX MARKET, BY TYPE, 2020-2030 (KILOTONS)
    TABLE 34. U.S. WAX MARKET, BY TYPE, 2020-2030 ($MILLION)
    TABLE 35. U.S. WAX MARKET, BY APPLICATION, 2020-2030 (KILOTONS)
    TABLE 36. U.S. WAX MARKET, BY APPLICATION, 2020-2030 ($MILLION)
    TABLE 37. CANADA WAX MARKET, BY TYPE, 2020-2030 (KILOTONS)
    TABLE 38. CANADA WAX MARKET, BY TYPE, 2020-2030 ($MILLION)
    TABLE 39. CANADA WAX MARKET, BY APPLICATION, 2020-2030 (KILOTONS)
    TABLE 40. CANADA WAX MARKET, BY APPLICATION, 2020-2030 ($MILLION)
    TABLE 41. MEXICO WAX MARKET, BY TYPE, 2020-2030 (KILOTONS)
    TABLE 42. MEXICO WAX MARKET, BY TYPE, 2020-2030 ($MILLION)
    TABLE 43. MEXICO WAX MARKET, BY APPLICATION, 2020-2030 (KILOTONS)
    TABLE 44. MEXICO WAX MARKET, BY APPLICATION, 2020-2030 ($MILLION)
    TABLE 45. EUROPE WAX MARKET, BY TYPE, 2020-2030 (KILOTONS)
    TABLE 46. EUROPE WAX MARKET, BY TYPE, 2020-2030 ($MILLION)
    TABLE 47. EUROPE WAX MARKET, BY APPLICATION, 2020-2030 (KILOTONS)
    TABLE 48. EUROPE WAX MARKET, BY APPLICATION, 2020-2030 ($MILLION)
    TABLE 49. EUROPE WAX MARKET, BY COUNTRY, 2020-2030 (KILOTONS)
    TABLE 50. EUROPE WAX MARKET, BY COUNTRY, 2020-2030 ($MILLION)
    TABLE 51. GERMANY WAX MARKET, BY TYPE, 2020-2030 (KILOTONS)
    TABLE 52. GERMANY WAX MARKET, BY TYPE, 2020-2030 ($MILLION)
    TABLE 53. GERMANY WAX MARKET, BY APPLICATION, 2020-2030 (KILOTONS)
    TABLE 54. GERMANY WAX MARKET, BY APPLICATION, 2020-2030 ($MILLION)
    TABLE 55. UK WAX MARKET, BY TYPE, 2020-2030 (KILOTONS)
    TABLE 56. UK WAX MARKET, BY TYPE, 2020-2030 ($MILLION)
    TABLE 57. UK WAX MARKET, BY APPLICATION, 2020-2030 (KILOTONS)
    TABLE 58. UK WAX MARKET, BY APPLICATION, 2020-2030 ($MILLION)
    TABLE 59. FRANCE WAX MARKET, BY TYPE, 2020-2030 (KILOTONS)
    TABLE 60. FRANCE WAX MARKET, BY TYPE, 2020-2030 ($MILLION)
    TABLE 61. FRANCE WAX MARKET, BY APPLICATION, 2020-2030 (KILOTONS
    TABLE 62. FRANCE WAX MARKET, BY APPLICATION, 2020-2030 ($MILLION)
    TABLE 63. ITALY WAX MARKET, BY TYPE, 2020-2030 (KILOTONS)
    TABLE 64. ITALY WAX MARKET, BY TYPE, 2020-2030 ($MILLION)
    TABLE 65. ITALY WAX MARKET, BY APPLICATION, 2020-2030 (KILOTONS)
    TABLE 66. ITALY WAX MARKET, BY APPLICATION, 2020-2030 ($MILLION)
    TABLE 67. SPAIN WAX MARKET, BY TYPE, 2020-2030 (KILOTONS)
    TABLE 68. SPAIN WAX MARKET, BY TYPE ($MILLION)
    TABLE 69. SPAIN WAX MARKET, BY APPLICATION, 2020-2030 (KILOTONS)
    TABLE 70. SPAIN WAX MARKET, BY APPLICATION, 2020-2030 ($MILLION)
    TABLE 71. REST OF EUROPE WAX MARKET, BY TYPE, 2020-2030 (KILOTONS)
    TABLE 72. REST OF EUROPE WAX MARKET, BY TYPE, 2020-2030 ($MILLION)
    TABLE 73. REST OF EUROPE WAX MARKET, BY APPLICATION, 2020-2030 (KILOTONS)
    TABLE 74. REST OF EUROPE WAX MARKET, BY APPLICATION, 2020-2030 ($MILLION)
    TABLE 75. ASIA-PACIFIC WAX MARKET, BY TYPE, 2020-2030 (KILOTONS)
    TABLE 76. ASIA-PACIFIC WAX MARKET, BY TYPE, 2020-2030 ($MILLION)
    TABLE 77. ASIA-PACIFIC WAX MARKET, BY APPLICATION, 2020-2030 (KILOTONS)
    TABLE 78. ASIA-PACIFIC WAX MARKET, BY APPLICATION, 2020-2030 ($MILLION)
    TABLE 79. ASIA-PACIFIC WAX MARKET, BY COUNTRY, 2020-2030 (KILOTONS)
    TABLE 80. ASIA-PACIFIC WAX MARKET, BY COUNTRY, 2020-2030 ($MILLION)
    TABLE 81. CHINA WAX MARKET, BY TYPE, 2020-2030 (KILOTONS)
    TABLE 82. CHINA WAX MARKET, BY TYPE, 2020-2030 ($MILLION)
    TABLE 83. CHINA WAX MARKET, BY APPLICATION, 2020-2030 (KILOTONS)
    TABLE 84. CHINA WAX MARKET, BY APPLICATION, 2020-2030 ($MILLION)
    TABLE 85. JAPAN WAX MARKET, BY TYPE, 2020-2030 (KILOTONS)
    TABLE 86. JAPAN WAX MARKET, BY TYPE, 2020-2030 ($MILLION)
    TABLE 87. JAPAN WAX MARKET, BY APPLICATION, 2020-2030 (KILOTONS)
    TABLE 88. JAPAN WAX MARKET, BY APPLICATION, 2020-2030 ($MILLION)
    TABLE 89. INDIA WAX MARKET, BY TYPE, 2020-2030 (KILOTONS)
    TABLE 90. INDIA WAX MARKET, BY TYPE, 2020-2030 ($MILLION)
    TABLE 91. INDIA WAX MARKET, BY APPLICATION, 2020-2030 (KILOTONS)
    TABLE 92. INDIA WAX MARKET, BY APPLICATION, 2020-2030 ($MILLION)
    TABLE 93. SOUTH KOREA WAX MARKET, BY TYPE, 2020-2030 (KILOTONS)
    TABLE 94. SOUTH KOREA WAX MARKET, BY TYPE, 2020-2030 ($MILLION)
    TABLE 95. SOUTH KOREA WAX MARKET, BY APPLICATION, 2020-2030 (KILOTONS)
    TABLE 96. SOUTH KOREA WAX MARKET, BY APPLICATION, 2020-2030 ($MILLION)
    TABLE 97. AUSTRALIA WAX MARKET, BY TYPE, 2020-2030 (KILOTONS)
    TABLE 98. AUSTRALIA WAX MARKET, BY TYPE, 2020-2030 ($MILLION)
    TABLE 99. AUSTRALIA WAX MARKET, BY APPLICATION, 2020-2030 (KILOTONS)
    TABLE 100. AUSTRALIA WAX MARKET, BY APPLICATION, 2020-2030 ($MILLION)
    TABLE 101. REST OF ASIA-PACIFIC WAX MARKET, BY TYPE, 2020-2030 (KILOTONS)
    TABLE 102. REST OF ASIA-PACIFIC WAX MARKET, BY TYPE, 2020-2030 ($MILLION)
    TABLE 103. REST OF ASIA-PACIFIC WAX MARKET, BY APPLICATION, 2020-2030 (KILOTONS)
    TABLE 104. REST OF ASIA-PACIFIC WAX MARKET, BY APPLICATION, 2020-2030 ($MILLION)
    TABLE 105. LAMEA WAX MARKET, BY TYPE, 2020-2030 (KILOTONS)
    TABLE 106. LAMEA WAX MARKET, BY TYPE, 2020-2030 ($MILLION)
    TABLE 107. LAMEA WAX MARKET, BY APPLICATION, 2020-2030 (KILOTONS)
    TABLE 108. LAMEA WAX MARKET, BY APPLICATION, 2020-2030 ($MILLION)
    TABLE 109. LAMEA WAX MARKET, BY COUNTRY, 2020-2030 (KILOTONS)
    TABLE 110. LAMEA WAX MARKET, BY COUNTRY, 2020-2030 ($MILLION)
    TABLE 111. BRAZIL WAX MARKET, BY TYPE, 2020-2030 (KILOTONS)
    TABLE 112. BRAZIL WAX MARKET, BY TYPE, 2020-2030 ($MILLION)
    TABLE 113. BRAZIL WAX MARKET, BY APPLICATION, 2020-2030 (KILOTONS)
    TABLE 114. BRAZIL WAX MARKET, BY APPLICATION, 2020-2030 ($MILLION)
    TABLE 115. SAUDI ARABIA WAX MARKET, BY TYPE, 2020-2030 (KILOTONS)
    TABLE 116. SAUDI ARABIA WAX MARKET, BY TYPE, 2020-2030 ($MILLION)
    TABLE 117. SAUDI ARABIA WAX MARKET, BY APPLICATION, 2020-2030 (KILOTONS)
    TABLE 118. SAUDI ARABIA WAX MARKET, BY APPLICATION, 2020-2030 ($MILLION)
    TABLE 119. SOUTH AFRICA WAX MARKET, BY TYPE, 2020-2030 (KILOTONS)
    TABLE 120. SOUTH AFRICA WAX MARKET, BY TYPE, 2020-2030 ($MILLION)
    TABLE 121. SOUTH AFRICA WAX MARKET, BY APPLICATION, 2020-2030 (KILOTONS)
    TABLE 122. SOUTH AFRICA WAX MARKET, BY APPLICATION, 2020-2030 ($MILLION)
    TABLE 123. REST OF LAMEA WAX MARKET, BY TYPE, 2020-2030 (KILOTONS)
    TABLE 124. REST OF LAMEA WAX MARKET, BY TYPE, 2020-2030 ($MILLION)
    TABLE 125. REST OF LAMEA WAX MARKET, BY APPLICATION, 2020-2030 (KILOTONS)
    TABLE 126. REST OF LAMEA WAX MARKET, BY APPLICATION, 2020-2030 ($MILLION)
    TABLE 127. KEY NEW PRODUCT LAUNCHES (2019-2022)
    TABLE 128. KEY ACQUISITION (2019-2022)
    TABLE 129. KEY JOINT VENTURE (2019-2022)
    TABLE 130. AKZO NOBEL: COMPANY SNAPSHOT
    TABLE 131. AKZO NOBEL: OPERATING SEGMENT
    TABLE 132. AKZO NOBEL PRODUCT PORTFOLIO
    TABLE 133. AKZO NOBEL: NET SALES, 2018–2020 ($MILLION)
    TABLE 134. BAKER HUGHES: COMPANY SNAPSHOT
    TABLE 135. BAKER HUGHES: OPERATING SEGMENT
    TABLE 136. BAKER HUGHES: PRODUCT PORTFOLIO
    TABLE 137. BAKER HUGHES: NET SALES, 2019–2021 ($MILLION)
    TABLE 138. BAKER HUGHES.: KEY STRATEGIC MOVES AND DEVELOPMENTS
    TABLE 139. BASF SE: COMPANY SNAPSHOT
    TABLE 140. BASF SE: OPERATING SEGMENTS
    TABLE 141. BASF SE: PRODUCT PORTFOLIO
    TABLE 142. BASF SE: NET SALES (2018-2020) ($MILLION)
    TABLE 143. BASF SE: KEY STRATEGIC MOVES AND DEVELOPMENTS
    TABLE 144. CEPSA: COMPANY SNAPSHOT
    TABLE 145. CEPSA: OPERATING SEGMENTS
    TABLE 146. CEPSA: PRODUCT PORTFOLIO
    TABLE 147. CEPSA: NET SALES (2018-2020) ($MILLION)
    TABLE 148. CNPC: COMPANY SNAPSHOT
    TABLE 149. CNPC: PRODUCT PORTFOLIO
    TABLE 150. CNPC: NET SALES (2018-2020) ($MILLION)
    TABLE 151. EVONIK: COMPANY SNAPSHOT
    TABLE 152. EVONIK: OPERATING SEGMENTS
    TABLE 153. EVONIK: PRODUCT PORTFOLIO
    TABLE 154. EVONIK: NET SALES, 2018–2020 ($MILLION)
    TABLE 155. EXXON MOBIL: COMPANY SNAPSHOT
    TABLE 156. EXXON MOBIL: OPERATING SEGMENTS
    TABLE 157. EXXON MOBIL: PRODUCT PORTFOLIO
    TABLE 158. EXXON MOBIL: NET SALES (2018-2020) ($MILLION)
    TABLE 159. HF SINCLAIR: COMPANY SNAPSHOT
    TABLE 160. HF SINCLAIR: OPERATING SEGMENT
    TABLE 161. HF SINCLAIR: PRODUCT PORTFOLIO
    TABLE 162. HF SINCLAIR: NET SALES, 2018–2020 ($MILLION)
    TABLE 163. HF SINCLAIR.: KEY STRATEGIC MOVES AND DEVELOPMENTS
    TABLE 164. HONEYWELL: COMPANY SNAPSHOT
    TABLE 165. HONEYWELL: OPERATING SEGMENTS
    TABLE 166. HONEYWELL: PRODUCT PORTFOLIO
    TABLE 167. HONEYWELL: NET SALES, 2018-2020 ($MILLION)
    TABLE 168. THE INTERNATIONAL GROUP: COMPANY SNAPSHOT
    TABLE 169. THE INTERNATIONAL GROUP: PRODUCT PORTFOLIO
  • LIST OF FIGURES

  • FIGURE 1.WAX MARKET SEGMENTATION
    FIGURE 2.WAX MARKET,2020-2030
    FIGURE 3.WAX MARKET,2020-2030
    FIGURE 4. TOP INVESTMENT POCKETS, BY REGION
    FIGURE 5.PORTER FIVE-1
    FIGURE 6.PORTER FIVE-2
    FIGURE 7.PORTER FIVE-3
    FIGURE 8.PORTER FIVE-4
    FIGURE 9.PORTER FIVE-5
    FIGURE 10.TOP PLAYER POSITIONING
    FIGURE 11.WAX MARKET:DRIVERS, RESTRAINTS AND OPPORTUNITIES
    FIGURE 12.PRICING ANALYSIS
    FIGURE 13.REGULATORY GUIDELINES
    FIGURE 14.PATENT ANALYSIS BY COMPANY
    FIGURE 15.PATENT ANALYSIS BY COUNTRY
    FIGURE 16.WAX MARKET,BY APPLICATION,2020(%)
    FIGURE 17.COMPARATIVE SHARE ANALYSIS OF CANDLES WAX MARKET,2020-2030(%)
    FIGURE 18.COMPARATIVE SHARE ANALYSIS OF PACKAGING WAX MARKET,2020-2030(%)
    FIGURE 19.COMPARATIVE SHARE ANALYSIS OF EMULSIONS WAX MARKET,2020-2030(%)
    FIGURE 20.COMPARATIVE SHARE ANALYSIS OF HOT MELTS WAX MARKET,2020-2030(%)
    FIGURE 21.COMPARATIVE SHARE ANALYSIS OF FLOOR POLISHES WAX MARKET,2020-2030(%)
    FIGURE 22.COMPARATIVE SHARE ANALYSIS OF OTHERS WAX MARKET,2020-2030(%)
    FIGURE 23.WAX MARKET,BY TYPE,2020(%)
    FIGURE 24.COMPARATIVE SHARE ANALYSIS OF PARAFFIN/MINERAL WAX WAX MARKET,2020-2030(%)
    FIGURE 25.COMPARATIVE SHARE ANALYSIS OF SYNTHETIC WAX WAX MARKET,2020-2030(%)
    FIGURE 26.COMPARATIVE SHARE ANALYSIS OF NATURAL WAX WAX MARKET,2020-2030(%)
    FIGURE 27.COMPARATIVE SHARE ANALYSIS OF OTHERS WAX MARKET,2020-2030(%)
    FIGURE 28.WAX MARKET BY REGION,2020
    FIGURE 29.U.S. WAX MARKET,2020-2030($MILLION)
    FIGURE 30.CANADA WAX MARKET,2020-2030($MILLION)
    FIGURE 31.MEXICO WAX MARKET,2020-2030($MILLION)
    FIGURE 32.GERMANY WAX MARKET,2020-2030($MILLION)
    FIGURE 33.FRANCE WAX MARKET,2020-2030($MILLION)
    FIGURE 34.ITALY WAX MARKET,2020-2030($MILLION)
    FIGURE 35.SPAIN WAX MARKET,2020-2030($MILLION)
    FIGURE 36.U.K. WAX MARKET,2020-2030($MILLION)
    FIGURE 37.REST OF EUROPE WAX MARKET,2020-2030($MILLION)
    FIGURE 38.CHINA WAX MARKET,2020-2030($MILLION)
    FIGURE 39.INDIA WAX MARKET,2020-2030($MILLION)
    FIGURE 40.JAPAN WAX MARKET,2020-2030($MILLION)
    FIGURE 41.SOUTH KOREA WAX MARKET,2020-2030($MILLION)
    FIGURE 42.AUSTRALIA WAX MARKET,2020-2030($MILLION)
    FIGURE 43.REST OF ASIA-PACIFIC WAX MARKET,2020-2030($MILLION)
    FIGURE 44.BRAZIL WAX MARKET,2020-2030($MILLION)
    FIGURE 45.SOUTH AFRICA WAX MARKET,2020-2030($MILLION)
    FIGURE 46.SAUDI ARABIA WAX MARKET,2020-2030($MILLION)
    FIGURE 47.REST OF LAMEA WAX MARKET,2020-2030($MILLION)
    FIGURE 48. TOP WINNING STRATEGIES, BY YEAR
    FIGURE 49. TOP WINNING STRATEGIES, BY DEVELOPMENT
    FIGURE 50. TOP WINNING STRATEGIES, BY COMPANY
    FIGURE 51.PRODUCT MAPPING OF TOP 10 PLAYERS
    FIGURE 52.COMPETITIVE DASHBOARD
    FIGURE 53.COMPETITIVE HEATMAP OF TOP 10 KEY PLAYERS
    FIGURE 54.AKZO NOBEL N.V..: NET SALES ,($MILLION)
    FIGURE 55.BAKER HUGHES COMPANY.: NET SALES ,($MILLION)
    FIGURE 56.BASF SE.: NET SALES ,($MILLION)
    FIGURE 57.CEPSA.: NET SALES ,($MILLION)
    FIGURE 58.CHINA NATIONAL PETROLEUM CORPORATION.: NET SALES ,($MILLION)
    FIGURE 59.EVONIK INDUSTRIES AG.: NET SALES ,($MILLION)
    FIGURE 60.EXXON MOBIL CORPORATION.: NET SALES ,($MILLION)
    FIGURE 61.HOLLYFRONTIER SINCLAIR CORPORATION.: NET SALES ,($MILLION)
    FIGURE 62.HONEYWELL INTERNATIONAL INC..: NET SALES ,($MILLION)
    FIGURE 63.THE INTERNATIONAL GROUP INC..: NET SALES ,($MILLION)


Wax is hydrocarbon lipid that melts at temperatures above 40°C, resulting in a viscous liquid. Wax is mostly utilized in manufacturing industry, particularly for coatings. In addition, wax is widely utilized as a basic material for processing and as an additive. Wax is widely used in the manufacturing of metal items as a corrosion inhibitor. As the popularity of candles grows, so does the use of wax by companies that make a range of candles in various sizes, colors, and shapes. The increase in use of wax in many industries, including medicines, textiles, paints, coatings, and  packaging is due to its particular qualities such as malleability, hydrophobicity, and solubility in organic nonpolar solvents.

PURCHASE OPTIONS

Call or Email us

U.S.-Canada Toll-free: +1-800-792-5285
Int'l : +1-503-894-6022
Europe : +44-845-528-1300
Email : help@alliedmarketresearch.com
 
FREQUENTLY ASKED QUESTIONS?

A. The major factor driving the market studied is the increasing demand from the candle and packaging industries?. Growing personal care industry in the Asia-Pacific region? is the other factor driving the market studied.

A. The market players are adopting various growth strategies and also investing in R&D extensively to develop technically advanced unique products which are expected to drive the market size.

A. Asia-Pacific region will provide more business opportunities for wax market in coming years

A. Akzo Nobel N.V, Baker Hughes Company, BASF SE, Cepsa, China National Petroleum Corporation, Evonik Industries AG, Exxon Mobil Corporation, HollyFrontier Sinclair Corporation, Honeywell International Inc. are the top players in wax market.

A. By type segment holds the maximum share of the wax market

A. Candles, packaging, emulsions, hot melts, floor polishes, plastics & rubber, and pharmaceuticals application are the potential customers of wax industry

A. Increase in usage of waxes in the packaging industry significantly drives the growth of global wax market, as paraffin waxes used for packaging offer resistance towards heat. Moreover, rise in use of wax as a base ingredient in cosmetic products boosts the market growth.

A. The demand for the product is anticipated to be driven by the growing demand in various industries because of its superior properties such as high gloss, good water repellency, and outstanding chemical resistance. The market is highly competitive in nature owing to the major involvement of multinationals in constant capacity expansion and product diversification and innovation.

Looking for Customization?

 Customization Request

Have a Question?

 Speak with Analyst

Any Confusion?

 Inquire Before Buying

Have a glance of the Report

  Request Sample
RELATED TAGS

Purchase Full Report of
Wax Market

Start reading instantly.
This Report and over 66,782+ more Reports, Available with Avenue Library. T&C*.

  • Online Only
  • $3,456
  • Online cloud access only
  • Restricted print, copy, paste & download
  • Read only
  • Free industry update
    (Within 180 days)
  • Free report update in next update cycle
    (Apr 2023 - Apr 2024)
  • Data Pack
  • $3,840
  • Restricted to one authorized user
  • One print only
  • Available in
    Excel
  • Free industry update
    (Within 180 days)
  •   Free report update in next update cycle
    (Apr 2023 - Apr 2024)
  • Single User
  • $5,769
  • Restricted to one authorized user
  • One print only
  • Available in
    PDF
  • Free industry update
    (Within 180 days)
  •   Free report update in next update cycle
    (Apr 2023 - Apr 2024)
  • Five Users
  • $6,450
  • Limited to five authorized users
  • Print upto five copies
  • Available in
    PDF
  • Free industry update
    (Within 180 days)
  •   Free report update in next update cycle
    (Apr 2023 - Apr 2024)
  • Enterprise
    License/PDF

  • $10,995
  • Unlimited
    within
    company/enterprise
  • Available in Excel & PDF
  • Free industry update
    (Within 180 days)
  •   Free report update in next update cycle
    (Apr 2023 - Apr 2024)
  • Library
    Membership

  • $999 $ 1,175
    Per User/ Per month/ Billed annually
  • Published Content
    E-access
  • Company Profiles
    E-access
  • Newly Added Content Access
  • 10 PDF
    Downloads
  • 5 Excel Data
    Pack Downloads
  • 250 Company Profiles PDF Downloads
  • Buy Now

*Taxes/Fees, if applicable will be added during checkout. All prices in USD

RELATED REPORTS
 

Why Allied Market Research?


Infallible Methodology

To ensure high-level data integrity, accurate analysis, and impeccable forecasts

Analyst Support

For complete satisfaction

Customization

On-demand customization of scope of the report to exactly meet your needs

TARGETED MARKET VIEW

Targeted market view to provide pertinent information and save time of readers

Get fresh content delivered

Get insights on topics that are crucial for your business. Stay abreast of your interest areas.

Get Industry Data Alerts

Why Allied Market Research?

Infallible Methodology

To ensure high-level data integrity, accurate analysis, and impeccable forecasts

Analyst Support

For complete satisfaction

Customization

On-demand customization of scope of the report to exactly meet your needs

TARGETED MARKET VIEW

Targeted market view to provide pertinent information and save time of readers