0
2022
Web Application Firewall Market

Web Application Firewall Market

by Component (Solution, Services), by Deployment Model (On-Premise, Cloud), by Organization Size (Large Enterprises, Small and Medium Enterprises), by End User (BFSI, Healthcare, IT and Telecom, Manufacturing, Government and Public Sector, Retail and E-Commerce, Others): Global Opportunity Analysis and Industry Forecast, 2020-2030

✷  Report Code: A02426
Mar 2022 | Pages: 210
Tables: 170
Charts: 74
  • Formats*:

  • pdf

    Single User License, Five User
    License & Enterprise User License

  • xls

    Data Pack Excel License

  • ppt

    It comes with the additional cost
    of $2500.00 contact sales.


Web Application Firewall Market Research, 2030

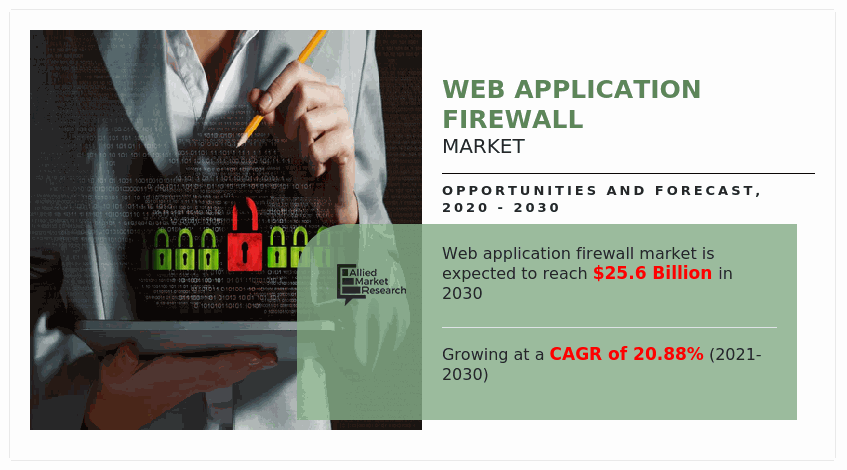
The global web application firewall market size was valued at $3.9 billion in 2020, and is projected to reach $25.6 billion by 2030, growing at a CAGR of 20.88% from 2021 to 2030.

Over the last two years, the COVID-19 outbreak has fueled the demand for web application firewall solutions due to unprecedented circumstances and cyber security requirements. For instance, a number of companies are shifting their security efforts toward endpoint security for the work from home systems. In addition, the security teams within the enterprises have no resources to address various web application security issues; thus, boosting the demand for effective web application firewall solutions.

Web application firewall (WAF) is designed to enhance security level for HTTP conversations or web conversations. It generally follows a set of rules to identify and block threats that may harm a system. It is also used to control and monitor network traffic on web-enabled applications. This firewall establishes a relatively secure barrier between a system and external environment. It provides web protection at the application layer of open system interconnection model from many attack types, such as XSS, SQL injection, cross-site scripting, DT, and RFI. Major growth drivers of the market include increased market for cloud-based solutions and stringent industry standards and regulations.

Key driving factors of the WAF market include growth is demand for cloud-based solutions, increase in number of cyber-attack activities, stringent industry standards & regulatory compliance, increase in application areas, and dearth of trained professionals. These factors have significantly contributed toward web application firewall market growth, and are anticipated to impact the market growth during forecast period.
Segment Review

The web application firewall market is segmented on the basis of component, deployment model, organisation size, end user, and region. Depending on component, the market is divided into solution and services. On the basis of deployment model, the market is segmented into on-premise and cloud. On the basis of organisation size, it is divided into large enterprises and small and medium enterprises. On the basis of end users, it is divided into BFSI, healthcare, IT & telecom, manufacturing, government, retail & E-commerce, and others. On the basis of region, the WAF market is analyzed across North America, Europe, Asia-Pacific, and LAMEA.
Web Application Firewall Market

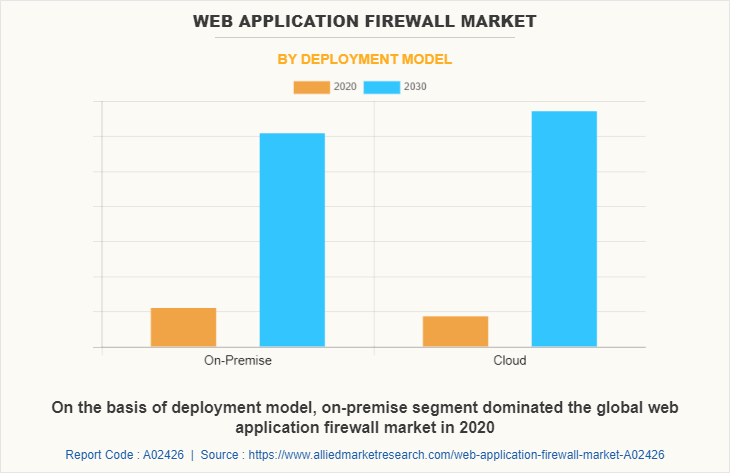
In 2020, on the basis of deployment model, the on-premise segment dominated the web application firewall market size, and is expected to maintain its dominance in the upcoming years. The impact of increased threat from advanced cyber-attack such as ransomware have increased adoption of the on-premise web application firewall solutions among large enterprises. On-premises deployment mode is most prevalent with large enterprises as it involves significant investments to implement and organizations need to purchase interconnected hardware, servers, and software to manage the system. This model is appropriate for specific applications such as financial and health records with critical data that entail large data transfers and operations. However, the cloud segment is prohected to witness higest growth rate during the forecast period as the origination of cloud computing has reduced cost constraints for most enterprises, which makes the latter most preferred choice of deployment.  
Web Application Firewall Market

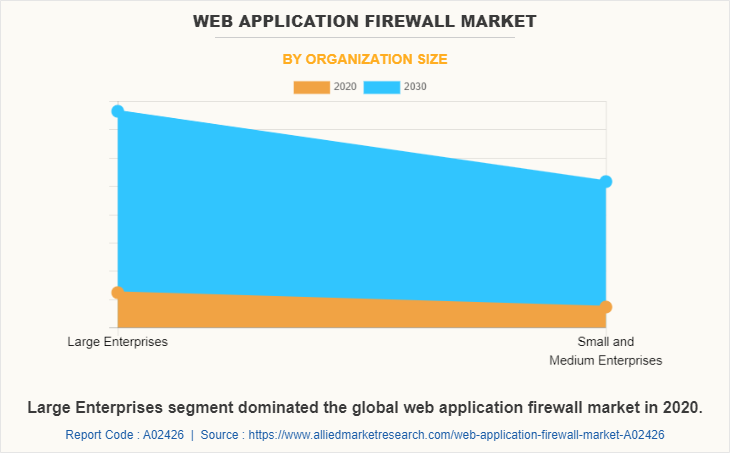
On the basis of organization size, the large enterprises segment has dominated the global market, and is projected to keep its hold on the web application firewall market size in the next years. Moreover, incorporation of overall security for IT assets requires network as well as WAF security. The need to safeguard data and rise in awareness regarding security events boost growth of the market across large enterprises. Key factors such as ease of deployment, presence of sandboxing technologies, and advanced detection capabilities increase the adoption of WAF firewall among large enterprises. Further, advantages of WAF firewall over next generation network firewall (NGFW) and intrusion prevention systems (IPS) to offer advanced protection capabilities for internal business-critical applications, internet facing websites, and web services is expected to drive the market growth during the forecast period.
Web Application Firewall Market

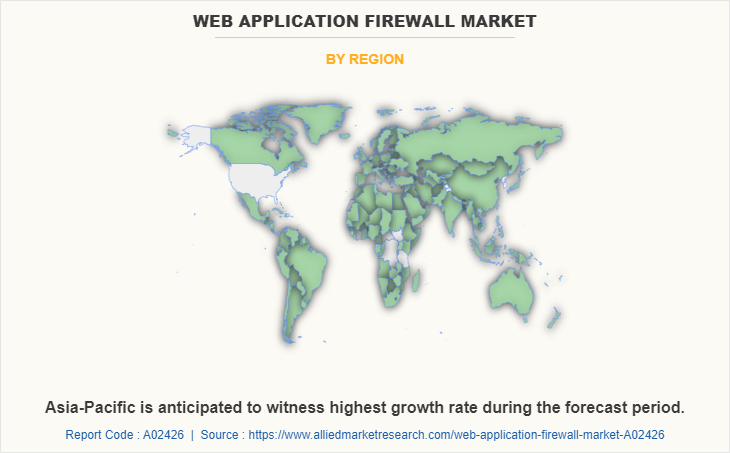
North America is the leader in the global web application firewall market share, in terms of technological advancements and adoption. It possesses well-equipped infrastructure and the ability to afford web application firewall solutions. Furthermore, rise in investments in the defense sector, along with technological advancements in the telecommunication industry, is expected to drive the market growth during the forecast period. Government regulations regarding the data security drive the web application firewall (WAF) market. Services such as security information and cloud application are expected to drive the market. In addition, presence of industry leaders such as Imperva, F5, Akamai, Citrix, barracuda, Fortinet, and diversified product offering further fuel the market in this region. Furthermore, growth associated with artificial intelligence and web application adoption is expected to create lucrative opportunities for the market players. In addition, introduction of new industry players further supports the market growth during the forecast period. However, Asia-Pacific is expected to be the fastest growing regional segment during the forecast period, with the highest CAGR.


COVID-19 impact analysis

The current estimation of 2030 is projected to be higher than pre-COVID-19 estimates. Over the last two years, the COVID-19 outbreak has fueled the demand for web application firewall solutions due to unprecedented circumstances. For instance, a lot of companies are shifting their security efforts toward endpoint security for the work from home systems. In addition, the security teams within the enterprises have no resources to address various web application security issues; thus, boosting the demand for effective web application firewall solutions.

In addition, the data center services, cloud computing, and other online support sectors, on the other hand, benefited greatly from market changes. The market for web application firewall solutions is expected to witness a major increase in end-user spending in the future.


Top impacting factors   

Increase in market for cloud-based solutions

Rise in adoption of cloud-based technology along with usage of social media platforms drives web application firewall market growth. Presently, cloud technology is adopted widely amongst all businesses, which provide enterprises with affordable security solutions. Cloud computing allows the model to function from anywhere and anytime. In addition, implementation of cloud enables organizations to combine supplementary infrastructure technologies such as software-defined perimeters to create robust and highly secure platforms. Hence, rise in adoption of cloud-based solutions drives growth of the web application firewall market share.


Stringent industry standards and regulations  

Cyber security standards and regulations are commonly applicable to all organizations, regardless of organization size and industry. As cyber-attacks have become progressively dominant, regulatory expectations for robust and comprehensive security management is essential for all organizations. For instance, financial organizations in the U.S. need to follow Gramm–Leach-Biley Act, the Bank Secrecy Act, and the Sarbanes-Oxley Act. In addition, banks and other institutions are regularly scrutinized for adherence to rules. This factor is expected to drive the market growth during web application firewall market forecast period.

Key Benefits For Stakeholders

  • This report provides a quantitative analysis of the market segments, current trends, estimations, and dynamics of the web application firewall market analysis from 2020 to 2030 to identify the prevailing web application firewall market opportunities.
  • The market research is offered along with information related to key drivers, restraints, and opportunities.
  • Porter's five forces analysis highlights the potency of buyers and suppliers to enable stakeholders make profit-oriented business decisions and strengthen their supplier-buyer network.
  • In-depth analysis of the web application firewall market segmentation assists to determine the prevailing market opportunities.
  • Major countries in each region are mapped according to their revenue contribution to the global market.
  • Market player positioning facilitates benchmarking and provides a clear understanding of the present position of the market players.
  • The report includes the analysis of the regional as well as global web application firewall market trends, key players, market segments, application areas, and market growth strategies.

Web Application Firewall Market Report Highlights

Aspects Details
By Deployment Model
  • On-Premise
  • Cloud
By Component
  • Solution
  • Services
By Organization Size
  • Large Enterprises
  • Small and Medium Enterprises
By End User
  • BFSI
  • Healthcare
  • IT and Telecom
  • Manufacturing
  • Government and Public Sector
  • Retail and E-Commerce
  • Others
By Region
  • North America  (U.S., Canada)
  • Europe  (U.K., Germany, France, Russia, Poland, Rest of Europe)
  • Asia-Pacific  (China, India, Japan, South Korea, Australia, Rest of Asia-Pacific)
  • LAMEA  (Latin America, Middle East, Africa)
Key Market Players Citrix Systems, Inc., Applicure Technologies Ltd., Akamai Technologies, Inc., Qualys, Inc., Cloudflare, Inc., F5 Networks, Inc., Fortinet, Inc., Radware Ltd., Barracuda Networks, Inc., Imperva, Inc.
 
  • CHAPTER 1:INTRODUCTION

    • 1.1.Report description

    • 1.2.Key market segments

    • 1.3.Key benefits to the stakeholders

    • 1.4.Research Methodology

      • 1.4.1.Secondary research

      • 1.4.2.Primary research

      • 1.4.3.Analyst tools and models

  • CHAPTER 2:EXECUTIVE SUMMARY

    • 2.1.Key findings of the study

    • 2.2.CXO Perspective

  • CHAPTER 3:MARKET OVERVIEW

    • 3.1.Market definition and scope

    • 3.2.Key findings

      • 3.2.1.Top investment pockets

    • 3.3.Porter’s five forces analysis

    • 3.4.Top player positioning

    • 3.5.Market dynamics

      • 3.5.1.Drivers

      • 3.5.2.Restraints

      • 3.5.3.Opportunities

    • 3.6.COVID-19 Impact Analysis on the market

    • 3.7.Regulatory Guidelines

    • 3.8.Key Regulation Analysis

    • 3.9.Patent Landscape

  • CHAPTER 4: WEB APPLICATION FIREWALL MARKET, BY COMPONENT

    • 4.1 Overview

      • 4.1.1 Market size and forecast

    • 4.2 Solution

      • 4.2.1 Key market trends, growth factors and opportunities

      • 4.2.2 Market size and forecast, by region

      • 4.2.3 Market analysis by country

    • 4.3 Services

      • 4.3.1 Key market trends, growth factors and opportunities

      • 4.3.2 Market size and forecast, by region

      • 4.3.3 Market analysis by country

  • CHAPTER 5: WEB APPLICATION FIREWALL MARKET, BY DEPLOYMENT MODEL

    • 5.1 Overview

      • 5.1.1 Market size and forecast

    • 5.2 On-Premise

      • 5.2.1 Key market trends, growth factors and opportunities

      • 5.2.2 Market size and forecast, by region

      • 5.2.3 Market analysis by country

    • 5.3 Cloud

      • 5.3.1 Key market trends, growth factors and opportunities

      • 5.3.2 Market size and forecast, by region

      • 5.3.3 Market analysis by country

  • CHAPTER 6: WEB APPLICATION FIREWALL MARKET, BY ORGANIZATION SIZE

    • 6.1 Overview

      • 6.1.1 Market size and forecast

    • 6.2 Large Enterprises

      • 6.2.1 Key market trends, growth factors and opportunities

      • 6.2.2 Market size and forecast, by region

      • 6.2.3 Market analysis by country

    • 6.3 Small and Medium Enterprises

      • 6.3.1 Key market trends, growth factors and opportunities

      • 6.3.2 Market size and forecast, by region

      • 6.3.3 Market analysis by country

  • CHAPTER 7: WEB APPLICATION FIREWALL MARKET, BY END USER

    • 7.1 Overview

      • 7.1.1 Market size and forecast

    • 7.2 BFSI

      • 7.2.1 Key market trends, growth factors and opportunities

      • 7.2.2 Market size and forecast, by region

      • 7.2.3 Market analysis by country

    • 7.3 Healthcare

      • 7.3.1 Key market trends, growth factors and opportunities

      • 7.3.2 Market size and forecast, by region

      • 7.3.3 Market analysis by country

    • 7.4 IT and Telecom

      • 7.4.1 Key market trends, growth factors and opportunities

      • 7.4.2 Market size and forecast, by region

      • 7.4.3 Market analysis by country

    • 7.5 Manufacturing

      • 7.5.1 Key market trends, growth factors and opportunities

      • 7.5.2 Market size and forecast, by region

      • 7.5.3 Market analysis by country

    • 7.6 Government and Public Sector

      • 7.6.1 Key market trends, growth factors and opportunities

      • 7.6.2 Market size and forecast, by region

      • 7.6.3 Market analysis by country

    • 7.7 Retail and E-Commerce

      • 7.7.1 Key market trends, growth factors and opportunities

      • 7.7.2 Market size and forecast, by region

      • 7.7.3 Market analysis by country

    • 7.8 Others

      • 7.8.1 Key market trends, growth factors and opportunities

      • 7.8.2 Market size and forecast, by region

      • 7.8.3 Market analysis by country

  • CHAPTER 8: WEB APPLICATION FIREWALL MARKET, BY REGION

    • 8.1 Overview

      • 8.1.1 Market size and forecast

    • 8.2 North America

      • 8.2.1 Key trends and opportunities

      • 8.2.2 North America Market size and forecast, by Component

      • 8.2.3 North America Market size and forecast, by Deployment Model

      • 8.2.4 North America Market size and forecast, by Organization Size

      • 8.2.5 North America Market size and forecast, by End User

      • 8.2.6 North America Market size and forecast, by country

        • 8.2.6.1 U.S.
          • 8.2.6.1.1 Market size and forecast, by Component
          • 8.2.6.1.2 Market size and forecast, by Deployment Model
          • 8.2.6.1.3 Market size and forecast, by Organization Size
          • 8.2.6.1.4 Market size and forecast, by End User
        • 8.2.6.2 Canada
          • 8.2.6.2.1 Market size and forecast, by Component
          • 8.2.6.2.2 Market size and forecast, by Deployment Model
          • 8.2.6.2.3 Market size and forecast, by Organization Size
          • 8.2.6.2.4 Market size and forecast, by End User
    • 8.3 Europe

      • 8.3.1 Key trends and opportunities

      • 8.3.2 Europe Market size and forecast, by Component

      • 8.3.3 Europe Market size and forecast, by Deployment Model

      • 8.3.4 Europe Market size and forecast, by Organization Size

      • 8.3.5 Europe Market size and forecast, by End User

      • 8.3.6 Europe Market size and forecast, by country

        • 8.3.6.1 U.K.
          • 8.3.6.1.1 Market size and forecast, by Component
          • 8.3.6.1.2 Market size and forecast, by Deployment Model
          • 8.3.6.1.3 Market size and forecast, by Organization Size
          • 8.3.6.1.4 Market size and forecast, by End User
        • 8.3.6.2 Germany
          • 8.3.6.2.1 Market size and forecast, by Component
          • 8.3.6.2.2 Market size and forecast, by Deployment Model
          • 8.3.6.2.3 Market size and forecast, by Organization Size
          • 8.3.6.2.4 Market size and forecast, by End User
        • 8.3.6.3 France
          • 8.3.6.3.1 Market size and forecast, by Component
          • 8.3.6.3.2 Market size and forecast, by Deployment Model
          • 8.3.6.3.3 Market size and forecast, by Organization Size
          • 8.3.6.3.4 Market size and forecast, by End User
        • 8.3.6.4 Russia
          • 8.3.6.4.1 Market size and forecast, by Component
          • 8.3.6.4.2 Market size and forecast, by Deployment Model
          • 8.3.6.4.3 Market size and forecast, by Organization Size
          • 8.3.6.4.4 Market size and forecast, by End User
        • 8.3.6.5 Poland
          • 8.3.6.5.1 Market size and forecast, by Component
          • 8.3.6.5.2 Market size and forecast, by Deployment Model
          • 8.3.6.5.3 Market size and forecast, by Organization Size
          • 8.3.6.5.4 Market size and forecast, by End User
        • 8.3.6.6 Rest of Europe
          • 8.3.6.6.1 Market size and forecast, by Component
          • 8.3.6.6.2 Market size and forecast, by Deployment Model
          • 8.3.6.6.3 Market size and forecast, by Organization Size
          • 8.3.6.6.4 Market size and forecast, by End User
    • 8.4 Asia-Pacific

      • 8.4.1 Key trends and opportunities

      • 8.4.2 Asia-Pacific Market size and forecast, by Component

      • 8.4.3 Asia-Pacific Market size and forecast, by Deployment Model

      • 8.4.4 Asia-Pacific Market size and forecast, by Organization Size

      • 8.4.5 Asia-Pacific Market size and forecast, by End User

      • 8.4.6 Asia-Pacific Market size and forecast, by country

        • 8.4.6.1 China
          • 8.4.6.1.1 Market size and forecast, by Component
          • 8.4.6.1.2 Market size and forecast, by Deployment Model
          • 8.4.6.1.3 Market size and forecast, by Organization Size
          • 8.4.6.1.4 Market size and forecast, by End User
        • 8.4.6.2 India
          • 8.4.6.2.1 Market size and forecast, by Component
          • 8.4.6.2.2 Market size and forecast, by Deployment Model
          • 8.4.6.2.3 Market size and forecast, by Organization Size
          • 8.4.6.2.4 Market size and forecast, by End User
        • 8.4.6.3 Japan
          • 8.4.6.3.1 Market size and forecast, by Component
          • 8.4.6.3.2 Market size and forecast, by Deployment Model
          • 8.4.6.3.3 Market size and forecast, by Organization Size
          • 8.4.6.3.4 Market size and forecast, by End User
        • 8.4.6.4 South Korea
          • 8.4.6.4.1 Market size and forecast, by Component
          • 8.4.6.4.2 Market size and forecast, by Deployment Model
          • 8.4.6.4.3 Market size and forecast, by Organization Size
          • 8.4.6.4.4 Market size and forecast, by End User
        • 8.4.6.5 Australia
          • 8.4.6.5.1 Market size and forecast, by Component
          • 8.4.6.5.2 Market size and forecast, by Deployment Model
          • 8.4.6.5.3 Market size and forecast, by Organization Size
          • 8.4.6.5.4 Market size and forecast, by End User
        • 8.4.6.6 Rest of Asia-Pacific
          • 8.4.6.6.1 Market size and forecast, by Component
          • 8.4.6.6.2 Market size and forecast, by Deployment Model
          • 8.4.6.6.3 Market size and forecast, by Organization Size
          • 8.4.6.6.4 Market size and forecast, by End User
    • 8.5 LAMEA

      • 8.5.1 Key trends and opportunities

      • 8.5.2 LAMEA Market size and forecast, by Component

      • 8.5.3 LAMEA Market size and forecast, by Deployment Model

      • 8.5.4 LAMEA Market size and forecast, by Organization Size

      • 8.5.5 LAMEA Market size and forecast, by End User

      • 8.5.6 LAMEA Market size and forecast, by country

        • 8.5.6.1 Latin America
          • 8.5.6.1.1 Market size and forecast, by Component
          • 8.5.6.1.2 Market size and forecast, by Deployment Model
          • 8.5.6.1.3 Market size and forecast, by Organization Size
          • 8.5.6.1.4 Market size and forecast, by End User
        • 8.5.6.2 Middle East
          • 8.5.6.2.1 Market size and forecast, by Component
          • 8.5.6.2.2 Market size and forecast, by Deployment Model
          • 8.5.6.2.3 Market size and forecast, by Organization Size
          • 8.5.6.2.4 Market size and forecast, by End User
        • 8.5.6.3 Africa
          • 8.5.6.3.1 Market size and forecast, by Component
          • 8.5.6.3.2 Market size and forecast, by Deployment Model
          • 8.5.6.3.3 Market size and forecast, by Organization Size
          • 8.5.6.3.4 Market size and forecast, by End User
  • CHAPTER 9: COMPANY LANDSCAPE

    • 9.1. Introduction

    • 9.2. Top winning strategies

    • 9.3. Product Mapping of Top 10 Player

    • 9.4. Competitive Dashboard

    • 9.5. Competitive Heatmap

    • 9.6. Key developments

  • CHAPTER 10: COMPANY PROFILES

    • 10.1 Applicure Technologies Ltd.

      • 10.1.1 Company overview

      • 10.1.2 Company snapshot

      • 10.1.3 Operating business segments

      • 10.1.4 Product portfolio

      • 10.1.5 Business performance

      • 10.1.6 Key strategic moves and developments

    • 10.2 Qualys, Inc.

      • 10.2.1 Company overview

      • 10.2.2 Company snapshot

      • 10.2.3 Operating business segments

      • 10.2.4 Product portfolio

      • 10.2.5 Business performance

      • 10.2.6 Key strategic moves and developments

    • 10.3 Akamai Technologies, Inc.

      • 10.3.1 Company overview

      • 10.3.2 Company snapshot

      • 10.3.3 Operating business segments

      • 10.3.4 Product portfolio

      • 10.3.5 Business performance

      • 10.3.6 Key strategic moves and developments

    • 10.4 Barracuda Networks, Inc.

      • 10.4.1 Company overview

      • 10.4.2 Company snapshot

      • 10.4.3 Operating business segments

      • 10.4.4 Product portfolio

      • 10.4.5 Business performance

      • 10.4.6 Key strategic moves and developments

    • 10.5 Citrix Systems, Inc.

      • 10.5.1 Company overview

      • 10.5.2 Company snapshot

      • 10.5.3 Operating business segments

      • 10.5.4 Product portfolio

      • 10.5.5 Business performance

      • 10.5.6 Key strategic moves and developments

    • 10.6 F5 Networks, Inc.

      • 10.6.1 Company overview

      • 10.6.2 Company snapshot

      • 10.6.3 Operating business segments

      • 10.6.4 Product portfolio

      • 10.6.5 Business performance

      • 10.6.6 Key strategic moves and developments

    • 10.7 Imperva, Inc.

      • 10.7.1 Company overview

      • 10.7.2 Company snapshot

      • 10.7.3 Operating business segments

      • 10.7.4 Product portfolio

      • 10.7.5 Business performance

      • 10.7.6 Key strategic moves and developments

    • 10.8 Fortinet, Inc.

      • 10.8.1 Company overview

      • 10.8.2 Company snapshot

      • 10.8.3 Operating business segments

      • 10.8.4 Product portfolio

      • 10.8.5 Business performance

      • 10.8.6 Key strategic moves and developments

    • 10.9 Cloudflare, Inc.

      • 10.9.1 Company overview

      • 10.9.2 Company snapshot

      • 10.9.3 Operating business segments

      • 10.9.4 Product portfolio

      • 10.9.5 Business performance

      • 10.9.6 Key strategic moves and developments

    • 10.10 Radware Ltd.

      • 10.10.1 Company overview

      • 10.10.2 Company snapshot

      • 10.10.3 Operating business segments

      • 10.10.4 Product portfolio

      • 10.10.5 Business performance

      • 10.10.6 Key strategic moves and developments

  • LIST OF TABLES

  • TABLE 1. GLOBAL WEB APPLICATION FIREWALL MARKET, BY COMPONENT, 2020-2030,($MILLION)
    TABLE 2. WEB APPLICATION FIREWALL MARKET REVENUE, FOR SOLUTION, BY REGION , 2020-2030,($MILLION)
    TABLE 3. WEB APPLICATION FIREWALL MARKET SOLUTION BY COUNTRY, 2020-2030,($MILLION)
    TABLE 4. WEB APPLICATION FIREWALL MARKET REVENUE, FOR SERVICES, BY REGION , 2020-2030,($MILLION)
    TABLE 5. WEB APPLICATION FIREWALL MARKET SERVICES BY COUNTRY, 2020-2030,($MILLION)
    TABLE 6. GLOBAL WEB APPLICATION FIREWALL MARKET, BY DEPLOYMENT MODEL, 2020-2030,($MILLION)
    TABLE 7. WEB APPLICATION FIREWALL MARKET REVENUE, FOR ON-PREMISE, BY REGION , 2020-2030,($MILLION)
    TABLE 8. WEB APPLICATION FIREWALL MARKET ON-PREMISE BY COUNTRY, 2020-2030,($MILLION)
    TABLE 9. WEB APPLICATION FIREWALL MARKET REVENUE, FOR CLOUD, BY REGION , 2020-2030,($MILLION)
    TABLE 10. WEB APPLICATION FIREWALL MARKET CLOUD BY COUNTRY, 2020-2030,($MILLION)
    TABLE 11. GLOBAL WEB APPLICATION FIREWALL MARKET, BY ORGANIZATION SIZE, 2020-2030,($MILLION)
    TABLE 12. WEB APPLICATION FIREWALL MARKET REVENUE, FOR LARGE ENTERPRISES, BY REGION , 2020-2030,($MILLION)
    TABLE 13. WEB APPLICATION FIREWALL MARKET LARGE ENTERPRISES BY COUNTRY, 2020-2030,($MILLION)
    TABLE 14. WEB APPLICATION FIREWALL MARKET REVENUE, FOR SMALL AND MEDIUM ENTERPRISES, BY REGION , 2020-2030,($MILLION)
    TABLE 15. WEB APPLICATION FIREWALL MARKET SMALL AND MEDIUM ENTERPRISES BY COUNTRY, 2020-2030,($MILLION)
    TABLE 16. GLOBAL WEB APPLICATION FIREWALL MARKET, BY END USER, 2020-2030,($MILLION)
    TABLE 17. WEB APPLICATION FIREWALL MARKET REVENUE, FOR BFSI, BY REGION , 2020-2030,($MILLION)
    TABLE 18. WEB APPLICATION FIREWALL MARKET BFSI BY COUNTRY, 2020-2030,($MILLION)
    TABLE 19. WEB APPLICATION FIREWALL MARKET REVENUE, FOR HEALTHCARE, BY REGION , 2020-2030,($MILLION)
    TABLE 20. WEB APPLICATION FIREWALL MARKET HEALTHCARE BY COUNTRY, 2020-2030,($MILLION)
    TABLE 21. WEB APPLICATION FIREWALL MARKET REVENUE, FOR IT AND TELECOM, BY REGION , 2020-2030,($MILLION)
    TABLE 22. WEB APPLICATION FIREWALL MARKET IT AND TELECOM BY COUNTRY, 2020-2030,($MILLION)
    TABLE 23. WEB APPLICATION FIREWALL MARKET REVENUE, FOR MANUFACTURING, BY REGION , 2020-2030,($MILLION)
    TABLE 24. WEB APPLICATION FIREWALL MARKET MANUFACTURING BY COUNTRY, 2020-2030,($MILLION)
    TABLE 25. WEB APPLICATION FIREWALL MARKET REVENUE, FOR GOVERNMENT AND PUBLIC SECTOR, BY REGION , 2020-2030,($MILLION)
    TABLE 26. WEB APPLICATION FIREWALL MARKET GOVERNMENT AND PUBLIC SECTOR BY COUNTRY, 2020-2030,($MILLION)
    TABLE 27. WEB APPLICATION FIREWALL MARKET REVENUE, FOR RETAIL AND E-COMMERCE, BY REGION , 2020-2030,($MILLION)
    TABLE 28. WEB APPLICATION FIREWALL MARKET RETAIL AND E-COMMERCE BY COUNTRY, 2020-2030,($MILLION)
    TABLE 29. WEB APPLICATION FIREWALL MARKET REVENUE, FOR OTHERS, BY REGION , 2020-2030,($MILLION)
    TABLE 30. WEB APPLICATION FIREWALL MARKET OTHERS BY COUNTRY, 2020-2030,($MILLION)
    TABLE 31. WEB APPLICATION FIREWALL MARKET, BY REGION, 2020-2030,($MILLION)
    TABLE 32. NORTH AMERICA WEB APPLICATION FIREWALL MARKET, BY COMPONENT, 2020-2030,($MILLION)
    TABLE 33. NORTH AMERICA WEB APPLICATION FIREWALL MARKET, BY DEPLOYMENT MODEL, 2020-2030,($MILLION)
    TABLE 34. NORTH AMERICA WEB APPLICATION FIREWALL MARKET, BY ORGANIZATION SIZE, 2020-2030,($MILLION)
    TABLE 35. NORTH AMERICA WEB APPLICATION FIREWALL MARKET, BY END USER, 2020-2030,($MILLION)
    TABLE 36. NORTH AMERICA WEB APPLICATION FIREWALL MARKET, BY COUNTRY, 2020-2030,($MILLION)
    TABLE 37. U.S. WEB APPLICATION FIREWALL MARKET BY COMPONENT 2020-2030,($MILLION)
    TABLE 38. U.S. WEB APPLICATION FIREWALL MARKET BY DEPLOYMENT MODEL 2020-2030,($MILLION)
    TABLE 39. U.S. WEB APPLICATION FIREWALL MARKET BY ORGANIZATION SIZE 2020-2030,($MILLION)
    TABLE 40. U.S. WEB APPLICATION FIREWALL MARKET BY END USER 2020-2030,($MILLION)
    TABLE 41. CANADA WEB APPLICATION FIREWALL MARKET BY COMPONENT 2020-2030,($MILLION)
    TABLE 42. CANADA WEB APPLICATION FIREWALL MARKET BY DEPLOYMENT MODEL 2020-2030,($MILLION)
    TABLE 43. CANADA WEB APPLICATION FIREWALL MARKET BY ORGANIZATION SIZE 2020-2030,($MILLION)
    TABLE 44. CANADA WEB APPLICATION FIREWALL MARKET BY END USER 2020-2030,($MILLION)
    TABLE 45. EUROPE WEB APPLICATION FIREWALL MARKET, BY COMPONENT, 2020-2030,($MILLION)
    TABLE 46. EUROPE WEB APPLICATION FIREWALL MARKET, BY DEPLOYMENT MODEL, 2020-2030,($MILLION)
    TABLE 47. EUROPE WEB APPLICATION FIREWALL MARKET, BY ORGANIZATION SIZE, 2020-2030,($MILLION)
    TABLE 48. EUROPE WEB APPLICATION FIREWALL MARKET, BY END USER, 2020-2030,($MILLION)
    TABLE 49. EUROPE WEB APPLICATION FIREWALL MARKET, BY COUNTRY, 2020-2030,($MILLION)
    TABLE 50. U.K. WEB APPLICATION FIREWALL MARKET BY COMPONENT 2020-2030,($MILLION)
    TABLE 51. U.K. WEB APPLICATION FIREWALL MARKET BY DEPLOYMENT MODEL 2020-2030,($MILLION)
    TABLE 52. U.K. WEB APPLICATION FIREWALL MARKET BY ORGANIZATION SIZE 2020-2030,($MILLION)
    TABLE 53. U.K. WEB APPLICATION FIREWALL MARKET BY END USER 2020-2030,($MILLION)
    TABLE 54. GERMANY WEB APPLICATION FIREWALL MARKET BY COMPONENT 2020-2030,($MILLION)
    TABLE 55. GERMANY WEB APPLICATION FIREWALL MARKET BY DEPLOYMENT MODEL 2020-2030,($MILLION)
    TABLE 56. GERMANY WEB APPLICATION FIREWALL MARKET BY ORGANIZATION SIZE 2020-2030,($MILLION)
    TABLE 57. GERMANY WEB APPLICATION FIREWALL MARKET BY END USER 2020-2030,($MILLION)
    TABLE 58. FRANCE WEB APPLICATION FIREWALL MARKET BY COMPONENT 2020-2030,($MILLION)
    TABLE 59. FRANCE WEB APPLICATION FIREWALL MARKET BY DEPLOYMENT MODEL 2020-2030,($MILLION)
    TABLE 60. FRANCE WEB APPLICATION FIREWALL MARKET BY ORGANIZATION SIZE 2020-2030,($MILLION)
    TABLE 61. FRANCE WEB APPLICATION FIREWALL MARKET BY END USER 2020-2030,($MILLION)
    TABLE 62. RUSSIA WEB APPLICATION FIREWALL MARKET BY COMPONENT 2020-2030,($MILLION)
    TABLE 63. RUSSIA WEB APPLICATION FIREWALL MARKET BY DEPLOYMENT MODEL 2020-2030,($MILLION)
    TABLE 64. RUSSIA WEB APPLICATION FIREWALL MARKET BY ORGANIZATION SIZE 2020-2030,($MILLION)
    TABLE 65. RUSSIA WEB APPLICATION FIREWALL MARKET BY END USER 2020-2030,($MILLION)
    TABLE 66. POLAND WEB APPLICATION FIREWALL MARKET BY COMPONENT 2020-2030,($MILLION)
    TABLE 67. POLAND WEB APPLICATION FIREWALL MARKET BY DEPLOYMENT MODEL 2020-2030,($MILLION)
    TABLE 68. POLAND WEB APPLICATION FIREWALL MARKET BY ORGANIZATION SIZE 2020-2030,($MILLION)
    TABLE 69. POLAND WEB APPLICATION FIREWALL MARKET BY END USER 2020-2030,($MILLION)
    TABLE 70. REST OF EUROPE WEB APPLICATION FIREWALL MARKET BY COMPONENT 2020-2030,($MILLION)
    TABLE 71. REST OF EUROPE WEB APPLICATION FIREWALL MARKET BY DEPLOYMENT MODEL 2020-2030,($MILLION)
    TABLE 72. REST OF EUROPE WEB APPLICATION FIREWALL MARKET BY ORGANIZATION SIZE 2020-2030,($MILLION)
    TABLE 73. REST OF EUROPE WEB APPLICATION FIREWALL MARKET BY END USER 2020-2030,($MILLION)
    TABLE 74. ASIA-PACIFIC WEB APPLICATION FIREWALL MARKET, BY COMPONENT, 2020-2030,($MILLION)
    TABLE 75. ASIA-PACIFIC WEB APPLICATION FIREWALL MARKET, BY DEPLOYMENT MODEL, 2020-2030,($MILLION)
    TABLE 76. ASIA-PACIFIC WEB APPLICATION FIREWALL MARKET, BY ORGANIZATION SIZE, 2020-2030,($MILLION)
    TABLE 77. ASIA-PACIFIC WEB APPLICATION FIREWALL MARKET, BY END USER, 2020-2030,($MILLION)
    TABLE 78. ASIA-PACIFIC WEB APPLICATION FIREWALL MARKET, BY COUNTRY, 2020-2030,($MILLION)
    TABLE 79. CHINA WEB APPLICATION FIREWALL MARKET BY COMPONENT 2020-2030,($MILLION)
    TABLE 80. CHINA WEB APPLICATION FIREWALL MARKET BY DEPLOYMENT MODEL 2020-2030,($MILLION)
    TABLE 81. CHINA WEB APPLICATION FIREWALL MARKET BY ORGANIZATION SIZE 2020-2030,($MILLION)
    TABLE 82. CHINA WEB APPLICATION FIREWALL MARKET BY END USER 2020-2030,($MILLION)
    TABLE 83. INDIA WEB APPLICATION FIREWALL MARKET BY COMPONENT 2020-2030,($MILLION)
    TABLE 84. INDIA WEB APPLICATION FIREWALL MARKET BY DEPLOYMENT MODEL 2020-2030,($MILLION)
    TABLE 85. INDIA WEB APPLICATION FIREWALL MARKET BY ORGANIZATION SIZE 2020-2030,($MILLION)
    TABLE 86. INDIA WEB APPLICATION FIREWALL MARKET BY END USER 2020-2030,($MILLION)
    TABLE 87. JAPAN WEB APPLICATION FIREWALL MARKET BY COMPONENT 2020-2030,($MILLION)
    TABLE 88. JAPAN WEB APPLICATION FIREWALL MARKET BY DEPLOYMENT MODEL 2020-2030,($MILLION)
    TABLE 89. JAPAN WEB APPLICATION FIREWALL MARKET BY ORGANIZATION SIZE 2020-2030,($MILLION)
    TABLE 90. JAPAN WEB APPLICATION FIREWALL MARKET BY END USER 2020-2030,($MILLION)
    TABLE 91. SOUTH KOREA WEB APPLICATION FIREWALL MARKET BY COMPONENT 2020-2030,($MILLION)
    TABLE 92. SOUTH KOREA WEB APPLICATION FIREWALL MARKET BY DEPLOYMENT MODEL 2020-2030,($MILLION)
    TABLE 93. SOUTH KOREA WEB APPLICATION FIREWALL MARKET BY ORGANIZATION SIZE 2020-2030,($MILLION)
    TABLE 94. SOUTH KOREA WEB APPLICATION FIREWALL MARKET BY END USER 2020-2030,($MILLION)
    TABLE 95. AUSTRALIA WEB APPLICATION FIREWALL MARKET BY COMPONENT 2020-2030,($MILLION)
    TABLE 96. AUSTRALIA WEB APPLICATION FIREWALL MARKET BY DEPLOYMENT MODEL 2020-2030,($MILLION)
    TABLE 97. AUSTRALIA WEB APPLICATION FIREWALL MARKET BY ORGANIZATION SIZE 2020-2030,($MILLION)
    TABLE 98. AUSTRALIA WEB APPLICATION FIREWALL MARKET BY END USER 2020-2030,($MILLION)
    TABLE 99. REST OF ASIA-PACIFIC WEB APPLICATION FIREWALL MARKET BY COMPONENT 2020-2030,($MILLION)
    TABLE 100. REST OF ASIA-PACIFIC WEB APPLICATION FIREWALL MARKET BY DEPLOYMENT MODEL 2020-2030,($MILLION)
    TABLE 101. REST OF ASIA-PACIFIC WEB APPLICATION FIREWALL MARKET BY ORGANIZATION SIZE 2020-2030,($MILLION)
    TABLE 102. REST OF ASIA-PACIFIC WEB APPLICATION FIREWALL MARKET BY END USER 2020-2030,($MILLION)
    TABLE 103. LAMEA WEB APPLICATION FIREWALL MARKET, BY COMPONENT, 2020-2030,($MILLION)
    TABLE 104. LAMEA WEB APPLICATION FIREWALL MARKET, BY DEPLOYMENT MODEL, 2020-2030,($MILLION)
    TABLE 105. LAMEA WEB APPLICATION FIREWALL MARKET, BY ORGANIZATION SIZE, 2020-2030,($MILLION)
    TABLE 106. LAMEA WEB APPLICATION FIREWALL MARKET, BY END USER, 2020-2030,($MILLION)
    TABLE 107. LAMEA WEB APPLICATION FIREWALL MARKET, BY COUNTRY, 2020-2030,($MILLION)
    TABLE 108. LATIN AMERICA WEB APPLICATION FIREWALL MARKET BY COMPONENT 2020-2030,($MILLION)
    TABLE 109. LATIN AMERICA WEB APPLICATION FIREWALL MARKET BY DEPLOYMENT MODEL 2020-2030,($MILLION)
    TABLE 110. LATIN AMERICA WEB APPLICATION FIREWALL MARKET BY ORGANIZATION SIZE 2020-2030,($MILLION)
    TABLE 111. LATIN AMERICA WEB APPLICATION FIREWALL MARKET BY END USER 2020-2030,($MILLION)
    TABLE 112. MIDDLE EAST WEB APPLICATION FIREWALL MARKET BY COMPONENT 2020-2030,($MILLION)
    TABLE 113. MIDDLE EAST WEB APPLICATION FIREWALL MARKET BY DEPLOYMENT MODEL 2020-2030,($MILLION)
    TABLE 114. MIDDLE EAST WEB APPLICATION FIREWALL MARKET BY ORGANIZATION SIZE 2020-2030,($MILLION)
    TABLE 115. MIDDLE EAST WEB APPLICATION FIREWALL MARKET BY END USER 2020-2030,($MILLION)
    TABLE 116. AFRICA WEB APPLICATION FIREWALL MARKET BY COMPONENT 2020-2030,($MILLION)
    TABLE 117. AFRICA WEB APPLICATION FIREWALL MARKET BY DEPLOYMENT MODEL 2020-2030,($MILLION)
    TABLE 118. AFRICA WEB APPLICATION FIREWALL MARKET BY ORGANIZATION SIZE 2020-2030,($MILLION)
    TABLE 119. AFRICA WEB APPLICATION FIREWALL MARKET BY END USER 2020-2030,($MILLION)
    TABLE 120. INC.: COMPANY SNAPSHOT
    TABLE 121. INC.: OPERATING SEGMENTS
    TABLE 122. INC.: PRODUCT PORTFOLIO
    TABLE 123. INC.: NET SALES,
    TABLE 124. INC.: KEY STRATERGIES
    TABLE 125.AKAMAI TECHNOLOGIES: COMPANY SNAPSHOT
    TABLE 126.AKAMAI TECHNOLOGIES: OPERATING SEGMENTS
    TABLE 127.AKAMAI TECHNOLOGIES: PRODUCT PORTFOLIO
    TABLE 128.AKAMAI TECHNOLOGIES: NET SALES,
    TABLE 129.AKAMAI TECHNOLOGIES: KEY STRATERGIES
    TABLE 130. INC.: COMPANY SNAPSHOT
    TABLE 131. INC.: OPERATING SEGMENTS
    TABLE 132. INC.: PRODUCT PORTFOLIO
    TABLE 133. INC.: NET SALES,
    TABLE 134. INC.: KEY STRATERGIES
    TABLE 135.BARRACUDA NETWORKS: COMPANY SNAPSHOT
    TABLE 136.BARRACUDA NETWORKS: OPERATING SEGMENTS
    TABLE 137.BARRACUDA NETWORKS: PRODUCT PORTFOLIO
    TABLE 138.BARRACUDA NETWORKS: NET SALES,
    TABLE 139.BARRACUDA NETWORKS: KEY STRATERGIES
    TABLE 140. INC.: COMPANY SNAPSHOT
    TABLE 141. INC.: OPERATING SEGMENTS
    TABLE 142. INC.: PRODUCT PORTFOLIO
    TABLE 143. INC.: NET SALES,
    TABLE 144. INC.: KEY STRATERGIES
    TABLE 145.CITRIX SYSTEMS: COMPANY SNAPSHOT
    TABLE 146.CITRIX SYSTEMS: OPERATING SEGMENTS
    TABLE 147.CITRIX SYSTEMS: PRODUCT PORTFOLIO
    TABLE 148.CITRIX SYSTEMS: NET SALES,
    TABLE 149.CITRIX SYSTEMS: KEY STRATERGIES
    TABLE 150. INC.: COMPANY SNAPSHOT
    TABLE 151. INC.: OPERATING SEGMENTS
    TABLE 152. INC.: PRODUCT PORTFOLIO
    TABLE 153. INC.: NET SALES,
    TABLE 154. INC.: KEY STRATERGIES
    TABLE 155.F5 NETWORKS: COMPANY SNAPSHOT
    TABLE 156.F5 NETWORKS: OPERATING SEGMENTS
    TABLE 157.F5 NETWORKS: PRODUCT PORTFOLIO
    TABLE 158.F5 NETWORKS: NET SALES,
    TABLE 159.F5 NETWORKS: KEY STRATERGIES
    TABLE 160. INC.: COMPANY SNAPSHOT
    TABLE 161. INC.: OPERATING SEGMENTS
    TABLE 162. INC.: PRODUCT PORTFOLIO
    TABLE 163. INC.: NET SALES,
    TABLE 164. INC.: KEY STRATERGIES
    TABLE 165.IMPERVA: COMPANY SNAPSHOT
    TABLE 166.IMPERVA: OPERATING SEGMENTS
    TABLE 167.IMPERVA: PRODUCT PORTFOLIO
    TABLE 168.IMPERVA: NET SALES,
    TABLE 169.IMPERVA: KEY STRATERGIES
    TABLE 170. INC.: COMPANY SNAPSHOT
    TABLE 171. INC.: OPERATING SEGMENTS
    TABLE 172. INC.: PRODUCT PORTFOLIO
    TABLE 173. INC.: NET SALES,
    TABLE 174. INC.: KEY STRATERGIES
    TABLE 175.FORTINET: COMPANY SNAPSHOT
    TABLE 176.FORTINET: OPERATING SEGMENTS
    TABLE 177.FORTINET: PRODUCT PORTFOLIO
    TABLE 178.FORTINET: NET SALES,
    TABLE 179.FORTINET: KEY STRATERGIES
    TABLE 180. INC.: COMPANY SNAPSHOT
    TABLE 181. INC.: OPERATING SEGMENTS
    TABLE 182. INC.: PRODUCT PORTFOLIO
    TABLE 183. INC.: NET SALES,
    TABLE 184. INC.: KEY STRATERGIES
    TABLE 185.APPLICURE TECHNOLOGIES LTD.: COMPANY SNAPSHOT
    TABLE 186.APPLICURE TECHNOLOGIES LTD.: OPERATING SEGMENTS
    TABLE 187.APPLICURE TECHNOLOGIES LTD.: PRODUCT PORTFOLIO
    TABLE 188.APPLICURE TECHNOLOGIES LTD.: NET SALES,
    TABLE 189.APPLICURE TECHNOLOGIES LTD.: KEY STRATERGIES
    TABLE 190.CLOUDFLARE: COMPANY SNAPSHOT
    TABLE 191.CLOUDFLARE: OPERATING SEGMENTS
    TABLE 192.CLOUDFLARE: PRODUCT PORTFOLIO
    TABLE 193.CLOUDFLARE: NET SALES,
    TABLE 194.CLOUDFLARE: KEY STRATERGIES
    TABLE 195. INC.: COMPANY SNAPSHOT
    TABLE 196. INC.: OPERATING SEGMENTS
    TABLE 197. INC.: PRODUCT PORTFOLIO
    TABLE 198. INC.: NET SALES,
    TABLE 199. INC.: KEY STRATERGIES
    TABLE 200.RADWARE LTD.: COMPANY SNAPSHOT
    TABLE 201.RADWARE LTD.: OPERATING SEGMENTS
    TABLE 202.RADWARE LTD.: PRODUCT PORTFOLIO
    TABLE 203.RADWARE LTD.: NET SALES,
    TABLE 204.RADWARE LTD.: KEY STRATERGIES
    TABLE 205.QUALYS, INC.: COMPANY SNAPSHOT
    TABLE 206.QUALYS, INC.: OPERATING SEGMENTS
    TABLE 207.QUALYS, INC.: PRODUCT PORTFOLIO
    TABLE 208.QUALYS, INC.: NET SALES,
    TABLE 209.QUALYS, INC.: KEY STRATERGIES
    TABLE 210.: COMPANY SNAPSHOT
    TABLE 211.: OPERATING SEGMENTS
    TABLE 212.: PRODUCT PORTFOLIO
    TABLE 213.: NET SALES,
    TABLE 214.: KEY STRATERGIES
  • LIST OF FIGURES

  • FIGURE 1.WEB APPLICATION FIREWALL MARKET SEGMENTATION
    FIGURE 2.WEB APPLICATION FIREWALL MARKET,2020-2030
    FIGURE 3.WEB APPLICATION FIREWALL MARKET,2020-2030
    FIGURE 4. TOP INVESTMENT POCKETS, BY REGION
    FIGURE 5.PORTER FIVE-1
    FIGURE 6.PORTER FIVE-2
    FIGURE 7.PORTER FIVE-3
    FIGURE 8.PORTER FIVE-4
    FIGURE 9.PORTER FIVE-5
    FIGURE 10.TOP PLAYER POSITIONING
    FIGURE 11.WEB APPLICATION FIREWALL MARKET:DRIVERS, RESTRAINTS AND OPPORTUNITIES
    FIGURE 14.PATENT ANALYSIS BY COMPANY
    FIGURE 15.PATENT ANALYSIS BY COUNTRY
    FIGURE 15.WEB APPLICATION FIREWALL MARKET,BY COMPONENT,2020(%)
    FIGURE 16.COMPARATIVE SHARE ANALYSIS OF SOLUTION WEB APPLICATION FIREWALL MARKET,2020-2030(%)
    FIGURE 17.COMPARATIVE SHARE ANALYSIS OF SERVICES WEB APPLICATION FIREWALL MARKET,2020-2030(%)
    FIGURE 18.WEB APPLICATION FIREWALL MARKET,BY DEPLOYMENT MODEL,2020(%)
    FIGURE 19.COMPARATIVE SHARE ANALYSIS OF ON-PREMISE WEB APPLICATION FIREWALL MARKET,2020-2030(%)
    FIGURE 20.COMPARATIVE SHARE ANALYSIS OF CLOUD WEB APPLICATION FIREWALL MARKET,2020-2030(%)
    FIGURE 21.WEB APPLICATION FIREWALL MARKET,BY ORGANIZATION SIZE,2020(%)
    FIGURE 22.COMPARATIVE SHARE ANALYSIS OF LARGE ENTERPRISES WEB APPLICATION FIREWALL MARKET,2020-2030(%)
    FIGURE 23.COMPARATIVE SHARE ANALYSIS OF SMALL AND MEDIUM ENTERPRISES WEB APPLICATION FIREWALL MARKET,2020-2030(%)
    FIGURE 24.WEB APPLICATION FIREWALL MARKET,BY END USER,2020(%)
    FIGURE 25.COMPARATIVE SHARE ANALYSIS OF BFSI WEB APPLICATION FIREWALL MARKET,2020-2030(%)
    FIGURE 26.COMPARATIVE SHARE ANALYSIS OF HEALTHCARE WEB APPLICATION FIREWALL MARKET,2020-2030(%)
    FIGURE 27.COMPARATIVE SHARE ANALYSIS OF IT AND TELECOM WEB APPLICATION FIREWALL MARKET,2020-2030(%)
    FIGURE 28.COMPARATIVE SHARE ANALYSIS OF MANUFACTURING WEB APPLICATION FIREWALL MARKET,2020-2030(%)
    FIGURE 29.COMPARATIVE SHARE ANALYSIS OF GOVERNMENT AND PUBLIC SECTOR WEB APPLICATION FIREWALL MARKET,2020-2030(%)
    FIGURE 30.COMPARATIVE SHARE ANALYSIS OF RETAIL AND E-COMMERCE WEB APPLICATION FIREWALL MARKET,2020-2030(%)
    FIGURE 31.COMPARATIVE SHARE ANALYSIS OF OTHERS WEB APPLICATION FIREWALL MARKET,2020-2030(%)
    FIGURE 32.WEB APPLICATION FIREWALL MARKET BY REGION,2020
    FIGURE 33.U.S. WEB APPLICATION FIREWALL MARKET,2020-2030($MILLION)
    FIGURE 34.CANADA WEB APPLICATION FIREWALL MARKET,2020-2030($MILLION)
    FIGURE 35.U.K. WEB APPLICATION FIREWALL MARKET,2020-2030($MILLION)
    FIGURE 36.GERMANY WEB APPLICATION FIREWALL MARKET,2020-2030($MILLION)
    FIGURE 37.FRANCE WEB APPLICATION FIREWALL MARKET,2020-2030($MILLION)
    FIGURE 38.RUSSIA WEB APPLICATION FIREWALL MARKET,2020-2030($MILLION)
    FIGURE 39.POLAND WEB APPLICATION FIREWALL MARKET,2020-2030($MILLION)
    FIGURE 40.REST OF EUROPE WEB APPLICATION FIREWALL MARKET,2020-2030($MILLION)
    FIGURE 41.CHINA WEB APPLICATION FIREWALL MARKET,2020-2030($MILLION)
    FIGURE 42.INDIA WEB APPLICATION FIREWALL MARKET,2020-2030($MILLION)
    FIGURE 43.JAPAN WEB APPLICATION FIREWALL MARKET,2020-2030($MILLION)
    FIGURE 44.SOUTH KOREA WEB APPLICATION FIREWALL MARKET,2020-2030($MILLION)
    FIGURE 45.AUSTRALIA WEB APPLICATION FIREWALL MARKET,2020-2030($MILLION)
    FIGURE 46.REST OF ASIA-PACIFIC WEB APPLICATION FIREWALL MARKET,2020-2030($MILLION)
    FIGURE 47.LATIN AMERICA WEB APPLICATION FIREWALL MARKET,2020-2030($MILLION)
    FIGURE 48.MIDDLE EAST WEB APPLICATION FIREWALL MARKET,2020-2030($MILLION)
    FIGURE 49.AFRICA WEB APPLICATION FIREWALL MARKET,2020-2030($MILLION)
    FIGURE 50. TOP WINNING STRATEGIES, BY YEAR
    FIGURE 51. TOP WINNING STRATEGIES, BY DEVELOPMENT
    FIGURE 52. TOP WINNING STRATEGIES, BY COMPANY
    FIGURE 53.PRODUCT MAPPING OF TOP 10 PLAYERS
    FIGURE 54.COMPETITIVE DASHBOARD
    FIGURE 55.COMPETITIVE HEATMAP OF TOP 10 KEY PLAYERS
    FIGURE 56. INC..: NET SALES ,($MILLION)
    FIGURE 57.AKAMAI TECHNOLOGIES.: NET SALES ,($MILLION)
    FIGURE 58. INC..: NET SALES ,($MILLION)
    FIGURE 59.BARRACUDA NETWORKS.: NET SALES ,($MILLION)
    FIGURE 60. INC..: NET SALES ,($MILLION)
    FIGURE 61.CITRIX SYSTEMS.: NET SALES ,($MILLION)
    FIGURE 62. INC..: NET SALES ,($MILLION)
    FIGURE 63.F5 NETWORKS.: NET SALES ,($MILLION)
    FIGURE 64. INC..: NET SALES ,($MILLION)
    FIGURE 65.IMPERVA.: NET SALES ,($MILLION)
    FIGURE 66. INC..: NET SALES ,($MILLION)
    FIGURE 67.FORTINET.: NET SALES ,($MILLION)
    FIGURE 68. INC..: NET SALES ,($MILLION)
    FIGURE 69.APPLICURE TECHNOLOGIES LTD..: NET SALES ,($MILLION)
    FIGURE 70.CLOUDFLARE.: NET SALES ,($MILLION)
    FIGURE 71. INC..: NET SALES ,($MILLION)
    FIGURE 72.RADWARE LTD..: NET SALES ,($MILLION)
    FIGURE 73.QUALYS, INC..: NET SALES ,($MILLION)
    FIGURE 74..: NET SALES ,($MILLION)


The current business scenario exhibits surge in use of web application firewall across various applications such as healthcare, banking & financial, defense, IT & telecom, manufacturing, and others. In accordance with insights of leading CXOs, utilization of web application firewall among different end-use industries has increased, owing to rise in adoption of cloud-based solutions as well as the need to optimize business operations for enhanced security solutions. Moreover, this market gains significant acceptance from commercial users and large enterprises to improve business performance and meeting  expectations of customers by analyzing varied approaches.

Adoption of cloud security solutions has increased among both, large enterprises and SMEs, owing to rapidly evolving infrastructure of application delivery structure and increase in acceptance of cloud solutions that facilitate cost optimization benefits and business expansion opportunities through the use of cloud services. Cloud-based deployment model does not involve capital cost and is low on maintenance requirements; hence, is most preferred by SMEs. In addition, increase in market for machine learning technologies support growth of this market. Industry players are focused toward introduction of advanced solutions to leverage market demands

According to CXOs, increase in economic strength of developing nations such as China, India, Indonesia, and Thailand is expected to provide lucrative opportunities for the market. North America is expected to dominate the market during the forecast period and emerging countries in Asia-Pacific and Latin America are projected to offer significant growth opportunities.

PURCHASE OPTIONS

Call or Email us

U.S.-Canada Toll-free: +1-800-792-5285
Int'l : +1-503-894-6022
Europe : +44-845-528-1300
Email : help@alliedmarketresearch.com
 
FREQUENTLY ASKED QUESTIONS?

A. The web application firewall market was valued at $4,763.5 million in 2020.

A. BFSI followed by IT & telecom and retail sector are the prominent end users in the Web Application Firewall Market.

A. The significant trends in web application firewall (WAF) market includes rapid adoption of Cloud-Based WAFs and introduction of artificial intelligence & machine learning powered WAFs

A. North America region dominated the global web application firewall market.

A. Akamai Technologies, Inc., Barracuda Networks, Inc., Citrix Systems, Inc., F5 Networks, Inc., Imperva, Inc., Fortinet, Inc., Applicure Technologies Ltd., Qualys, Inc., Cloudflare, Inc., and Radware Ltd.

Looking for Customization?

 Customization Request

Have a Question?

 Speak with Analyst

Any Confusion?

 Inquire Before Buying

Have a glance of the Report

  Request Sample
RELATED TAGS

Purchase Full Report of
Web Application Firewall Market

Start reading instantly.
This Report and over 68,378+ more Reports, Available with Avenue Library. T&C*.

  • Online Only
  • $3,456
  • Online cloud access only
  • Restricted print, copy, paste & download
  • Read only
  • Free industry update
    (Within 180 days)
  • Free report update in next update cycle
    (Mar 2023 - Mar 2024)
  • Data Pack
  • $3,840
  • Restricted to one authorized user
  • One print only
  • Available in
    Excel
  • Free industry update
    (Within 180 days)
  •   Free report update in next update cycle
    (Mar 2023 - Mar 2024)
  • Single User
  • $5,769
  • Restricted to one authorized user
  • One print only
  • Available in
    PDF
  • Free industry update
    (Within 180 days)
  •   Free report update in next update cycle
    (Mar 2023 - Mar 2024)
  • Five Users
  • $6,450
  • Limited to five authorized users
  • Print upto five copies
  • Available in
    PDF
  • Free industry update
    (Within 180 days)
  •   Free report update in next update cycle
    (Mar 2023 - Mar 2024)
  • Enterprise
    License/PDF

  • $10,995
  • Unlimited
    within
    company/enterprise
  • Available in Excel & PDF
  • Free industry update
    (Within 180 days)
  •   Free report update in next update cycle
    (Mar 2023 - Mar 2024)
  • Library
    Membership

  • $999 $ 1,175
    Per User/ Per month/ Billed annually
  • Published Content
    E-access
  • Company Profiles
    E-access
  • Newly Added Content Access
  • 10 PDF
    Downloads
  • 5 Excel Data
    Pack Downloads
  • 250 Company Profiles PDF Downloads
  • Buy Now

*Taxes/Fees, if applicable will be added during checkout. All prices in USD

RELATED REPORTS
 

Why Allied Market Research?


Infallible Methodology

To ensure high-level data integrity, accurate analysis, and impeccable forecasts

Analyst Support

For complete satisfaction

Customization

On-demand customization of scope of the report to exactly meet your needs

TARGETED MARKET VIEW

Targeted market view to provide pertinent information and save time of readers

Get fresh content delivered

Get insights on topics that are crucial for your business. Stay abreast of your interest areas.

Get Industry Data Alerts

Why Allied Market Research?

Infallible Methodology

To ensure high-level data integrity, accurate analysis, and impeccable forecasts

Analyst Support

For complete satisfaction

Customization

On-demand customization of scope of the report to exactly meet your needs

TARGETED MARKET VIEW

Targeted market view to provide pertinent information and save time of readers