0
2019
White Cement Market

White Cement Market

Forecast by Type (White Portland Cement, White Masonry Cement, and Others) and End Use (Residential, Commercial, and Industrial): Global Opportunity Analysis and Industry Forecast, 2018-2025

Report Code: A02920
Jun 2019 | Pages: 296
Tables: 206
Charts: 47
  • Formats*:

  • pdf

    Single User License, Five User
    License & Enterprise User License

  • xls

    Data Pack Excel License

  • ppt

    It comes with the additional cost
    of $2500.00 contact sales.


COVID-19

Pandemic disrupted the entire world and affected many industries.

Get detailed COVID-19 impact analysis on the White Cement Market

Request Now !

White Cement Market Outlook - 2025

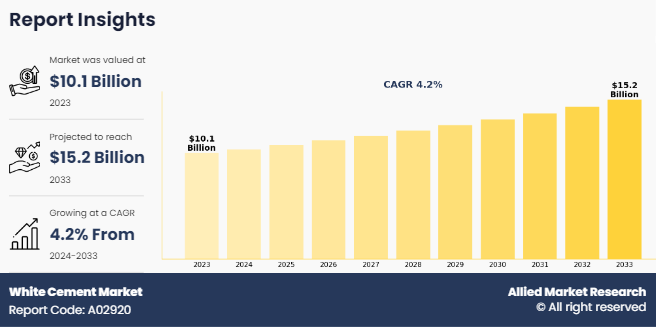
The global white cement market size was valued at $7,966.5 million in 2017 and is projected to reach $10,904.1 million by 2025, growing at a CAGR of 4.0% from 2018 to 2025. The residential segment accounted for nearly 46.9% of the global end-use market share in 2017.

White cement is similar to gray Portland cement, except that the difference lies in the color, fineness, strength, and ease of use. White cement is produced with the same process as gray cement; however, the raw materials differ significantly. The iron oxide and iron sulfate content in the limestone is kept as low as possible as each 0.1% increase in iron oxide reduces cement reflectivity by 2.5%, producing darker cement. All the processes involved in the production of white cement requires machinery equipment to smoothen the process and produce quality white cement for the end user.

White Cement Market

Rapid demand for aesthetics in the construction industry drive the growth of the white cement market. Massive residential construction due to increase in influx of migrants in Asia-Pacific countries drive the growth of the construction sector. This leads to increase in demand for construction material such as white cements board, panel, and cladding material. Rise in demand in decorative applications fosters the global white cement market growth, thereby exhibiting an integrated part of contemporary architecture. White cement is increasingly used for finishing of interior and exterior walls.

Moreover, architectural concrete, made from white cement add new aesthetic and decorative appearance to modern buildings and has notable applications in molding of sculptures, benches, and others. White Portland cement is made from raw materials containing little or no iron or manganese, which are the major compositions of gray cement. The amount of chromium, manganese, and iron compounds is significantly less in white cement as compared to gray cement. However, it lacks iron oxides. Hence, its strength and durability is lesser in comparison with pure gray Portland cement. Furthermore, lower binding property than cement-based putty deters the global white cement market growth. 

Rapid boom in construction industry drives the demand of the global white cement market. The white cement market has witnessed rapid growth owing to rapid demand for aesthetics in the construction industry. Massive residential construction due to the massive influx of migrants in Western European countries drive  the  growth  of  the  construction  sector  in  Germany.  This leads  to  increase  in  demand  for  effective construction  material  such  as  white  cements board,  panel,  and  cladding  material.  According  to  the  Global Construction Perspectives and Oxford Economics, the construction industry accounted for $8.7 trillion in 2012, which is expected to rise by $6.3 trillion or over 70% to $15 trillion by 2025. The global construction industry is expected to  represent  13.5%  of  the  global  economy  by  2025.  Companies,  such  as  JK  Cement,  have  been manufacturing white cement and deploying it in construction applications. The rapid demand for white cement in precast applications due to its aesthetic and beautification properties increases the mark.

However, low strength of white cement in comparison with other cement products hampers the market growth. White  Portland  cement  is  made  from  raw  materials  containinglittle  or  no  iron  or  manganese,  which  are  the major compositions of gray cement. The amount of chromium, manganese, and iron compounds is significantly less in white cement as compared to gray cement. However, it is lacking iron oxides. Hence, its strength and durability arelesser in comparison with pure gray Portland cement. Furthermore, lower binding property than cement-based  putty  deters the market growth. Thus, lowered  strength of white cement owing to little  or no presence of iron compounds is expected to negatively influence the market growth during the forecast period.

On the contrary, increase in demand for white cement as a substitute over gray cement offers lucrative growth opportunities. There  is  an  increase  in  demand  for  white  cement  in  countries,  such  as  Saudi  Arabia,  Kuwait,  and  Russia  with high  temperature  close  to  55°C  owing  to  heat-reflecting  properties  and  superior  aesthetic  appearance.  In comparison  with  gray  concrete,  more  heat  is  reflected  with  white  concrete  surface  which  further  creates attractive opportunities to the market growth. Light colored concrete like white concrete absorbs less heat and reflects  more  light  than  dark-colored  concrete  such  as  gray  concrete.  The  rapid  mixture  of  white  cement  in concrete  for  decoration  at  roofs  creates  soothing  effects,  which  in  turn  creates  opportunities  for  the  market growth.  Growth  in  number  of  white  cement  flooring  and  roofing  applications  is  projected  to  have  a  positive impact  on  demand  for  white  cement  products,  thus  providing  lucrative  opportunities  for  manufacturers  and suppliers globally.

The global white cement market is segmented based on type, end use, and region. On the basis of type, it is classified into white Portland cement, white masonry cement, and others. On the basis of end use, it is divided into residential, commercial, and industrial. By region, it is analyzed across North America, Europe, Asia-Pacific, Latin America and MEA.

The major key players operating in the White Cement industry include Cementir Holding SPA, Çimsa Cement Industry and Trade Inc., JK Cement, Cemex, The Cementos Portland Valderrivas, Birla White (Ultratech), Federal White Cement, Saveh White Cement Co., Adana Cement, and Saudi White Cement Co. The other key players include Lafargeholcim, Secil, Dyckerhoff, Royal El Minya Cement, Fars & Khuzestan Cement Co., Scg, Italcementi, Rakwhitecement.Ae, Union Cement Company, Royal White Cement, and Neyeariz White Cement Company.

In order to stay competitive, these major key players are adopting different strategies such as acquisition, business expansion, collaboration, and divestment. For instance, Saudi White Cement Co. signed dual production contract with Teknik FISmidth to convert gray cement line into white cement and gray cement, thereby increasing its capacity to 1 million ton per year. Furthermore, Ras Al Khaimah Company signed a partnership agreement with Masheed Trading and Transportation Company, which is one of the largest companies specialized in building materials, for import and distribution of cement in Saudi Arabia.

The degree of industry attractiveness in the white cement market is analyzed based on impact of five major forces on the market. Porter’s five forces analysis includes the impact of suppliers, industry rivals, new entrants, substitute products, and buyers on the market growth. The raw material suppliers for white cement-based products include various domestic and international producers of cements. Porter’s five forces model analyzes the macro- and microbusiness factors of the global market. The suppliers in the market include sellers of white Portland cement and white masonry cement. Residential, commercial, and industrial consumers are considered as customers in the market.

Global White Cement Market, by region

White Cement Market by Region

Based on region, Asia-Pacific accounts for major share in the global white Cement market and Asia-Pacific is also attributed to be the fastest growing region. Rise in building & construction expenditures drives the demand for white cement in housing and commercial projects in China and India. In addition, the increase in urban population makes way for increasing construction activities providing growth opportunity for the overall market. It increases the need of white cement products including facades tiles, trim boards especially in the countries such as India, Japan, and China.

Global White Cement Market Share, by Type

White Cement Market by Type

Based on type, the white Portland cement segment dominated the market in 2017, owing to increase in use of white Portland cement in combination with white aggregates to produce white concrete for construction projects and decorative work. In addition, white Portland cement is also blend with inorganic pigments to produce brightly colored concretes and mortars.

Global White Cement Market Share, by End Use

White Cement Market by End use

Based on end use, the commercial segment is expected to grow with the highest CAGR during the forecast period. The installation of white cement in constructing commercial infrastructure helps builders in energy saving and offers heat resistant, benefitting the market growth due to increase in demand from European countries. The demand for White cement in Europe is expected to increase in the coming decade owing to the commencement of several commercial infrastructure projects such as construction of second Tesla Gigafactory in Sweden worth $4.2 billion.

Key Benefits for White Cement Market:

  • Porter’s five forces analysis helps to analyze the potential of buyers & suppliers and the competitive scenario of the white cement industry for strategy building.
  • It outlines the current white cement market trends and future scenario of the market size from 2018 to 2025 to understand the prevailing opportunities and potential investment pockets.
  • Major countries in the region have been mapped according to their individual revenue contribution to the regional market.
  • The key drivers, restraints, and opportunities and their detailed impact analyses are elucidated in the study.
  • The profiles of key players along with their key strategic developments are enlisted in the white cement market analysis.

White Cement Market Report Highlights

Aspects Details
By White Cement Business Plan
  • Manufacturing process
    • Mining and quarrying
    • Raw material preparation
    • Pyro-processing
    • Finish grinding
  • Plant investment
  • Machinery and equipment
    • Mining equipment
    • Crushing equipment
    • Grinding equipment
    • Fuel preparation equipment
    • Kiln operation equipment
    • Packing process
  • Energy efficient initiatives
    • Portland cement association (PCA)
    • Cement kiln recycling coalition (CKRC)
    • Climate VISION
    • ENERGY STAR
    • Climate leaders
By Type
  • White Portland Cement
  • White Masonry Cement
  • Others
By End Use
  • Residential
  • Commercial
  • Industrial
By Region
  • North America  (U.S., Canada, Mexico)
  • Europe  (UK, Germany, France, Italy, Spain, Rest of Europe)
  • Asia-Pacific  (China, Japan, India, Australia, Pakistan, South Korea, Rest of Asia-Pacific)
  • Latin America  (Brazil, Rest of Latin America)
  • MEA  (Turkey, UAE, Saudi Arabia, Iran, South Africa, Rest of MEA)
Key Market Players SAUDI WHITE CEMENT CO., ADANA CIMENTO SANAYI T.A.S., CEMENTIR HOLDING SPA, LAFARGEHOLCIM LTD., SAVEH CEMENT COMPANY, ROYAL WHITE CEMENT INC., NEYRIZ WHITE CEMENT COMPANY, THE SIAM CEMENT GROUP PUBLIC COMPANY LIMITED, ROYAL EL MINYA CEMENT, DYCKERHOFF GmbH, HEIDELBERGCEMENT, ULTRATECH CEMENT LTD., CEMEX S.A.B. DE C.V., RAS AL KHAIMAH CO. FOR WHITE CEMENT & CONSTRUCTION MATERIALS (RAKWCCM), CIMSA CEMENT INDUSTRY AND TRADE INC., SECIL, FARS & KHUZESTAN CEMENT CO., CEMENTOS PORTLAND VALDERRIVAS S.A., FEDERAL WHITE CEMENT, UNION CEMENT COMPANY, JK CEMENT LTD.
 

CHAPTER 1:    OVERVIEW

1.1.    Report description
1.2.    Key benefits for stakeholders
1.3.    Key market segments
1.4.    Research methodology

1.4.1.    Primary research
1.4.2.    Secondary research
1.4.3.    Analyst tools and models

CHAPTER 2:    EXECUTIVE SUMMARY

2.1.    CXO perspective

CHAPTER 3:    MARKET OVERVIEW

3.1.    Market definition and scope
3.2.    Key findings

3.2.1.    Top investment pockets
3.2.2.    Top Winning Strategies

3.3.    Porter five forces analysis

3.3.1.    Moderate bargaining power of suppliers
3.3.2.    High threat of new entrants
3.3.3.    Moderate threat of substitutes
3.3.4.    High intensity of rivalry
3.3.5.    Low bargaining power of buyers

3.4.    Market dynamics

3.4.1.    Drivers

3.4.1.1.    Rapid boom of construction industry
3.4.1.2.    High Purchasing power of end users
3.4.1.3.    Rise in use of white cement for decorative applications

3.4.2.    Restraints

3.4.2.1.    Lower strength of white cement in comparison with other cements
3.4.2.2.    Higher costs as compared to gray cement

3.4.3.    Opportunity

3.4.3.1.    Increase in demand for white cement as a substitute for gray cement

3.5.    Market share analysis, 2018
3.6.    Market share analysis of Indian Players, 2018
3.7.    Production capacities, 2018
3.8.    Indian End-use industry wise consumption, 2018
3.9.    Import and export data analysis, 2018

CHAPTER 4:    WHITE CEMENT BUSINESS PLAN

4.1.    Overview

4.1.1.    Suppliers
4.1.2.    Manufacturer
4.1.3.    Packing and storage
4.1.4.    Sales and distribution network

4.2.    Manufacturing process

4.2.1.    Mining and quarrying
4.2.2.    Raw material preparation
4.2.3.    Pyro-processing
4.2.4.    Finish grinding

4.3.    Plant investment
4.4.    Machinery and equipment

4.4.1.    Mining equipment
4.4.2.    Crushing equipment
4.4.3.    Grinding equipment
4.4.4.    Fuel preparation equipment
4.4.5.    Kiln operation equipment
4.4.6.    Packing process

4.5.    Energy efficient initiatives

4.5.1.    Portland cement association (PCA)
4.5.2.    Cement kiln recycling coalition (CKRC)
4.5.3.    Climate VISION
4.5.4.    ENERGY STAR
4.5.5.    Climate leaders

CHAPTER 5:    WHITE CEMENT MARKET, BY TYPE

5.1.    Overview
5.2.    White Portland cement

5.2.1.    Key market trends, growth factors and opportunities
5.2.2.    Market size and forecast, by region
5.2.3.    Market analysis by country

5.3.    White masonry cement

5.3.1.    Key market trends, growth factors and opportunities
5.3.2.    Market size and forecast, by region
5.3.3.    Market analysis by country

5.4.    Others

5.4.1.    Key market trends, growth factors and opportunities
5.4.2.    Market size and forecast, by region
5.4.3.    Market analysis by country

CHAPTER 6:    WHITE CEMENT MARKET, BY END USE

6.1.    Overview
6.2.    Residential

6.2.1.    Key market trends, growth factors and opportunities
6.2.2.    Market size and forecast, by region
6.2.3.    Market analysis by country

6.3.    Commercial

6.3.1.    Key market trends, growth factors and opportunities
6.3.2.    Market size and forecast, by region
6.3.3.    Market analysis by country

6.4.    Industrial

6.4.1.    Key market trends, growth factors and opportunities
6.4.2.    Market size and forecast, by region
6.4.3.    Market analysis by country

CHAPTER 7:    WHITE CEMENT MARKET, BY REGION

7.1.    Overview
7.2.    North America

7.2.1.    Key market trends, growth factors and opportunities
7.2.2.    Market size and forecast, by type
7.2.3.    Market size and forecast, by end use
7.2.4.    Market analysis by country

7.2.4.1.    U.S.

7.2.4.1.1.    Market size and forecast, by Type
7.2.4.1.2.    Market size and forecast, by End Use

7.2.4.2.    Canada

7.2.4.2.1.    Market size and forecast, by Type
7.2.4.2.2.    Market size and forecast, by End Use

7.2.4.3.    Mexico

7.2.4.3.1.    Market size and forecast, by Type
7.2.4.3.2.    Market size and forecast, by End Use

7.3.    Europe

7.3.1.    Key market trends, growth factors and opportunities
7.3.2.    Market size and forecast, by type
7.3.3.    Market size and forecast, by end use
7.3.4.    Market analysis by country

7.3.4.1.    UK

7.3.4.1.1.    Market size and forecast, by Type
7.3.4.1.2.    Market size and forecast, by End Use

7.3.4.2.    Germany

7.3.4.2.1.    Market size and forecast, by Type
7.3.4.2.2.    Market size and forecast, by End Use

7.3.4.3.    France

7.3.4.3.1.    Market size and forecast, by Type
7.3.4.3.2.    Market size and forecast, by End Use

7.3.4.4.    Italy

7.3.4.4.1.    Market size and forecast, by Type
7.3.4.4.2.    Market size and forecast, by End Use

7.3.4.5.    Spain

7.3.4.5.1.    Market size and forecast, by Type
7.3.4.5.2.    Market size and forecast, by End Use

7.3.4.6.    Rest of Europe

7.3.4.6.1.    Market size and forecast, by Type
7.3.4.6.2.    Market size and forecast, by End Use

7.4.    Asia-Pacific

7.4.1.    Key market trends, growth factors and opportunities
7.4.2.    Market size and forecast, by type
7.4.3.    Market size and forecast, by end use
7.4.4.    Market analysis by country

7.4.4.1.    China

7.4.4.1.1.    Market size and forecast, by Type
7.4.4.1.2.    Market size and forecast, by End Use

7.4.4.2.    Japan

7.4.4.2.1.    Market size and forecast, by Type
7.4.4.2.2.    Market size and forecast, by End Use

7.4.4.3.    India

7.4.4.3.1.    Market size and forecast, by Type
7.4.4.3.2.    Market size and forecast, by End Use

7.4.4.4.    Australia

7.4.4.4.1.    Market size and forecast, by Type
7.4.4.4.2.    Market size and forecast, by End Use

7.4.4.5.    Pakistan

7.4.4.5.1.    Market size and forecast, by Type
7.4.4.5.2.    Market size and forecast, by End Use

7.4.4.6.    South Korea

7.4.4.6.1.    Market size and forecast, by Type
7.4.4.6.2.    Market size and forecast, by End Use

7.4.4.7.    Rest of Asia-Pacific

7.4.4.7.1.    Market size and forecast, by Type
7.4.4.7.2.    Market size and forecast, by End Use

7.5.    Latin America

7.5.1.    Key market trends, growth factors and opportunities
7.5.2.    Market size and forecast, by type
7.5.3.    Market size and forecast, by end use
7.5.4.    Market analysis by country

7.5.4.1.    Brazil

7.5.4.1.1.    Market size and forecast, by Type
7.5.4.1.2.    Market size and forecast, by End Use

7.5.4.2.    Rest of Latin America

7.5.4.2.1.    Market size and forecast, by Type
7.5.4.2.2.    Market size and forecast, by End Use

7.6.    MEA

7.6.1.    Key market trends, growth factors and opportunities
7.6.2.    Market size and forecast, by type
7.6.3.    Market size and forecast, by end use
7.6.4.    Market analysis by country

7.6.4.1.    Turkey

7.6.4.1.1.    Market size and forecast, by Type
7.6.4.1.2.    Market size and forecast, by End Use

7.6.4.2.    UAE

7.6.4.2.1.    Market size and forecast, by Type
7.6.4.2.2.    Market size and forecast, by End Use

7.6.4.3.    Saudi Arabia

7.6.4.3.1.    Market size and forecast, by Type
7.6.4.3.2.    Market size and forecast, by End Use

7.6.4.4.    Iran

7.6.4.4.1.    Market size and forecast, by Type
7.6.4.4.2.    Market size and forecast, by End Use

7.6.4.5.    South Africa

7.6.4.5.1.    Market size and forecast, by Type
7.6.4.5.2.    Market size and forecast, by End Use

7.6.4.6.    Rest of MEA

7.6.4.6.1.    Market size and forecast, by Type
7.6.4.6.2.    Market size and forecast, by End Use

CHAPTER 8:    COMPANY PROFILES

8.1.    ADANA CIMENTO SANAYI T.A.S.

8.1.1.    Company overview
8.1.2.    Company snapshot
8.1.3.    Operating business segments
8.1.4.    Product portfolio
8.1.5.    Business performance

8.2.    CEMENTIR HOLDING SPA

8.2.1.    Company overview
8.2.2.    Company snapshot
8.2.3.    Operating business segments
8.2.4.    Business performance
8.2.5.    Key strategic moves and developments

8.3.    CEMENTOS PORTLAND VALDERRIVAS S.A.

8.3.1.    Company overview
8.3.2.    Company snapshot
8.3.3.    Operating business segments
8.3.4.    Business performance

8.4.    CEMEX S.A.B. DE C.V.

8.4.1.    Company overview
8.4.2.    Company snapshot
8.4.3.    Operating business segments
8.4.4.    Business performance
8.4.5.    Key strategic moves and developments

8.5.    CIMSA CEMENT INDUSTRY AND TRADE INC.

8.5.1.    Company overview
8.5.2.    Company snapshot
8.5.3.    Operating business segments
8.5.4.    Product portfolio
8.5.5.    Business performance
8.5.6.    Key strategic moves and developments

8.6.    DYCKERHOFF GmbH

8.6.1.    Company overview
8.6.2.    Company snapshot
8.6.3.    Operating business segments
8.6.4.    Product portfolio
8.6.5.    Business performance
8.6.6.    Key strategic moves and developments

8.7.    FARS & KHUZESTAN CEMENT CO.

8.7.1.    Company overview
8.7.2.    Company snapshot
8.7.3.    Product portfolio

8.8.    FEDERAL WHITE CEMENT

8.8.1.    Company overview
8.8.2.    Company snapshot
8.8.3.    Product portfolio

8.9.    HEIDELBERGCEMENT

8.9.1.    Company overview
8.9.2.    Company snapshot
8.9.3.    Product portfolio
8.9.4.    Business performance
8.9.5.    Key strategic moves and developments

8.10.    JK CEMENT LTD.

8.10.1.    Company overview
8.10.2.    Company snapshot
8.10.3.    Product portfolio
8.10.4.    Business performance

8.11.    LAFARGEHOLCIM LTD.

8.11.1.    Company overview
8.11.2.    Company snapshot
8.11.3.    Operating business segments
8.11.4.    Product portfolio
8.11.5.    Business performance
8.11.6.    Key strategic moves and developments

8.12.    NEYRIZ WHITE CEMENT COMPANY

8.12.1.    Company overview
8.12.2.    Company snapshot
8.12.3.    Product portfolio

8.13.    RAS AL KHAIMAH CO. FOR WHITE CEMENT & CONSTRUCTION MATERIALS (RAKWCCM)

8.13.1.    Company overview
8.13.2.    Company snapshot
8.13.3.    Operating business segments
8.13.4.    Product portfolio
8.13.5.    Business performance
8.13.6.    Key strategic moves and developments

8.14.    ROYAL EL MINYA CEMENT

8.14.1.    Company overview
8.14.2.    Company snapshot
8.14.3.    Product portfolio

8.15.    ROYAL WHITE CEMENT INC.

8.15.1.    Company overview
8.15.2.    Company snapshot
8.15.3.    Product portfolio

8.16.    SAUDI WHITE CEMENT CO.

8.16.1.    Company overview
8.16.2.    Company snapshot
8.16.3.    Product portfolio
8.16.4.    Business performance
8.16.5.    Key strategic moves and developments

8.17.    SAVEH CEMENT COMPANY

8.17.1.    Company overview
8.17.2.    Company snapshot
8.17.3.    Product portfolio

8.18.    THE SIAM CEMENT GROUP PUBLIC COMPANY LIMITED

8.18.1.    Company overview
8.18.2.    Company snapshot
8.18.3.    Operating business segments
8.18.4.    Business performance
8.18.5.    Key strategic moves and developments

8.19.    SECIL

8.19.1.    Company overview
8.19.2.    Company snapshot
8.19.3.    Operating business segment
8.19.4.    Business performance
8.19.5.    Key strategic moves and developments

8.20.    ULTRATECH CEMENT LTD.

8.20.1.    Company overview
8.20.2.    Company snapshot
8.20.3.    Operating business segments
8.20.4.    Product portfolio
8.20.5.    Business performance

8.21.    UNION CEMENT COMPANY

8.21.1.    Company overview
8.21.2.    Company snapshot
8.21.3.    Product portfolio

LIST OF TABLES

TABLE 01.    PRODUCTION CAPACITY, BY COMPANY, 2018
TABLE 02.    EXPORT DATA ANALYSIS, BY COUNTRY (TONS), 2018
TABLE 03.    IMPORT DATA ANALYSIS, BY COUNTRY (TONS), 2018
TABLE 04.    EXPORT DATA ANALYSIS, BY COUNTRY ($ THOUSAND), 2018
TABLE 05.    IMPORT DATA ANALYSIS, BY COUNTRY ($ THOUSAND), 2018
TABLE 06.    GLOBAL WHITE CEMENT MARKET, BY TYPE, 2017-2025 ($MILLION)
TABLE 07.    GLOBAL WHITE CEMENT MARKET, BY TYPE, 2017-2025 (KILOTONS)
TABLE 08.    WHITE CEMENT MARKET REVENUE FOR WHITE PORTLAND CEMENT, BY REGION 2017-2025 ($MILLION)
TABLE 09.    WHITE CEMENT MARKET VOLUME FOR WHITE PORTLAND CEMENT, BY REGION 2017-2025 (KILOTONS)
TABLE 10.    WHITE CEMENT MARKET REVENUE FOR WHITE MASONRY CEMENT, BY REGION 2017-2025 ($MILLION)
TABLE 11.    WHITE CEMENT MARKET VOLUME FOR WHITE MASONRY CEMENT, BY REGION 2017-2025 (KILOTONS)
TABLE 12.    WHITE CEMENT MARKET REVENUE FOR OTHERS, BY REGION 2017-2025 ($MILLION)
TABLE 13.    WHITE CEMENT MARKET VOLUME FOR OTHERS, BY REGION 2017-2025 (KILOTONS)
TABLE 14.    GLOBAL WHITE CEMENT MARKET, BY END-USE, 2017-2025 ($MILLION)
TABLE 15.    GLOBAL WHITE CEMENT MARKET, BY END-USE, 2017-2025 (KILOTONS)
TABLE 16.    WHITE CEMENT MARKET REVENUE FOR RESIDENTIAL, BY REGION 2017-2025 ($MILLION)
TABLE 17.    WHITE CEMENT MARKET VOLUME FOR RESIDENTIAL, BY REGION 2017-2025 (KILOTONS)
TABLE 18.    WHITE CEMENT MARKET REVENUE FOR COMMERCIAL, BY REGION 2017-2025 ($MILLION)
TABLE 19.    WHITE CEMENT MARKET VOLUME FOR COMMERCIAL, BY REGION 2017-2025 (KILOTONS)
TABLE 20.    WHITE CEMENT MARKET REVENUE FOR INDUSTRIAL, BY REGION 2017-2025 ($MILLION)
TABLE 21.    WHITE CEMENT MARKET VOLUME FOR INDUSTRIAL, BY REGION 2017-2025 (KILOTONS)
TABLE 22.    GLOBAL WHITE CEMENT MARKET REVENUE, 2017–2025($MILLION)
TABLE 23.    GLOBAL WHITE CEMENT MARKET VOLUME, 2017–2025(KILOTONS)
TABLE 24.    NORTH AMERICA WHITE CEMENT MARKET REVENUE, BY TYPE 2017–2025($MILLION)
TABLE 25.    NORTH AMERICA WHITE CEMENT MARKET VOLUME, BY TYPE 2017–2025(KILOTONS)
TABLE 26.    NORTH AMERICA WHITE CEMENT MARKET VALUE, BY END-USE, 2017–2025($MILLION)
TABLE 27.    NORTH AMERICA WHITE CEMENT MARKET VOLUME, BY END-USE, 2017–2025(KILOTONS)
TABLE 28.    NORTH AMERICA WHITE CEMENT MARKET VALUE, BY COUNTRY, 2018–2025($MILLION)
TABLE 29.    NORTH AMERICA WHITE CEMENT MARKET VOLUME, BY COUNTRY, 2018–2025(KILOTONS)
TABLE 30.    U.S. WHITE CEMENT MARKET REVENUE, BY TYPE 2017–2025($MILLION)
TABLE 31.    U.S. WHITE CEMENT MARKET VOLUME, BY TYPE 2017–2025(KILOTONS)
TABLE 32.    U.S. WHITE CEMENT MARKET VALUE, BY END-USE, 2017–2025($MILLION)
TABLE 33.    U.S. WHITE CEMENT MARKET VOLUME, BY END-USE, 2017–2025(KILOTONS)
TABLE 34.    CANADA WHITE CEMENT MARKET REVENUE, BY TYPE 2017–2025($MILLION)
TABLE 35.    CANADA WHITE CEMENT MARKET VOLUME, BY TYPE 2017–2025(KILOTONS)
TABLE 36.    CANADA WHITE CEMENT MARKET VALUE, BY END-USE, 2017–2025($MILLION)
TABLE 37.    CANADA WHITE CEMENT MARKET VOLUME, BY END-USE, 2017–2025(KILOTONS)
TABLE 38.    MEXICO WHITE CEMENT MARKET REVENUE, BY TYPE 2017–2025($MILLION)
TABLE 39.    MEXICO WHITE CEMENT MARKET VOLUME, BY TYPE 2017–2025(KILOTONS)
TABLE 40.    MEXICO WHITE CEMENT MARKET VALUE, BY END-USE, 2017–2025($MILLION)
TABLE 41.    MEXICO WHITE CEMENT MARKET VOLUME, BY END-USE, 2017–2025(KILOTONS)
TABLE 42.    EUROPE WHITE CEMENT MARKET REVENUE, BY TYPE 2017–2025($MILLION)
TABLE 43.    EUROPE WHITE CEMENT MARKET VOLUME, BY TYPE 2017–2025(KILOTONS)
TABLE 44.    EUROPE WHITE CEMENT MARKET VALUE, BY END-USE, 2017–2025($MILLION)
TABLE 45.    EUROPE WHITE CEMENT MARKET VOLUME, BY END-USE, 2017–2025(KILOTONS)
TABLE 46.    EUROPE WHITE CEMENT MARKET VALUE, BY COUNTRY, 2018–2025($MILLION)
TABLE 47.    EUROPE WHITE CEMENT MARKET VOLUME, BY COUNTRY, 2018–2025(KILOTONS)
TABLE 48.    UK WHITE CEMENT MARKET REVENUE, BY TYPE 2017–2025($MILLION)
TABLE 49.    UK WHITE CEMENT MARKET VOLUME, BY TYPE 2017–2025(KILOTONS)
TABLE 50.    UK WHITE CEMENT MARKET VALUE, BY END-USE, 2017–2025($MILLION)
TABLE 51.    UK WHITE CEMENT MARKET VOLUME, BY END-USE, 2017–2025(KILOTONS)
TABLE 52.    GERMANY WHITE CEMENT MARKET REVENUE, BY TYPE 2017–2025($MILLION)
TABLE 53.    GERMANY WHITE CEMENT MARKET VOLUME, BY TYPE 2017–2025(KILOTONS)
TABLE 54.    GERMANY WHITE CEMENT MARKET VALUE, BY END-USE, 2017–2025($MILLION)
TABLE 55.    GERMANY WHITE CEMENT MARKET VOLUME, BY END-USE, 2017–2025(KILOTONS)
TABLE 56.    FRANCE WHITE CEMENT MARKET REVENUE, BY TYPE 2017–2025($MILLION)
TABLE 57.    FRANCE WHITE CEMENT MARKET VOLUME, BY TYPE 2017–2025(KILOTONS)
TABLE 58.    FRANCE WHITE CEMENT MARKET VALUE, BY END-USE, 2017–2025($MILLION)
TABLE 59.    FRANCE WHITE CEMENT MARKET VOLUME, BY END-USE, 2017–2025(KILOTONS)
TABLE 60.    ITALY WHITE CEMENT MARKET REVENUE, BY TYPE 2017–2025($MILLION)
TABLE 61.    ITALY WHITE CEMENT MARKET VOLUME, BY TYPE 2017–2025(KILOTONS)
TABLE 62.    ITALY WHITE CEMENT MARKET VALUE, BY END-USE, 2017–2025($MILLION)
TABLE 63.    ITALY WHITE CEMENT MARKET VOLUME, BY END-USE, 2017–2025(KILOTONS)
TABLE 64.    SPAIN WHITE CEMENT MARKET REVENUE, BY TYPE 2017–2025($MILLION)
TABLE 65.    SPAIN WHITE CEMENT MARKET VOLUME, BY TYPE 2017–2025(KILOTONS)
TABLE 66.    SPAIN WHITE CEMENT MARKET VALUE, BY END-USE, 2017–2025($MILLION)
TABLE 67.    SPAIN WHITE CEMENT MARKET VOLUME, BY END-USE, 2017–2025(KILOTONS)
TABLE 68.    REST OF EUROPE WHITE CEMENT MARKET REVENUE, BY TYPE 2017–2025($MILLION)
TABLE 69.    REST OF EUROPE WHITE CEMENT MARKET VOLUME, BY TYPE 2017–2025(KILOTONS)
TABLE 70.    REST OF EUROPE WHITE CEMENT MARKET VALUE, BY END-USE, 2017–2025($MILLION)
TABLE 71.    REST OF EUROPE WHITE CEMENT MARKET VOLUME, BY END-USE, 2017–2025(KILOTONS)
TABLE 72.    ASIA-PACIFIC WHITE CEMENT MARKET REVENUE, BY TYPE 2017–2025($MILLION)
TABLE 73.    ASIA-PACIFIC WHITE CEMENT MARKET VOLUME, BY TYPE 2017–2025(KILOTONS)
TABLE 74.    ASIA-PACIFIC WHITE CEMENT MARKET VALUE, BY END-USE, 2017–2025($MILLION)
TABLE 75.    ASIA-PACIFIC WHITE CEMENT MARKET VOLUME, BY END-USE, 2017–2025(KILOTONS)
TABLE 76.    ASIA-PACIFIC WHITE CEMENT MARKET VALUE, BY COUNTRY, 2018–2025($MILLION)
TABLE 77.    ASIA-PACIFIC WHITE CEMENT MARKET VOLUME, BY COUNTRY, 2018–2025(KILOTONS)
TABLE 78.    CHINA WHITE CEMENT MARKET REVENUE, BY TYPE 2017–2025($MILLION)
TABLE 79.    CHINA WHITE CEMENT MARKET VOLUME, BY TYPE 2017–2025(KILOTONS)
TABLE 80.    CHINA WHITE CEMENT MARKET VALUE, BY END-USE, 2017–2025($MILLION)
TABLE 81.    CHINA WHITE CEMENT MARKET VOLUME, BY END-USE, 2017–2025(KILOTONS)
TABLE 82.    JAPAN WHITE CEMENT MARKET REVENUE, BY TYPE 2017–2025($MILLION)
TABLE 83.    JAPAN WHITE CEMENT MARKET VOLUME, BY TYPE 2017–2025(KILOTONS)
TABLE 84.    JAPAN WHITE CEMENT MARKET VALUE, BY END-USE, 2017–2025($MILLION)
TABLE 85.    JAPAN WHITE CEMENT MARKET VOLUME, BY END-USE, 2017–2025(KILOTONS)
TABLE 86.    INDIA WHITE CEMENT MARKET REVENUE, BY TYPE 2017–2025($MILLION)
TABLE 87.    INDIA WHITE CEMENT MARKET VOLUME, BY TYPE 2017–2025(KILOTONS)
TABLE 88.    INDIA WHITE CEMENT MARKET VALUE, BY END-USE, 2017–2025($MILLION)
TABLE 89.    INDIA WHITE CEMENT MARKET VOLUME, BY END-USE, 2017–2025(KILOTONS)
TABLE 90.    AUSTRALIA WHITE CEMENT MARKET REVENUE, BY TYPE 2017–2025($MILLION)
TABLE 91.    AUSTRALIA WHITE CEMENT MARKET VOLUME, BY TYPE 2017–2025(KILOTONS)
TABLE 92.    AUSTRALIA WHITE CEMENT MARKET VALUE, BY END-USE, 2017–2025($MILLION)
TABLE 93.    AUSTRALIA WHITE CEMENT MARKET VOLUME, BY END-USE, 2017–2025(KILOTONS)
TABLE 94.    PAKISTAN WHITE CEMENT MARKET REVENUE, BY TYPE 2017–2025($MILLION)
TABLE 95.    PAKISTAN WHITE CEMENT MARKET VOLUME, BY TYPE 2017–2025(KILOTONS)
TABLE 96.    PAKISTAN WHITE CEMENT MARKET VALUE, BY END-USE, 2017–2025($MILLION)
TABLE 97.    PAKISTAN WHITE CEMENT MARKET VOLUME, BY END-USE, 2017–2025(KILOTONS)
TABLE 98.    SOUTH KOREA WHITE CEMENT MARKET REVENUE, BY TYPE 2017–2025($MILLION)
TABLE 99.    SOUTH KOREA WHITE CEMENT MARKET VOLUME, BY TYPE 2017–2025(KILOTONS)
TABLE 100.    SOUTH KOREA WHITE CEMENT MARKET VALUE, BY END-USE, 2017–2025($MILLION)
TABLE 101.    SOUTH KOREA WHITE CEMENT MARKET VOLUME, BY END-USE, 2017–2025(KILOTONS)
TABLE 102.    REST OF ASIA-PACIFIC WHITE CEMENT MARKET REVENUE, BY TYPE 2017–2025($MILLION)
TABLE 103.    REST OF ASIA-PACIFIC WHITE CEMENT MARKET VOLUME, BY TYPE 2017–2025(KILOTONS)
TABLE 104.    REST OF ASIA-PACIFIC WHITE CEMENT MARKET VALUE, BY END-USE, 2017–2025($MILLION)
TABLE 105.    REST OF ASIA-PACIFIC WHITE CEMENT MARKET VOLUME, BY END-USE, 2017–2025(KILOTONS)
TABLE 106.    LATIN AMERICA WHITE CEMENT MARKET REVENUE, BY TYPE 2017–2025($MILLION)
TABLE 107.    LATIN AMERICA WHITE CEMENT MARKET VOLUME, BY TYPE 2017–2025(KILOTONS)
TABLE 108.    LATIN AMERICA WHITE CEMENT MARKET VALUE, BY END-USE, 2017–2025($MILLION)
TABLE 109.    LATIN AMERICA WHITE CEMENT MARKET VOLUME, BY END-USE, 2017–2025(KILOTONS)
TABLE 110.    LATIN AMERICA WHITE CEMENT MARKET VALUE, BY COUNTRY, 2018–2025($MILLION)
TABLE 111.    LATIN AMERICA WHITE CEMENT MARKET VOLUME, BY COUNTRY, 2018–2025(KILOTONS)
TABLE 112.    BRAZIL WHITE CEMENT MARKET REVENUE, BY TYPE 2017–2025($MILLION)
TABLE 113.    BRAZIL WHITE CEMENT MARKET VOLUME, BY TYPE 2017–2025(KILOTONS)
TABLE 114.    BRAZIL WHITE CEMENT MARKET VALUE, BY END-USE, 2017–2025($MILLION)
TABLE 115.    BRAZIL WHITE CEMENT MARKET VOLUME, BY END-USE, 2017–2025(KILOTONS)
TABLE 116.    REST OF LATIN AMERICA WHITE CEMENT MARKET REVENUE, BY TYPE 2017–2025($MILLION)
TABLE 117.    REST OF LATIN AMERICA WHITE CEMENT MARKET VOLUME, BY TYPE 2017–2025(KILOTONS)
TABLE 118.    REST OF LATIN AMERICA WHITE CEMENT MARKET VALUE, BY END-USE, 2017–2025($MILLION)
TABLE 119.    REST OF LATIN AMERICA WHITE CEMENT MARKET VOLUME, BY END-USE, 2017–2025(KILOTONS)
TABLE 120.    MEA WHITE CEMENT MARKET REVENUE, BY TYPE 2017–2025($MILLION)
TABLE 121.    MEA WHITE CEMENT MARKET VOLUME, BY TYPE 2017–2025(KILOTONS)
TABLE 122.    MEA WHITE CEMENT MARKET VALUE, BY END-USE, 2017–2025($MILLION)
TABLE 123.    MEA WHITE CEMENT MARKET VOLUME, BY END-USE, 2017–2025(KILOTONS)
TABLE 124.    MEA WHITE CEMENT MARKET VALUE, BY COUNTRY, 2018–2025($MILLION)
TABLE 125.    LAMEA WHITE CEMENT MARKET VOLUME, BY COUNTRY, 2018–2025(KILOTONS)
TABLE 126.    TURKEY WHITE CEMENT MARKET REVENUE, BY TYPE 2017–2025($MILLION)
TABLE 127.    TURKEY WHITE CEMENT MARKET VOLUME, BY TYPE 2017–2025(KILOTONS)
TABLE 128.    TURKEY WHITE CEMENT MARKET VALUE, BY END-USE, 2017–2025($MILLION)
TABLE 129.    TURKEY WHITE CEMENT MARKET VOLUME, BY END-USE, 2017–2025(KILOTONS)
TABLE 130.    UAE WHITE CEMENT MARKET REVENUE, BY TYPE 2017–2025($MILLION)
TABLE 131.    UAE WHITE CEMENT MARKET VOLUME, BY TYPE 2017–2025(KILOTONS)
TABLE 132.    UAE WHITE CEMENT MARKET VALUE, BY END-USE, 2017–2025($MILLION)
TABLE 133.    UAE WHITE CEMENT MARKET VOLUME, BY END-USE, 2017–2025(KILOTONS)
TABLE 134.    SAUDI ARABIA WHITE CEMENT MARKET REVENUE, BY TYPE 2017–2025($MILLION)
TABLE 135.    SAUDI ARABIA WHITE CEMENT MARKET VOLUME, BY TYPE 2017–2025(KILOTONS)
TABLE 136.    SAUDI ARABIA WHITE CEMENT MARKET VALUE, BY END-USE, 2017–2025($MILLION)
TABLE 137.    SAUDI ARABIA WHITE CEMENT MARKET VOLUME, BY END-USE, 2017–2025(KILOTONS)
TABLE 138.    IRAN WHITE CEMENT MARKET REVENUE, BY TYPE 2017–2025($MILLION)
TABLE 139.    IRAN WHITE CEMENT MARKET VOLUME, BY TYPE 2017–2025(KILOTONS)
TABLE 140.    IRAN WHITE CEMENT MARKET VALUE, BY END-USE, 2017–2025($MILLION)
TABLE 141.    IRAN WHITE CEMENT MARKET VOLUME, BY END-USE, 2017–2025(KILOTONS)
TABLE 142.    SOUTH AFRICA WHITE CEMENT MARKET REVENUE, BY TYPE 2017–2025($MILLION)
TABLE 143.    SOUTH AFRICA WHITE CEMENT MARKET VOLUME, BY TYPE 2017–2025(KILOTONS)
TABLE 144.    SOUTH AFRICA WHITE CEMENT MARKET VALUE, BY END-USE, 2017–2025($MILLION)
TABLE 145.    SOUTH AFRICA WHITE CEMENT MARKET VOLUME, BY END-USE, 2017–2025(KILOTONS)
TABLE 146.    REST OF MEA WHITE CEMENT MARKET REVENUE, BY TYPE 2017–2025($MILLION)
TABLE 147.    REST OF MEA WHITE CEMENT MARKET VOLUME, BY TYPE 2017–2025(KILOTONS)
TABLE 148.    REST OF MEA WHITE CEMENT MARKET VALUE, BY END-USE, 2017–2025($MILLION)
TABLE 149.    REST OF MEA WHITE CEMENT MARKET VOLUME, BY END-USE, 2017–2025(KILOTONS)
TABLE 150.    ADANA CIMENTO SANAYI T.A.S. COMPANY SNAPSHOT
TABLE 151.    ADANA CIMENTO SANAYI T.A.S: OPERATING SEGMENTS
TABLE 152.    ADANA CIMENTO SANAYI T.A.S.: PRODUCT PORTFOLIO
TABLE 153.    CEMENTIR HOLDING SPA: COMPANY SNAPSHOT
TABLE 154.    CEMENTIR HOLDING SPA: OPERATING SEGMENTS
TABLE 155.    CEMENTIR HOLDING SPA: KEY STRATEGIES AND DEVELOPMENTS
TABLE 156.    CEMENTOS PORTLAND VALDERRIVAS S.A.: OPERATING SEGMENTS
TABLE 157.    CEMEX S.A.B. DE C.V. COMPANY SNAPSHOT
TABLE 158.    CEMEX S.A.B. DE C.V.: OPERATING SEGMENTS
TABLE 159.    CEMEX S.A.B. DE C.V.: KEY STRATEGIES AND DEVELOPMENTS
TABLE 160.    CIMSA CEMENT INDUSTRY AND TRADE INC.: COMPANY SNAPSHOT
TABLE 161.    CIMSA CEMENT INDUSTRY AND TRADE INC.: OPERATING SEGMENTS
TABLE 162.    CIMSA CEMENT INDUSTRY AND TRADE INC.: PRODUCT PORTFOLIO
TABLE 163.    CIMSA CEMENT INDUSTRY AND TRADE INC.: KEY STRATEGIES AND DEVELOPMENTS
TABLE 164.    DYCKERHOFF GMBH: COMPANY SNAPSHOT
TABLE 165.    DYCKERHOFF GMBH: OPERATING SEGMENTS
TABLE 166.    DYCKERHOFF GMBH: PRODUCT PORTFOLIO
TABLE 167.    DYCKERHOFF GMBH: KEY STRATEGIES AND DEVELOPMENTS
TABLE 168.    FARS & KHUZESTAN CEMENT CO.: COMPANY SNAPSHOT
TABLE 169.    FARS & KHUZESTAN CEMENT CO.: PRODUCT PORTFOLIO
TABLE 170.    FEDERAL WHITE CEMENT, LTD.: COMPANY SNAPSHOT
TABLE 171.    FEDERAL WHITE CEMENT, LTD.: PRODUCT PORTFOLIO
TABLE 172.    HEIDELBERGCEMENT: COMPANY SNAPSHOT
TABLE 173.    HEIDELBERGCEMENT: PRODUCT PORTFOLIO
TABLE 174.    HEIDELBERGCEMENT: KEY STRATEGIES AND DEVLOPMENTS
TABLE 175.    J.K. CEMENT LTD: COMPANY SNAPSHOT
TABLE 176.    J.K. CEMENT LTD: PRODUCT PORTFOLIO
TABLE 177.    LAFARGEHOLCIM LTD.: COMPANY SNAPSHOT
TABLE 178.    LAFARGEHOLCIM LTD.: OPERATING SEGMENTS
TABLE 179.    LAFARGEHOLCIM LTD.: PRODUCT PORTFOLIO
TABLE 180.    LAFARGEHOLCIM LTD.: KEY STRATEGIES AND DEVELOPMENTS
TABLE 181.    NEYRIZ WHITE CEMENT COMPANY: COMPANY SNAPSHOT
TABLE 182.    NEYRIZ WHITE CEMENT COMPANY: PRODUCT PORTFOLIO
TABLE 183.    RAS AL KHAIMAH CO. FOR WHITE CEMENT & CONSTRUCTION MATERIALS: COMPANY SNAPSHOT
TABLE 184.    RAS AL KHAIMAH CO. FOR WHITE CEMENT & CONSTRUCTION MATERIALS: OPERATING SEGMENTS
TABLE 185.    RAS AL KHAIMAH CO. FOR WHITE CEMENT & CONSTRUCTION MATERIALS: PRODUCT PORTFOLIO
TABLE 186.    RAS AL KHAIMAH CO.: KEY STRATEGIES AND DEVELOPMENTS
TABLE 187.    ROYAL EL MINYA CEMENT: COMPANY SNAPSHOT
TABLE 188.    ROYAL EL MINYA CEMENT: PRODUCT PORTFOLIO
TABLE 189.    ROYAL WHITE CEMENT INC.: COMPANY SNAPSHOT
TABLE 190.    ROYAL WHITE CEMENT INC.: PRODUCT PORTFOLIO
TABLE 191.    SAUDI WHITE CEMENT CO.: COMPANY SNAPSHOT
TABLE 192.    SAUDI WHITE CEMENT CO.: PRODUCT PORTFOLIO
TABLE 193.    SAUDI WHITE CEMENT CO.: KEY STRATEGIES AND DEVELOPMENTS
TABLE 194.    SAVEH CEMENT COMPANY: COMPANY SNAPSHOT
TABLE 195.    SAVEH CEMENT COMPANY: PRODUCT PORTFOLIO
TABLE 196.    SCG: COMPANY SNAPSHOT
TABLE 197.    SCG: OPERATING SEGMENTS
TABLE 198.    SCG: KEY STRATEGIES AND DEVELOPMENTS
TABLE 199.    SECIL: COMPANY SNAPSHOT
TABLE 200.    SECIL: PRODUCT PORFOLIO
TABLE 201.    SECIL: KEY STRATEGIES AND DEVELOPMENTS
TABLE 202.    ULTRATECH CEMENT LTD.: COMPANY SNAPSHOT
TABLE 203.    ULTRATECH CEMENT LTD.: OPERATING SEGMENTS
TABLE 204.    ULTRATECH CEMENT LTD.: PRODUCT PORTFOLIO
TABLE 205.    UNION CEMENT COMPANHY: COMPANY SNAPSHOT
TABLE 206.    UNION CEMENT COMPANY: PRODUCT PORTFOLIO

LIST OF FIGURES

FIGURE 01.    KEY MARKET SEGMENTS    
FIGURE 02.    TOP INVESTMENT POCKETS    
FIGURE 03.    TOP WINNING STRATEGIES, BY YEAR, 2015–2019    
FIGURE 04.    TOP WINNING STRATEGIES, BY DEVELOPMENT, 2017–2019 (%)    
FIGURE 05.    TOP WINNING STRATEGIES, BY COMPANY, 2017–2019    
FIGURE 06.    MODERATE BARGAINING POWER OF SUPPLIERS    
FIGURE 07.    HIGH THREAT OF NEW ENTRANTS    
FIGURE 08.    MODERATE THREAT OF SUBSTITUTES    
FIGURE 09.    HIGH INTENSITY OF RIVALRY    
FIGURE 10.    LOW BARGAINING POWER OF BUYERS    
FIGURE 11.    MARKET PLAYER POSITIONING, 2018    
FIGURE 12.    MARKET SHARE ANALYSIS OF INDIAN PLAYERS, 2018    
FIGURE 13.    INDIAN END-USE INDUSTRY WISE CONSUMPTION OF WHITE CEMENT, 2018    
FIGURE 14.    SUPPLY CHAIN OF WHITE CEMENT BUSINESS    
FIGURE 15.    MANUFACTURING PROCESS    
FIGURE 16.    COMPARATIVE SHARE ANALYSIS OF WHITE PORTLAND CEMENT WHITE CEMENT MARKET, BY COUNTRY,  2017 & 2025 (%)    
FIGURE 17.    COMPARATIVE SHARE ANALYSIS OF WHITE MASONRY CEMENT MARKET, BY COUNTRY, 2017 & 2025 (%)    
FIGURE 18.    COMPARATIVE SHARE ANALYSIS OF OTHERS WHITE CEMENT MARKET, BY COUNTRY, 2017 & 2025 (%)    
FIGURE 19.    COMPARATIVE SHARE ANALYSIS OF WHITE CEMENT MARKET FOR RESIDENTIAL SEGMENT, BY COUNTRY,  2017 & 2025 (%)    
FIGURE 20.    COMPARATIVE SHARE ANALYSIS OF COMMERCIAL RECYCLED MARKET, BY COUNTRY, 2017 & 2025 (%)    
FIGURE 21.    COMPARATIVE SHARE ANALYSIS OF INDUSTRIAL RECYCLED MARKET, BY COUNTRY, 2017 & 2025 (%)    
FIGURE 22.    ADANA CIMENTO SANAYI T.A.S.: REVENUE, 2016–2018 ($MILLION)    
FIGURE 23.    CEMENTIR HOLDING SPA: REVENUE, 2016–2018 ($MILLION)    
FIGURE 24.    CEMENTIR HOLDING SPA: REVENUE SHARE BY SEGMENT 2018 (%)    
FIGURE 25.    CEMENTIR HOLDING SPA REVENUE SHARE BY REGION 2018 (%)    
FIGURE 26.    CEMENTOS PORTLAND VALDERRIVAS S.A.: REVENUE, 2015–2017 ($MILLION)    
FIGURE 27.    CEMEX S.A.B. DE C.V.: REVENUE, 2016–2018 ($MILLION)    
FIGURE 28.    CEMEX S.A.B. DE C.V.: REVENUE SHARE BY SEGMENT 2018 (%)    
FIGURE 29.    CEMEX S.A.B. DE C.V.: REVENUE SHARE BY REGION 2018 (%)    
FIGURE 30.    CIMSA CEMENT INDUSTRY AND TRADE INC.: REVENUE, 2016–2018 ($MILLION)    
FIGURE 31.    CIMSA CEMENT INDUSTRY AND TRADE INC.: REVENUE SHARE BY SEGMENT, 2018    
FIGURE 32.    DYCKERHOFF GMBH: REVENUE, 2015–2017 ($MILLION)    
FIGURE 33.    HEIDELBERGCEMENT: REVENUE, 2016–2018 ($MILLION)    
FIGURE 34.    HEIDELBERGCEMENT: REVENUE SHARE BY REGION 2018 (%)    
FIGURE 35.    J.K. CEMENT LTD: REVENUE, 2016–2018 ($MILLION)    
FIGURE 36.    J.K. CEMENT LTD: REVENUE SHARE BY SEGMENT 2018 (%)    
FIGURE 37.    LAFARGEHOLCIM LTD.: REVENUE, 2016–2018 ($MILLION)    
FIGURE 38.    LAFARGEHOLCIM LTD. REVENUE SHARE BY SEGMENT, 2018    
FIGURE 39.    LAFARGEHOLCIM LTD. REVENUE SHARE BY REGION, 2018    
FIGURE 40.    RAS AL KHAIMAH CO.: REVENUE, 2016–2018 ($MILLION)    
FIGURE 41.    SAUDI WHITE CEMENT CO.: REVENUE, 2015–2017 ($MILLION)    
FIGURE 42.    SAUDI WHITE CEMENT CO.: REVENUE SHARE BY SEGMENT, 2017    
FIGURE 43.    SCG.: REVENUE, 2016–2018 ($MILLION)    
FIGURE 44.    SCG.: REVENUE SHARE BY SEGMENT 2018 (%)    
FIGURE 45.    SECIL: REVENUE, 2015–2017 ($MILLION)    
FIGURE 46.    SECIL: REVENUE SHARE BY REGION, 2017 ($MILLION)    
FIGURE 47.    ULTRATECH CEMENT LTD.: REVENUE, 2016–2018 ($MILLION)


White cement is similar to ordinary, gray Portland cement except for its high degree of whiteness. For obtaining the white color, substantial modification methods are required during manufacturing. The content of iron oxide and iron sulfate in limestone is kept as low as possible as each 0.1% increase in iron oxide reduces cement reflectivity by 2.5%, thereby producing darker cement. This cement is majorly manufactured with low iron containing raw material used for architectural decorative purposes. The most important property of white cement is its color. It is also manufactured in strength classes of 325, 400, and 475. It exhibits superior aesthetic appearance and fineness, which improve its durability and strength as compared to gray cement. Furthermore, white cement finds enhanced use in the production of architectural and decorative concrete, which is further utilized in applications such as terrazzo tiles, paints, pavers, as well as in pre-fabricated products such as artificial walls and tile adhesives.

White cement finds applications in construction projects and decorative works. It is similar to gray cement in all aspects except for its white color, strength, and fineness. In addition, white cement is often used as a premium product for mass construction activities. The Asia-Pacific white cement market offers lucrative opportunities for key manufacturers, owing to the presence of a global key players such as JK Cement, Ambuja Cement, and Birla White Cement. JK Cement is one of the known brands in the white cement market in India as well as across the world. JK Cement (India) was one of the world's third-largest producers of white cement in 2014. It has two plants in Rajasthan State with production capacity of 400,000t/year. JK Cement also operates a dual-stream 600,000t/year white cement capacity plant in the UAE. It exports white cement to 24 countries including Angola, Australia, New Zealand, and Qatar. High economic growth rate, increase in purchasing power, and R&D activities for the suitability of white cement in plaster applications are expected to fuel the market growth.

PURCHASE OPTIONS

Call or Email us

U.S.-Canada Toll-free: +1-800-792-5285
Int'l : +1-503-894-6022
Europe : +44-845-528-1300
Email : help@alliedmarketresearch.com

Looking for Customization?

 Customization Request

Have a Question?

 Speak with Analyst

Any Confusion?

 Inquire Before Buying

Have a glance of the Report

  Request Sample

Purchase Full Report of
White Cement Market

Start reading instantly.
This Report and over 66,783+ more Reports, Available with Avenue Library. T&C*.

  • Online Only
  • $3,456
  • Online cloud access only
  • Restricted print, copy, paste & download
  • Read only
  • Free industry update
    (Within 180 days)
  • Free report update in next update cycle
    (Jun 2020 - Jun 2021)
  • Data Pack
  • $3,840
  • Restricted to one authorized user
  • One print only
  • Available in
    Excel
  • Free industry update
    (Within 180 days)
  •   Free report update in next update cycle
    (Jun 2020 - Jun 2021)
  • Single User
  • $5,769
  • Restricted to one authorized user
  • One print only
  • Available in
    PDF
  • Free industry update
    (Within 180 days)
  •   Free report update in next update cycle
    (Jun 2020 - Jun 2021)
  • Five Users
  • $6,450
  • Limited to five authorized users
  • Print upto five copies
  • Available in
    PDF
  • Free industry update
    (Within 180 days)
  •   Free report update in next update cycle
    (Jun 2020 - Jun 2021)
  • Enterprise
    License/PDF

  • $10,995
  • Unlimited
    within
    company/enterprise
  • Available in Excel & PDF
  • Free industry update
    (Within 180 days)
  •   Free report update in next update cycle
    (Jun 2020 - Jun 2021)
  • Library
    Membership

  • $999 $ 1,175
    Per User/ Per month/ Billed annually
  • Published Content
    E-access
  • Company Profiles
    E-access
  • Newly Added Content Access
  • 10 PDF
    Downloads
  • 5 Excel Data
    Pack Downloads
  • 250 Company Profiles PDF Downloads
  • Buy Now

*Taxes/Fees, if applicable will be added during checkout. All prices in USD

RELATED REPORTS
 

Why Allied Market Research?


Infallible Methodology

To ensure high-level data integrity, accurate analysis, and impeccable forecasts

Analyst Support

For complete satisfaction

Customization

On-demand customization of scope of the report to exactly meet your needs

TARGETED MARKET VIEW

Targeted market view to provide pertinent information and save time of readers

Get fresh content delivered

Get insights on topics that are crucial for your business. Stay abreast of your interest areas.

Get Industry Data Alerts

Why Allied Market Research?

Infallible Methodology

To ensure high-level data integrity, accurate analysis, and impeccable forecasts

Analyst Support

For complete satisfaction

Customization

On-demand customization of scope of the report to exactly meet your needs

TARGETED MARKET VIEW

Targeted market view to provide pertinent information and save time of readers