
Wind Turbine Market Overview
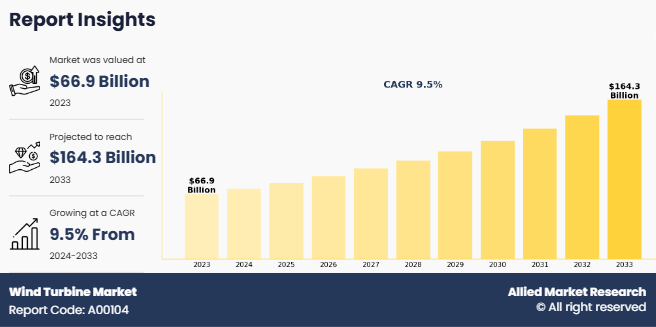
The global Wind Turbine Market size was valued at USD 66.9 billion in 2023, and is projected to reach USD 164.3 billion by 2033, growing at a CAGR of 9.5% from 2024 to 2033. Rising demand for renewable energy, driven by global efforts to reduce greenhouse gas emissions, is boosting market growth. Governments are shifting to cleaner sources like wind power to combat climate change and its environmental impacts.
Key Market Trend & Insights
- Horizontal axis segment led revenue with over half the market share in 2023.
- Onshore installation dominated, accounting for more than half of market share in 2023.
- Rotor blade component expected to grow at a CAGR of 8.8% during the forecast period.
- Utility application segment projected to expand at a CAGR of 9.5%.
- Asia-Pacific region is the fastest-growing, with a CAGR of 9.6% forecasted.
Market Size & Forecast
- 2033 Projected Market Size: USD 164.3 billion
- 2023 Market Size: USD 66.9 billion
- Compound Annual Growth Rate (CAGR) (2024-2033): 9.5%
Introduction
Wind turbines play a critical role in addressing climate change. By generating electricity without burning fossil fuels, they help reduce carbon dioxide emissions, which are a major contributor to global warming. The widespread adoption of wind energy significantly lowers the carbon footprint of electricity generation, thereby promoting a cleaner and more sustainable energy system. In addition, the operation of wind turbines produces no air pollutants, making them a clean energy source that improves air quality and public health.
In agricultural and rural areas, wind turbines provide an additional source of income for landowners. Farmers and ranchers lease their land to wind energy companies, thus generating revenue without significantly impacting their primary agricultural activities. The presence of wind turbines also stimulates local economies by creating jobs in construction, maintenance, and operations. Furthermore, community wind projects, where local residents have a stake in the ownership and profits of wind turbines, are increasingly popular and enhance community resilience and economic development.
In remote and off-grid locations, wind turbines provide a reliable and independent source of power. Communities, research stations, and installations in isolated areas often rely on diesel generators, which are costly and polluting. Wind turbines, possibly combined with other renewable energy sources such as solar panels, offer a sustainable alternative, thus reducing reliance on fossil fuels and enhancing energy security. These off-grid systems are particularly valuable in developing countries, where access to electricity is limited, thus contributing to improved quality of life and economic development.
Key Takeaways
- The wind turbine market study covers 20 countries. The research includes a segment analysis of each country in terms of value for the projected period.
- The study integrated high-quality data, professional opinions and analysis, and critical independent perspectives. The research approach is intended to provide a balanced view of global wind turbine markets and to assist stakeholders in making educated decisions in order to achieve their most ambitious growth objectives.
- Over 3,700 product literature, annual reports, industry statements, and other comparable materials from major industry participants were reviewed to gain a better understanding of the market.
- The key players in the wind turbine market share are ENERCON Global GmbH, Siemens Gamesa Renewable Energy, S.A.U., GE VERNOVA, Goldwind Americas, Guodian United Power Technology Co., Ltd., Mingyang Smart Energy Group Co., Ltd, Sinovel Wind Group Co., Ltd., Senvion India Pvt. Ltd., Suzlon Energy Limited, and Vestas. They have adopted strategies such as acquisition, product launch, merger, and expansion to gain an edge in the market.
Market Dynamics
An increase in demand for renewable energy is expected to drive the growth of the market. The increasing demand for renewable energy is driven significantly by a global emphasis on reducing greenhouse gas (GHG) emissions. As climate change becomes an urgent global issue, countries, organizations, and industries are prioritizing sustainable practices to mitigate its impacts. The burning of fossil fuels for energy production remains the largest contributor to GHG emissions, leading to severe environmental consequences, including global warming, rise in sea levels, and extreme weather events. To address these challenges, governments worldwide are transitioning toward renewable energy sources like wind power, which produce minimal emissions and provide a cleaner, more sustainable alternative to conventional energy generation. In 2024, Sweden's wind power production reached a record high, surpassing nuclear energy for the first time during a quarter, with wind accounting for 25% of total electricity generation for the year. For example, the European Green Deal has set a target of installing 450 GW of offshore wind capacity by 2050, highlighting the pivotal role wind energy plays in meeting these ambitious climate goals. In 2024, the UK recorded its cleanest electricity supply, with wind becoming the largest source, contributing 30% to the energy mix and surpassing gas-fired plants.
However, environmental and social concerns is expected to hamper the growth of wind turbine market growth in future. Wind energy, despite its environmental benefits, poses certain challenges to local ecosystems and communities that must be addressed to ensure sustainable development. One significant concern is the potential impact on local ecosystems and bird populations. Wind turbines, particularly in large wind farms, can disrupt the habitats of wildlife, including birds and bats. Collisions with turbine blades can result in fatalities for some species, especially in areas where migratory paths or nesting grounds coincide with wind farm locations. Another environmental consideration is the effect of wind turbines on the surrounding landscape and ecosystem balance. The construction and maintenance of wind farms can lead to soil disruption, changes in water drainage, and vegetation loss. Offshore wind farms can similarly affect marine life during installation and operation, such as by generating underwater noise that disturbs aquatic species. However, proper environmental assessments and innovative practices, such as using quieter installation techniques or creating artificial reefs around turbine foundations, are helping to minimize these effects. Approximately 2.4% of turbine blades are replaced annually, raising concerns about waste management as these components are often not recyclable. Also, the U.S. Department of Energy's Wind Energy Technologies Office (WETO) has collaborated with federal agencies to develop guidelines aimed at minimizing the impact of wind energy projects on wildlife, including the Land-Based Wind Energy Guidelines and Eagle Conservation Plan Guidance.
Segments Overview
The wind turbine market is segmented into axis type, installation, component, application, and region. By axis type, the market is bifurcated into horizontal and vertical. As per installation, the market is categorized into onshore, and offshore. On the basis of component, the market is divided into rotator blade, gearbox, generator, nacelle, and others. On the basis of application, the market is segmented into industrial, commercial, residential, and utility. Region-wise, the market is analyzed across North America, Europe, Asia-Pacific, and LAMEA.

On the basis of axis type, the horizontal segment was the largest revenue generator in 2023 and is anticipated to grow at a CAGR of 9.5% during the forecast period. Horizontal Axis Wind Turbines (HAWTs) are the most widely used type of wind turbines in the world, primarily due to their efficiency and maturity as a technology. These turbines are characterized by a main rotor shaft and blades that are aligned horizontally to the ground. Their design allows them to capture wind energy effectively when the wind flows perpendicular to their blades. This configuration makes HAWTs particularly suitable for large-scale wind farms, which are often installed in areas with consistent wind patterns, such as plains, coastal regions, and offshore locations.

By installation, the onshore segment dominated the wind turbine market in 2023. Onshore wind turbines are among the most widely used renewable energy technologies harnessing the power of wind to generate electricity on land. These turbines are typically installed in open areas such as plains, valleys, and coastal regions where wind speeds are consistently strong and unobstructed. The primary advantage of onshore wind turbines is their accessibility and cost-effectiveness compared to offshore counterparts. The installation, maintenance, and grid connection of onshore turbines are relatively straightforward and less expensive, making them an attractive option for governments and private sectors aiming to meet renewable energy targets.

By component, the rotator blade segment dominated the wind turbine market in 2023. Wind turbines are designed to harness wind energy and convert it into electrical power. A critical component of this energy conversion process is the rotator blade, which plays a pivotal role in capturing kinetic energy from the wind. The shape of wind turbine blades is optimized for aerodynamic efficiency. The blades are typically long and slender, with a design that allows them to catch and redirect wind effectively. The curvature of the blade, known as its airfoil, is similar to that of an airplane wing. This design ensures a lift force is generated when wind flows over the blade surface, causing the rotor to spin. The efficiency of the rotator blades directly impacts the amount of energy the turbine can generate, making blade design a crucial aspect of wind turbine technology.

By application, the utility segment dominated the wind turbine market in 2023. Utility-scale wind turbines are typically installed in wind farms, which can range from a few dozen to hundreds of turbines. These wind farms are strategically located in areas with consistent and strong wind resources, such as plains, coastal regions, and offshore locations, to maximize energy production. In utility applications, wind turbines convert kinetic energy from wind into electrical energy through an efficient process involving rotor blades, a gearbox, and a generator. The electricity generated is then transmitted to power grids, where it can be distributed to meet residential, commercial, and industrial energy demands. The scale of utility wind turbines often surpasses smaller turbines, with capacities ranging from 2 MW to over 12 MW for offshore turbines. These high-capacity systems are designed to operate continuously, thus contributing to a stable and reliable energy supply.

Why is Asia-Pacific Seen as an Opportune Region?
Asia-Pacific dominated the wind turbine market in 2023. The Asia-Pacific region has emerged as a significant player in the wind energy sector due to its commitment to renewable energy and sustainability goals. Countries across the region are harnessing wind energy to reduce dependency on fossil fuels, combat climate change, and ensure energy security. China leads the global wind energy market and dominates wind turbine installations in the Asia-Pacific region. China, leveraging favorable government policies and significant investments, has unveiled the world's largest floating wind turbine, the "Flying V," officially named Ocean X. Developed by MingYang Smart Energy, this cutting-edge turbine is engineered to withstand hurricanes and is capable of generating 54,000 megawatt-hours (MWh) of electricity annually—sufficient to power more than 30,000 households.
Which are the Top Wind Turbine companies
The following are the leading companies in the market. These players have adopted various strategies to increase their market penetration and strengthen their position in the wind turbine industry.
- Arkema
- ENERCON Global GmbH
- Siemens Gamesa Renewable Energy, S.A.U.
- GE VERNOVA
- Goldwind Americas
- Guodian United Power Technology Co., Ltd.
- Mingyang Smart Energy Group Co., Ltd.
- Sinovel Wind Group Co., Ltd.
- Senvion India Pvt. Ltd.
- Suzlon Energy Limited
- Vestas
What are the latest developments in the wind turbine industry?
In 2022, Danish wind turbine manufacturer Vestas ceased operations in Russia due to Western sanctions following the Ukraine conflict. By 2023, Vestas had fully exited the Russian market, leaving behind its assets, including a blade manufacturing plant in Ulyanovsk. In December 2024, Russia's state nuclear corporation, Rosatom, launched a wind turbine blade factory at this former Vestas site, aiming to produce up to 450 blades annually and potentially export them to projects like a planned wind farm in Kyrgyzstan.
As of November 2024, India's cumulative wind power capacity reached 47.96 GW. The Ministry of New and Renewable Energy (MNRE) reported a total of 74.44 GW when including projects in the pipeline, indicating ongoing expansion in the sector. The Indian government has set an ambitious target of achieving 140 GW of wind energy capacity by 2030, contributing to a broader goal of 500 GW from renewable sources.
India has established itself as a hub for wind turbine manufacturing, with an annual production capacity of 10-12 GW. However, due to a slowdown in the domestic market in recent years, this capacity has been underutilized. Recognizing the opportunity, the Global Wind Energy Council (GWEC) and MEC Intelligence (MEC+) reported in August 2023 that India could become a key player in the global wind energy supply chain. The report projected that India would add 22 GW of wind energy capacity over the next five years, with the potential to reach 26 GW under an accelerated growth scenario.
In 2023, Chinese companies dominated the global wind turbine market, with Goldwind leading for the second consecutive year by installing 16.3 GW of capacity. Envision followed with 14.1 GW, marking its best performance to date. Notably, four Chinese manufacturers secured positions in the global top five, reflecting China's substantial contribution of 65% to global wind capacity that year.
As of December 2024, Enercon GmbH, headquartered in Aurich, Germany, maintained its position as a leading wind turbine manufacturer. The company continued its global operations with production facilities in multiple countries, including Germany, Brazil, India, Canada, Turkey, and Portugal. Enercon's gearless wind turbine technology, pioneered in 1993 with the E-40 model, remained a significant aspect of its product line.
Key Benefits For Stakeholders
- This report provides a quantitative analysis of the wind turbine market forecast segments, current trends, estimations, and dynamics of the wind turbine market analysis from 2023 to 2033 to identify the prevailing wind turbine market opportunities.
- The market research is offered along with information related to key drivers, restraints, and opportunities.
- Porter's five forces analysis highlights the potency of buyers and suppliers to enable stakeholders make profit-oriented business decisions and strengthen their supplier-buyer network.
- In-depth analysis of the wind turbine market segmentation assists to determine the prevailing market opportunities.
- Major countries in each region are mapped according to their revenue contribution to the global market.
- Market player positioning facilitates benchmarking and provides a clear understanding of the present position of the market players.
- The report includes the analysis of the regional as well as global wind turbine market trends, key players, market segments, application areas, and market growth strategies.
Wind Turbine Market Report Highlights
| Aspects | Details |
| Market Size By 2033 | USD 164.3 billion |
| Growth Rate | CAGR of 9.5% |
| Forecast period | 2023 - 2033 |
| Report Pages | 321 |
| By Axis Type |
|
| By Installation |
|
| By Component |
|
| By Application |
|
| By Region |
|
| Key Market Players | ENERCON Global GmbH, Goldwind Science & Technology Co., Ltd., Vestas, GE Vernova, Sinovel Wind Group Co., Ltd., Suzlon Energy Limited, Senvion India Pvt. Ltd., Siemens Gamesa Renewable Energy, S.A.U., Mingyang Smart Energy Group Co., Ltd., Guodian United Power Technology Co.,Ltd |
Analyst Review
According to the opinions of various CXOs of leading companies, the wind turbine market is expected to witness significant growth in the upcoming years. An increase in demand for renewable energy is expected to drive the growth of the market. The growing demand for renewable energy is largely driven by the need to reduce greenhouse gas (GHG) emissions in response to climate change. The burning of fossil fuels for energy production is the primary source of GHG emissions, which contributes to global warming, rise in sea levels, and extreme weather events. To combat these issues, countries and industries are increasingly shifting to cleaner, renewable energy sources such as wind power. For instance, in 2024, Sweden set a record in wind power production, surpassing nuclear energy for the first time in a quarter, with wind generating 25% of the country’s total electricity.
However, environmental and social concerns are expected to hamper the growth of the market. Wind energy offers environmental benefits, but it also presents challenges for local ecosystems and communities. A primary concern is its impact on wildlife, particularly birds and bats, which may collide with turbine blades, especially in areas along migratory paths or near nesting sites. In addition, the construction of wind farms can disrupt local habitats, including soil disturbance, water drainage changes, and vegetation loss. Offshore wind farms may affect marine life through underwater noise. However, effective environmental assessments and innovative practices, like quieter installation techniques and artificial reefs around turbine foundations, are being employed to mitigate these impacts.
The key players operating in the wind turbine market include ENERCON Global GmbH, Siemens Gamesa Renewable Energy, S.A.U., GE VERNOVA, Goldwind Americas, Guodian United Power Technology Co., Ltd., Mingyang Smart Energy Group Co., Ltd., Sinovel Wind Group Co., Ltd, Senvion India Pvt. Ltd, Suzlon Energy Limited, and Vestas.
The global wind turbine market was valued at $66.9 billion in 2023, and is projected to reach $164.3 billion by 2033, growing at a CAGR of 9.5% from 2024 to 2033.
Asia-Pacific is the largest regional market for wind turbine.
Utility is the leading application of wind turbine market.
Increase in digitalization and smart turbines are the upcoming trends of Wind Turbine Market in the globe.
Loading Table Of Content...
Loading Research Methodology...

