
Window Blinds Market Research, 2033
Market Introduction and Definition
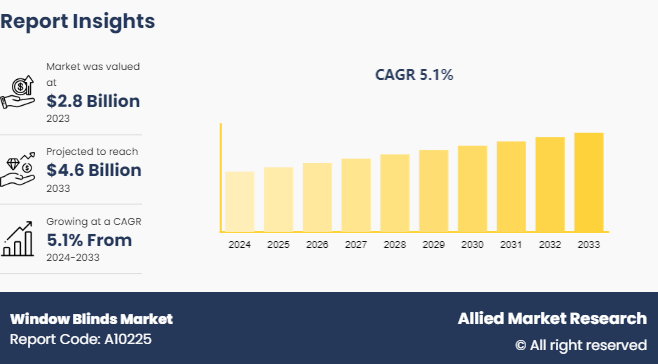
The global window blinds market size was valued at $2.8 billion in 2023, and is projected to reach $4.6 billion by 2033, growing at a CAGR of 5.1% from 2024 to 2033. The term "window blinds market" describes a global market that is dedicated to manufacturing, supplying, and marketing a range of window coverings, such as Roman, roller, Venetian, and vertical blinds. These blinds are used in commercial, industrial, and residential settings to regulate light, maintain privacy, and improve visual appeal. A vast array of materials, including wood, fabric, metal, and PVC, are available in the market to accommodate different preferences and price ranges. Rise in urbanization, home automation trends, and the need for energy-efficient window solutions are driving window blinds market demand. The market benefits from improvements in smart blinds technology, which allows for smartphone remote control and integration with home automation systems.
Key Takeaways
The window blinds market study covers 20 countries. The research includes a segment analysis of each country in terms of value for the projected period.
More than 1, 500 product literature, industry releases, annual reports, and other such documents of major window blinds industry participants along with authentic industry journals, trade associations' releases, and government websites have been reviewed for generating high-value industry insights.
The study integrated high-quality data, professional opinions and analysis, and critical independent perspectives. The research approach is intended to provide a balanced view of global market and to assist stakeholders in making educated decisions in order to achieve their most ambitious growth objectives.
Key market dynamics
The growing emphasis on home improvement and interior design is one of the main factors. Customers have become more particular about design and are looking for blinds that improve the visual appeal of their homes in addition to offering useful benefits such as privacy and light control. This trend is particularly noticeable in the residential sectors, where there is an increasing need for creative and personalized blinds that go well with contemporary and minimalist interior decor.
Furthermore, the development of the market is also significantly influenced by technological improvements. The industry has seen a change with the introduction of smart blinds that are paired with Internet of Things technology. With the use of voice-activated devices or smartphones, customers can operate these blinds remotely, providing convenience and energy savings. In both home and commercial settings, automated window coverings which may change in response to light and temperature sensors are becoming more popular.
The window blinds market?is also influenced by environmental factors. Demand for energy-efficient blinds has increased as a result of increased awareness of energy conservation, especially in areas with severe weather. Consumers who care about the environment are becoming more attracted to blinds that can?control indoor temperature and save energy by lowering the need for air conditioning and heating.
The market does, however, encounter challenges, such as volatile raw material prices, especially for components such as wood, aluminum, and synthetic textiles. Furthermore, manufacturers of premium and mid-range blinds are at risk by the availability of low-cost, mass-produced products from emerging nations.
The dynamics of the market are also influenced by regional preferences. For example, automated and energy-efficient blinds are in great demand in North America and Europe, while the Asia-Pacific region's market is fueled by increased urbanization, housing development, and rising disposable incomes. Thus, consumer preferences for design, smart technologies, environmental concerns, and regional trends all have an impact on the window blinds market.
Parent Market Overview of the Global Window Blinds Market
The?window coverings market, which also includes curtains, shades, shutters, and other related products, is the?parent?market of the?window blinds market. The market serves the commercial, industrial, and residential sectors and is driven by the growing need for visually appealing and energy-efficient interior solutions. Growth is being driven by factors such as rise in urbanization, home renovation trends, and increased awareness of automated, smart technologies. Metal, synthetic textiles, and wood are important components. Sustainable activities have an impact on the market as well, leading to a change in favor of energy- and eco-efficient designs. Innovations in smart home technology, safety rules, and customer preferences for adaptable, functional, and aesthetically pleasing window solutions in a variety of geographic areas, including?North America, Europe, and Asia-Pacific, all influence the parent market.

Market Segmentation
The window blinds market is segmented into product type, application, window pane operation, and region. On the basis of product type, the market is divided into horizontal, vertical, roman, roll-up, shutter, curtain, and others. On the basis of application, the market is bifurcated into commercial and residential. On the basis of window pane operation, the market is bifurcated into manually operated and electrically operated. Region-wise, the market is analyzed across North America, Europe, Asia-Pacific, and LAMEA.
Regional/Country Market Outlook
The growing need for interior design, energy efficiency, and home renovations is propelling the global window blinds industry rapid expansion. A significant market?share is owned by North America, with the U.S.?leading the way. Consumers in this region are progressively spending money on motorized and smart blinds that have automation and energy-saving capabilities. The demand for environmentally friendly materials, like bamboo and recycled fabric blinds, has increased as a result of the region's emphasis on sustainability.
Concerns regarding privacy and energy efficiency are becoming more prominent throughout Europe. Major markets include Germany, the UK, and France with the emergence of smart home technology impacting the adoption of automatic blinds. Aesthetic and multipurpose blinds that follow the latest trends in home design are also in high demand in the region. The window blinds market?is growing as a result of regulations that support energy-efficient construction and encourage the use of solar shading devices.
The rapid growth is anticipated in Asia-Pacific as a result of the region's growing urbanization, rising disposable income, and expanding residential and commercial buildings. Australia, Japan, China, and India are a few of the nations that significantly contribute. India's increasing construction activity further supports market expansion, while China's vast population and growing middle class?fuel significant demand. The demand for motorized and automated window blinds is being further stimulated by the growing awareness of energy conservation and the emergence of smart homes.
A growing middle class is driving home renovations and increasing demand for stylish yet functional window coverings in Latin American nations like Brazil and Mexico. Due to the growing need for energy-saving products in hot climates and the rising construction sector, Middle Eastern markets particularly the United Arab Emirates and Saudi Arabia are witnessing a growth in the adoption of high-end, luxurious blinds for residential and commercial spaces. Thus, the window blinds market is anticipated to be driven by the trends toward automation, sustainability, and aesthetic customization in all countries.
Industry Trends:
Major manufacturers are concentrating on smart home integration in July 2023, and they will have automatic window blinds that can be operated by voice commands or smartphones. The increasing need for energy efficiency and home automation driving the window blinds market growth.
In August 2023, brands began to create window blinds from sustainable resources due to growing consumer interest in eco-friendly materials. This development allowed green products to?gain market share.
As of June 2023, the Chinese market is rapidly becoming more urbanized, which is driving the demand for fashionable and useful window treatments in residential and commercial buildings. Innovative designs are being introduced by brands to satisfy contemporary aesthetics.
Energy-saving window blind demand increased in September 2023 as a result of the government's emphasis on energy efficiency and the introduction of products by manufacturers that improve insulation and lower energy expenses.
Competitive Landscape
The major players operating in the market for increasing their window blinds market share include Vertilux Corporation, Draper Inc., Bed Bath & Beyond Inc., Springs Window Fashions, LLC, Blinds.com, Legrand Group, Hunter Douglas N.V, Select Blinds Canada, Lafayette Venetian Blind Inc., and Royal Blinds LLC.
Recent Key Strategies and Developments
In April 2023, the innovative Invisible Window Blinds from English Blinds of Solihull are being introduced. The purpose of these blinds is to reduce their environmental effect and increase natural light. They provide the functionality of well-fitted?and concealed blinds with a smaller footprint and less expensive manufacturing.
In May 2023, a manufacturer of curtains and blinds, BIW Products, has expanded into the higher-end market with the introduction of smart blinds that can be connected to smart home systems. The company's 2023 revenue target is THB 200 million, with a sales rise of 65% expected. Demand for blinds that can be operated by smart home technology has increased as a result of the rising popularity of luxury real estate.
Key Benefits For Stakeholders
- This report provides a quantitative analysis of the market segments, current trends, estimations, and dynamics of the window blinds market analysis from 2024 to 2033 to identify the prevailing window blinds market opportunities.
- The market research is offered along with information related to key drivers, restraints, and opportunities.
- Porter's five forces analysis highlights the potency of buyers and suppliers to enable stakeholders make profit-oriented business decisions and strengthen their supplier-buyer network.
- In-depth analysis of the market segmentation assists to determine the prevailing market opportunities during the window blinds market forecast period.
- Major countries in each region are mapped according to their revenue contribution to the global market.
- Market player positioning facilitates benchmarking and provides a clear understanding of the present position of the market players.
- The report includes the analysis of the regional as well as global window blinds market trends, key players, market segments, application areas, and market growth strategies.
Window Blinds Market Report Highlights
| Aspects | Details |
| Market Size By 2033 | USD 4.6 Billion |
| Growth Rate | CAGR of 5.1% |
| Forecast period | 2024 - 2033 |
| Report Pages | 230 |
| By Product Type |
|
| By Application |
|
| By Window Pane Operation |
|
| By Region |
|
| Key Market Players | Lafayette Venetian Blind Inc., Hunter Douglas N.V, Draper Inc., Bed Bath & Beyond Inc, Legrand Group, Blinds.com, Springs Window Fashions, LLC, Royal Blinds LLC, Vertilux Corporation, Select Blinds Canada |
The global window blinds market was valued at $2.8 billion in 2023 and is estimated to reach $4.6 billion by 2033, exhibiting a CAGR of 5.1% from 2024 to 2033
The window blinds market registered a CAGR of 5.1% from 2024 to 2033.
The forecast period in the window blinds market report is from 2024 to 2033.
The top companies that hold the market share in the window blinds market include Vertilux Corporation, Draper Inc., Bed Bath & Beyond Inc., Springs Window Fashions, LLC, Blinds.com, and others.
The window blinds market report has 3 segments. The segments are product type, application, and window pane operation.
Loading Table Of Content...

