0
2020
Wine Production Machinery Market

Wine Production Machinery Market

by Type (Tanks & Fermenters, Crushing & Pressing Equipment, Temperature Control Equipment, Filtration Equipment, and Others):Global Opportunity Analysis and Industry Forecast, 2020-2027

Report Code: A06150
Apr 2020 | Pages: 160
Tables: 61
Charts: 52
  • Formats*:

  • pdf

    Single User License, Five User
    License & Enterprise User License

  • xls

    Data Pack Excel License

  • ppt

    It comes with the additional cost
    of $2500.00 contact sales.


COVID-19

Pandemic disrupted the entire world and affected many industries.

Get detailed COVID-19 impact analysis on the Wine Production Machinery Market

Request Now !

    
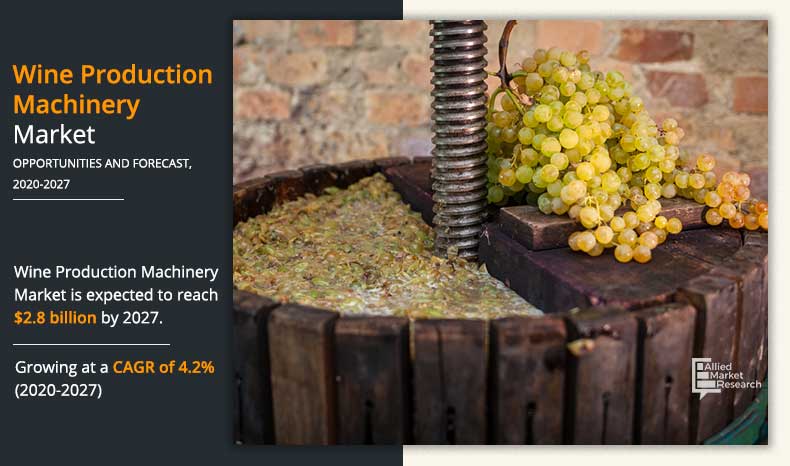
The wine production machinery market size was valued at $2.0 billion in 2019, and is estimated to reach $2.8 billion by 2027, registering a CAGR of 4.2% from 2020 to 2027. 

Wine production machinery is a set of equipment used for producing quality wines. There are various physical and chemical process that are carried out in the production of wine making using various equipment such as tanks & fermenters, crushing & pressing, temperature control equipment, filtration, among others. The equipment are selected based on the volume of wine processing and production plant. White grapes, black grapes, and such other sources are used as raw materials for the processing of wine.

Wine-Production-Machinery-Market-2019-2027123

Rise in number of wineries is one of the major factors that drives the wine production machinery market demand. Over past couple of years, there has been rise in demand for wine among consumers. Moreover, millennials are more experimental with their taste and perception and consumption habits about certain alcohol products such as wine, champagne, and beer, which differs from boomers, thus increase in consumption of wine offers untapped opportunities for key players to establish or expand their facilities. In addition, price of machinery used in wine making changes as per the capacity and winery size (cases), thus hinders the market in developing economies such as India and China, where consumers are price sensitive. Wine producers need to invest huge capital to buy machinery and other related equipment, which is likely to hamper the growth of the wine production machinery market. 

Rise in adoption of robotics and automation in wine making is likely to pose high opportunities for wine production machinery market manufactures. For instance, temperature controls, automated packaging, and winery motion automated equipment are used by Golan Heights winery in Northeast Israel. This adoption of automation is likely to create an opportunity for the market. 

According to Eurostats, around 35 to 40% of wineries and vineyards in European countries are more than 30 years old and around 50% of wineries and vineyards in European countries are between 10 and 30 years old. Replacement rates of equipment by category, which is around 15 to 20 years for major equipment such as fermenters, tanks, refrigeration systems, among others. With large number of old wineries in Europe, the replacement rate of the equipment, coupled with new installations is likely to grow significantly during the forecast period to cater to the domestic and export demand and is likely to drive the market growth.

Wine Production Machinery Market
By Type

Your browser does not support the canvas element.

The Temperature Control Equipment segment helds the major share of 38.75% in 2019

Get more information on this report : Request Sample Pages

The wine production machinery market is segmented on the basis of type and region. By type, it is categorized into tanks & fermenters, crushing & pressing equipment, temperature control equipment, filtration equipment, and others. Region wise, it is analyzed across North America (U.S., Canada, and Mexico), Europe (Germany, France, UK, Italy, Spain, and rest of Europe), Asia-Pacific (China, Japan, Australia, India, and rest of Asia-Pacific), and LAMEA (Brazil, South Africa, Chile, Argentina, and Rest of LAMEA).

According to wine production machinery market analysis, on the basis of type, the temperature control equipment segment accounted for the around half of the wine production machinery market share in 2019. Temperature control equipment are used for controlling equipment temperature in the wine making industry, as it increases product quality while allowing automation and need for less employees to monitor and control the equipment. Increase in development of temperature controller equipment due to its wide use in various sectors such as oil & gas, pharmaceuticals, food, and wine production industry has gained major traction in the wine production machinery market growth.

Region wise, Europe was the prominent market in 2019, which accounted for the maximum share in the market.This is attributed to the presence of huge market participants and rise inconsumption and production of wine in the region. Furthermore, growing consumption of wine is likely to promote winery growers to expand their manufacturing units, thus, drives the growth of the market. Moreover, France is gaining remarkable wine production machinery market share for various attributes such as high export, consumption, and production, which provides favorable market conditions and business environment for growth of the market. According to a report published by the government of France in 2018, France and Italy dominated the export market and are expected to continue theirdominance with 30% and 19% market share, respectively. 

The players in thewine production machinery market have adopted various development alstrategies to expand their market share, increase profitability, and remain competitive in the market. The key players profiled in this report include GW KENT, Agrovin, Della Toffola Pacific, Love Brewing Ltd, Northern Brewer, Adamark Airknife, Paul Mueller Company, Vitikit Limited, Tanium Machinery, and VeCriveller Group.

Key Benefits For Stakeholders

  • The report provides a quantitative analysis of the currentwine production machinery market trends, estimations, and dynamics of the market size from 2019 to 2027 to identify the prevailing opportunities.

  • Porter’s five forces analysis highlights the potency of buyers and suppliers to enable stakeholders to make profit-oriented business decisions and strengthen their supplier–buyer network.

  • In-depth analysis and the market size and segmentation assists to determine the prevailingwine production machinery market opportunities.

  • The major countries in each region are mapped according to their revenue contribution to the market. 

  • The market player positioning segment facilitates benchmarking and provides a clear understanding of the present position of the market players in the wine production machinery industry.

Wine Production Machinery Market Report Highlights

Aspects Details
By Type
  • Tanks & fermenters
  • Crushing & Pressing Equipment
  • Temperature Control Equipment
  • Filtration Equipment
  • Others
By Region
  • North America  (U.S., Canada, Mexico)
  • Europe  (Germany, UK, France, Italy, Spain, Rest of Europe)
  • Asia-Pacific  (China, India, Japan, Australia, Rest of Asia-Pacific)
  • LAMEA  (Brazil, South Africa, Chile, Argentina, Rest of LAMEA)
Key Market Players NORTHERN BREWER, GRAPEWORKS PTY LTD., CRIVELLER GROUP, ADAMARK AIR KNIFE SYSTEMS, VITIKIT LTD., G.W. KENT, INC., AGROVIN, DT PACIFIC PTY. LTD., LOVE BREWING LIMITED, PAUL MUELLER COMPANY, INC.
 

CHAPTER 1:INTRODUCTION

1.1.Report description
1.2.Key benefits for stakeholders
1.3.Key market segments
1.4.Research methodology

1.4.1.Secondary research
1.4.2.Primary research
1.4.3.Analyst tools and models

CHAPTER 2:EXECUTIVE SUMMARY

2.1.Key findings of the study
2.2.CXO perspective

CHAPTER 3:MARKET OVERVIEW

3.1.Market definition and scope
3.2.Key findings

3.2.1.Top investment pockets

3.3.Porter’s five forces analysis
3.4.Market dynamics

3.4.1.Drivers

3.4.1.1.Rise in number of wineries
3.4.1.2.Increase in wine production
3.4.1.3.The significant replacement rate in the matured markets
3.4.1.4.High demand potential for wine from export markets

3.4.2.Restraint

3.4.2.1.High capacity capital and maintenance costs

3.4.3.Opportunities

3.4.3.1.Growth in technological innovations in winemaking processes

CHAPTER 4:WINE PRODUCTION MACHINERY MARKET, BY TYPE

4.1.Overview

4.1.1.Market size and forecast

4.2.Tanks & fermenters

4.2.1.Key market trends, growth factors, and opportunities
4.2.2.Market size and forecast

4.3.Crushing & pressing equipment

4.3.1.Key market trends, growth factors, and opportunities
4.3.2.Market size and forecast

4.4.Temperature control equipment

4.4.1.Key market trends, growth factors, and opportunities
4.4.2.Market size and forecast

4.5.Filtration equipment

4.5.1.Key market trends, growth factors, and opportunities
4.5.2.Market size and forecast

4.6.Others

4.6.1.Key market trends, growth factors, and opportunities
4.6.2.Market size and forecast

CHAPTER 5:WINE PRODUCTION MACHINERY MARKET, BY REGION

5.1.Overview

5.1.1.Market size and forecast, by region

5.2.North America

5.2.1.Key market trends, growth factors, and opportunities
5.2.2.Market size and forecast, by type
5.2.3.Market size and forecast, by country

5.2.3.1.U.S.

5.2.3.1.1.Market size and forecast, by type

5.2.3.2.Mexico

5.2.3.2.1.Market size and forecast, by type

5.2.3.3.Canada

5.2.3.3.1.Market size and forecast, by type

5.3.Europe

5.3.1.Key market trends, growth factors, and opportunities
5.3.2.Market size and forecast, by type
5.3.3.Market size and forecast, by country

5.3.3.1.Germany

5.3.3.1.1.Market size and forecast, by type

5.3.3.2.UK

5.3.3.2.1.Market size and forecast, by type

5.3.3.3.France

5.3.3.3.1.Market size and forecast, by type

5.3.3.4.Italy

5.3.3.4.1.Market size and forecast, by type

5.3.3.5.Spain

5.3.3.5.1.Market size and forecast, by type

5.3.3.6.Rest of Europe

5.3.3.6.1.Market size and forecast, by type

5.4.Asia-Pacific

5.4.1.Key market trends, growth factors, and opportunities
5.4.2.Market size and forecast, by type
5.4.3.Market size and forecast, by country

5.4.3.1.China

5.4.3.1.1.Market size and forecast, by type

5.4.3.2.India

5.4.3.2.1.Market size and forecast, by type

5.4.3.3.Japan

5.4.3.3.1.Market size and forecast, by type

5.4.3.4.Australia

5.4.3.4.1.Market size and forecast, by type

5.4.3.5.Rest of Asia-Pacific

5.4.3.5.1.Market size and forecast, by type

5.5.LAMEA

5.5.1.Key market trends, growth factors, and opportunities
5.5.2.Market size and forecast, by type
5.5.3.Market size and forecast, by country

5.5.3.1.Brazil

5.5.3.1.1.Market size and forecast, by type

5.5.3.2.South Africa

5.5.3.2.1.Market size and forecast, by type

5.5.3.3.Chile

5.5.3.3.1.Market size and forecast, by type

5.5.3.4.Argentina

5.5.3.4.1.Market size and forecast, by type

5.5.3.5.Rest of LAMEA

5.5.3.5.1.Market size and forecast, by type

CHAPTER 6:COMPETITIVE LANDSCAPE

6.1.Top player positioning
6.2.Competitive dashboard
6.3.Competitive heatmap

CHAPTER 7:COMPANY PROFILES

7.1.ADAMARK AIR KNIFE SYSTEMS

7.1.1.Company overview
7.1.2.Key Executives
7.1.3.Company snapshot
7.1.4.Product portfolio

7.2.AGROVIN

7.2.1.Company overview
7.2.2.Company snapshot
7.2.3.Product portfolio
7.2.4.Key strategic moves and developments

7.3.CRIVELLER GROUP

7.3.1.Company overview
7.3.2.Company snapshot
7.3.3.Product portfolio

7.4.DT PACIFIC PTY. LTD.

7.4.1.Company overview
7.4.2.Company snapshot
7.4.3.Product portfolio

7.5.G.W. KENT, INC.

7.5.1.Company overview
7.5.2.Company snapshot
7.5.3.Product portfolio

7.6.LOVE BREWING LIMITED

7.6.1.Company overview
7.6.2.Company snapshot
7.6.3.Product portfolio

7.7.NORTHERN BREWER

7.7.1.Company overview
7.7.2.Company snapshot
7.7.3.Product portfolio

7.8.PAUL MUELLER COMPANY, INC.

7.8.1.Company overview
7.8.2.Key Executives
7.8.3.Company snapshot
7.8.4.Operating business segments
7.8.5.Product portfolio
7.8.6.R&D Expenditure
7.8.7.Business performance

7.9.GRAPEWORKS PTY LTD.

7.9.1.Company overview
7.9.2.Company snapshot
7.9.3.Product portfolio

7.10.VITIKIT LTD.

7.10.1.Company overview
7.10.2.Company snapshot
7.10.3.Product portfolio

LIST OF TABLES

TABLE 01.TOP 6 LEADING COUNTRIES IN WINE PRODUCTION, MILLION HECTOLITERS (M HL)
TABLE 02.PERCENTAGE OF TOTAL INVESTMENT COST BY EQUIPMENT CATEGORY AND WINERY SIZE (M HL)
TABLE 03.GLOBAL WINE PRODUCTION MACHINERY MARKET REVENUE, BY TYPE, 2019–2027 ($MILLION)
TABLE 04.TANKS & FERMENTERS MARKET REVENUE, BY REGION, 2019–2027 ($MILLION)
TABLE 05.CRUSHING & PRESSING EQUIPMENT MARKET REVENUE, BY REGION, 2019–2027 ($MILLION)
TABLE 06.TEMPERATURE CONTROL EQUIPMENT MARKET REVENUE, BY REGION, 2019–2027 ($MILLION)
TABLE 07.FILTRATION EQUIPMENT MARKET REVENUE, BY REGION, 2019–2027 ($MILLION)
TABLE 08.OTHER WINE PRODUCTION MACHINERY MARKET REVENUE, BY REGION, 2019–2027 ($MILLION)
TABLE 09.WINE PRODUCTION MACHINERY MARKET REVENUE, BY REGION, 2019–2027 ($MILLION)
TABLE 10.NORTH AMERICA WINE PRODUCTION MACHINERY MARKET REVENUE, BY TYPE, 2019–2027 ($MILLION)
TABLE 11.NORTH AMERICA WINE PRODUCTION MACHINERY MARKET REVENUE, BY COUNTRY, 2019–2027 ($MILLION)
TABLE 12.U.S. WINE PRODUCTION MACHINERY MARKET REVENUE, BY TYPE, 2019–2027 ($MILLION)
TABLE 13.MEXICO WINE PRODUCTION MACHINERY MARKET REVENUE, BY TYPE, 2019–2027 ($MILLION)
TABLE 14.CANADA WINE PRODUCTION MACHINERY MARKET REVENUE, BY TYPE, 2019–2027 ($MILLION)
TABLE 15.EUROPE WINE PRODUCTION MACHINERY MARKET REVENUE, BY TYPE, 2019–2027 ($MILLION)
TABLE 16.EUROPE WINE PRODUCTION MACHINERY MARKET REVENUE, BY COUNTRY, 2019–2027 ($MILLION)
TABLE 17.GERMANY WINE PRODUCTION MACHINERY MARKET REVENUE, BY TYPE, 2019–2027 ($MILLION)
TABLE 18.UK WINE PRODUCTION MACHINERY MARKET REVENUE, BY TYPE, 2019–2027 ($MILLION)
TABLE 19.FRANCE WINE PRODUCTION MACHINERY MARKET REVENUE, BY TYPE, 2019–2027 ($MILLION)
TABLE 20.ITALY WINE PRODUCTION MACHINERY MARKET REVENUE, BY TYPE, 2019–2027 ($MILLION)
TABLE 21.SPAIN WINE PRODUCTION MACHINERY MARKET REVENUE, BY TYPE, 2019–2027 ($MILLION)
TABLE 22.REST OF EUROPE WINE PRODUCTION MACHINERY MARKET REVENUE, BY TYPE, 2019–2027 ($MILLION)
TABLE 23.ASIA-PACIFIC WINE PRODUCTION MACHINERY MARKET REVENUE, BY TYPE, 2019–2027 ($MILLION)
TABLE 24.ASIA-PACIFIC WINE PRODUCTION MACHINERY MARKET REVENUE, BY COUNTRY, 2019–2027 ($MILLION)
TABLE 25.CHINA WINE PRODUCTION MACHINERY MARKET REVENUE, BY TYPE, 2019–2027 ($MILLION)
TABLE 26.INDIA WINE PRODUCTION MACHINERY MARKET REVENUE, BY TYPE, 2019–2027 ($MILLION)
TABLE 27.JAPAN WINE PRODUCTION MACHINERY MARKET REVENUE, BY TYPE, 2019–2027 ($MILLION)
TABLE 28.AUSTRALIA WINE PRODUCTION MACHINERY MARKET REVENUE, BY TYPE, 2019–2027 ($MILLION)
TABLE 29.REST OF ASIA-PACIFIC WINE PRODUCTION MACHINERY MARKET REVENUE, BY TYPE, 2019–2027 ($MILLION)
TABLE 30.LAMEA WINE PRODUCTION MACHINERY MARKET REVENUE, BY TYPE, 2019–2027 ($MILLION)
TABLE 31.LAMEA WINE PRODUCTION MACHINERY MARKET REVENUE, BY COUNTRY, 2019–2027 ($MILLION)
TABLE 32.BRAZIL WINE PRODUCTION MACHINERY MARKET REVENUE, BY TYPE, 2019–2027 ($MILLION)
TABLE 33.SOUTH AFRICA WINE PRODUCTION MACHINERY MARKET REVENUE, BY TYPE, 2019–2027 ($MILLION)
TABLE 34.CHILE WINE PRODUCTION MACHINERY MARKET REVENUE, BY TYPE, 2019–2027 ($MILLION)
TABLE 35.ARGENTINA WINE PRODUCTION MACHINERY MARKET REVENUE, BY TYPE, 2019–2027 ($MILLION)
TABLE 36.REST OF LAMEA WINE PRODUCTION MACHINERY MARKET REVENUE, BY TYPE, 2019–2027 ($MILLION)
TABLE 37.ADAMARK AIR KNIFE SYSTEMS : KEY EXECUTIVES
TABLE 38.ADAMARK AIR KNIFE SYSTEMS : COMPANY SNAPSHOT
TABLE 39.ADAMARK AIR KNIFE SYSTEMS : PRODUCT PORTFOLIO
TABLE 40.AGROVIN: COMPANY SNAPSHOT
TABLE 41.AGROVIN: PRODUCT PORTFOLIO
TABLE 42.CRIVELLER GROUP: COMPANY SNAPSHOT
TABLE 43.CRIVELLER GROUP: PRODUCT PORTFOLIO
TABLE 44.DT PACIFIC PTY. LTD.: COMPANY SNAPSHOT
TABLE 45.DT PACIFIC PTY. LTD.: PRODUCT PORTFOLIO
TABLE 46.G.W. KENT, INC.: COMPANY SNAPSHOT
TABLE 47.G.W. KENT, INC.: PRODUCT PORTFOLIO
TABLE 48.LOVE BREWING LIMITED: COMPANY SNAPSHOT
TABLE 49.LOVE BREWING LIMITED: PRODUCT PORTFOLIO
TABLE 50.NORTHERN BREWER: COMPANY SNAPSHOT
TABLE 51.NORTHERN BREWER: PRODUCT PORTFOLIO
TABLE 52.PAUL MUELLER COMPANY, INC.: KEY EXECUTIVES
TABLE 53.PAUL MUELLER COMPANY, INC.: COMPANY SNAPSHOT
TABLE 54.PAUL MUELLER COMPANY, INC.: OPERATING SEGMENTS
TABLE 55.PAUL MUELLER COMPANY, INC.: PRODUCT PORTFOLIO
TABLE 56.PAUL MUELLER COMPANY, INC.: R&D EXPENDITURE, 2016–2018 ($THOUSANDS)
TABLE 57.PAUL MUELLER COMPANY, INC.: NET SALES, 2016–2018 ($MILLION)
TABLE 58.GRAPEWORKS PTY LTD.: COMPANY SNAPSHOT
TABLE 59.GRAPEWORKS PTY LTD.: PRODUCT PORTFOLIO
TABLE 60.VITIKIT LTD.: COMPANY SNAPSHOT
TABLE 61.VITIKIT LTD.: PRODUCT PORTFOLIO

LIST OF FIGURES

FIGURE 01.WINE PRODUCTION MACHINERY MARKET SNAPSHOT
FIGURE 02.WINE PRODUCTION MACHINERY MARKET: SEGMENTATION
FIGURE 03.TOP INVESTMENT POCKETS
FIGURE 04.MODERATE BARGAINING POWER OF SUPPLIERS
FIGURE 05.HIGH BARGAINING POWER OF BUYERS
FIGURE 06.LOW THREAT OF SUBSTITUTION
FIGURE 07.MODERATE THREAT OF NEW ENTRANTS
FIGURE 08.MODERATE INTENSITY OF COMPETITIVE RIVALRY
FIGURE 09.WINE PRODUCTION MACHINERY MARKET: DRIVERS, RESTRAINTS, AND OPPORTUNITIES
FIGURE 10.NUMBER OF WINERIES IN US IN 2018
FIGURE 11.WINE PRODUCTION MACHINERY MARKET, BY TYPE, 2019 (%)
FIGURE 12.TANKS & FERMENTERS MARKET, COMPARATIVE COUNTRY MARKET SHARE ANALYSIS, 2019 & 2027 (%)
FIGURE 13.CRUSHING & PRESSING EQUIPMENT MARKET, COMPARATIVE REGIONAL MARKET SHARE ANALYSIS,  2019 & 2027 (%)
FIGURE 14.TEMPERATURE CONTROL EQUIPMENT MARKET, COMPARATIVE REGIONAL MARKET SHARE ANALYSIS,  2019 & 2027 (%)
FIGURE 15.FILTRATION EQUIPMENT MARKET, COMPARATIVE REGIONAL MARKET SHARE ANALYSIS, 2019 & 2027 (%)
FIGURE 16.OTHER WINE PRODUCTION MACHINERY MARKET, COMPARATIVE REGIONAL MARKET SHARE ANALYSIS,  2019 & 2027 (%)
FIGURE 17.WINE PRODUCTION MACHINERY MARKET, BY REGION, 2019 (%)
FIGURE 18.TOP 10 NUMBER OF WINERIES IN THE U.S.
FIGURE 19.US WINE CONSUMPTION PER RESIDENT 2010 – 2018
FIGURE 20.U.S. WINE PRODUCTION MACHINERY MARKET REVENUE, 2019–2027 ($MILLION)
FIGURE 21.MEXICO WINE PRODUCTION MACHINERY MARKET REVENUE, 2019–2027 ($MILLION)
FIGURE 22.CANADA PERCENTAGE IMPORT FROM THE COUNTRIES (IN 2017)
FIGURE 23.INCREASING TREND OF WORKING AGE POPULATION
FIGURE 24.CANADA WINE PRODUCTION MACHINERY MARKET REVENUE, 2019–2027 ($MILLION)
FIGURE 25.GERMANY WINE EXPORT TO OTHER COUNTRY (%)
FIGURE 26.HIGHEST WINE PRODUCING COUNTRIES IN EUROPE (%)
FIGURE 27.GERMANY WINE PRODUCTION MACHINERY MARKET REVENUE, 2019–2027 ($MILLION)
FIGURE 28.NUMBER OF VINEYARDS IN UK (%)
FIGURE 29.UK WINE PRODUCTION MACHINERY MARKET REVENUE, 2019–2027 ($MILLION)
FIGURE 30.FRANCE WINE PRODUCTION MACHINERY MARKET REVENUE, 2019–2027 ($MILLION)
FIGURE 31.ITALY WINE PRODUCTION MACHINERY MARKET REVENUE, 2019–2027 ($MILLION)
FIGURE 32.WINE EXPORT OF SPAIN TO OTHER COUNTRIES (%)
FIGURE 33.SPAIN WINE PRODUCTION MACHINERY MARKET REVENUE, 2019–2027 ($MILLION)
FIGURE 34.REST OF EUROPE WINE PRODUCTION MACHINERY MARKET REVENUE, 2019–2027 ($MILLION)
FIGURE 35.CHINA WINE PRODUCTION MACHINERY MARKET REVENUE, 2019–2027 ($MILLION)
FIGURE 36.INDIA WINE PRODUCTION MACHINERY MARKET REVENUE, 2019–2027 ($MILLION)
FIGURE 37.JAPAN WINE IMPORT FROM OTHER COUNTRIES IN 2018 (%)
FIGURE 38.JAPAN WINE PRODUCTION MACHINERY MARKET REVENUE, 2019–2027 ($MILLION)
FIGURE 39.AUSTRALIA WINE PRODUCTION MACHINERY MARKET REVENUE, 2019–2027 ($MILLION)
FIGURE 40.REST OF ASIA-PACIFIC WINE PRODUCTION MACHINERY MARKET REVENUE, 2019–2027 ($MILLION)
FIGURE 41.BRAZIL WINE PRODUCTION MACHINERY MARKET REVENUE, 2019–2027 ($MILLION)
FIGURE 42.SOUTH AFRICA WINE PRODUCTION MACHINERY MARKET REVENUE, 2019–2027 ($MILLION)
FIGURE 43.CHILE WINE PRODUCTION MACHINERY MARKET REVENUE, 2019–2027 ($MILLION)
FIGURE 44.ARGENTINA WINE PRODUCTION MACHINERY MARKET REVENUE, 2019–2027 ($MILLION)
FIGURE 45.REST OF LAMEA WINE PRODUCTION MACHINERY MARKET REVENUE, 2019–2027 ($MILLION)
FIGURE 46.TOP PLAYER POSITIONING
FIGURE 47.COMPETITIVE DASHBOARD OF TOP 10 KEY PLAYERS
FIGURE 48.COMPETITIVE HEATMAP OF TOP 10 KEY PLAYERS
FIGURE 49.PAUL MUELLER COMPANY, INC.: R&D EXPENDITURE, 2016–2018 ($THOUSANDS)
FIGURE 50.PAUL MUELLER COMPANY, INC.: NET SALES, 2016–2018 ($MILLION)
FIGURE 51.PAUL MUELLER COMPANY, INC.: REVENUE SHARE, BY SEGMENT, 2018 (%)
FIGURE 52.PAUL MUELLER COMPANY, INC.: REVENUE SHARE, BY REGION, 2018 (%)


Rise in demand for wine and increase in wineries are among the major factors that boost the market growth. A huge consumption of wine has been noted during past years, which is expected to continue during the forecast period. Consumer attractiveness toward different flavor of wines with its significant quality and reasonable pricing is among the main factors that drive the market growth. 

Increasing adoption of robotics, automation and Internet of things in wine making machineries have led manufacturers to invest more in R&D in order to meet the customer requirement. 

Trend of customization in machinery has gained huge traction in the wine production machinery market in past few years. Manufacturers are now providing customization on heating & cooling systems, crushing & pressing systems, agitation systems, aeration systems, exhaust systems as well as size, capacity and process. This has led to the growth of the wine making machinery market.
 

PURCHASE OPTIONS

Call or Email us

U.S.-Canada Toll-free: +1-800-792-5285
Int'l : +1-503-894-6022
Europe : +44-845-528-1300
Email : help@alliedmarketresearch.com
 
FREQUENTLY ASKED QUESTIONS?

A. The size of the global wine production machinery market in 2020 is $2.1 billion

A. The global wine production machinery market worth is 2.8 billion in 2027

A. The forecast period in the market report is (2020-2027)

A. The type is the segment of wine production machinery market

A. The active players in the wine production machinery market are GW KENT, Agrovin, Della Toffola Pacific, Love Brewing Ltd, Northern Brewer, Adamark Airknife, Paul Mueller Company, Vitikit Limited, Tanium Machinery, and Ve Criveller Group.

A. Rise in number of wineries, significant replacement rate in mature market and high demand potential for wine from export market are the market trends in the report.

A. The wine production machinery market projected to grow at a CAGR of 4.2% during the forecast period (2020-2027).

A. Europe region will provide more business opportunities for wine production machinery market in coming years.

A. The market value is 370.9 million in Italy and 10.8 million in India at a CAGR of 3.6% and 3.0% respectively

Looking for Customization?

 Customization Request

Have a Question?

 Speak with Analyst

Any Confusion?

 Inquire Before Buying

Have a glance of the Report

  Request Sample
RELATED TAGS

Purchase Full Report of
Wine Production Machinery Market

Start reading instantly.
This Report and over 66,905+ more Reports, Available with Avenue Library. T&C*.

  • Online Only
  • $3,456
  • Online cloud access only
  • Restricted print, copy, paste & download
  • Read only
  • Free industry update
    (Within 180 days)
  • Free report update in next update cycle
    (Apr 2021 - Apr 2022)
  • Data Pack
  • $3,840
  • Restricted to one authorized user
  • One print only
  • Available in
    Excel
  • Free industry update
    (Within 180 days)
  •   Free report update in next update cycle
    (Apr 2021 - Apr 2022)
  • Single User
  • $5,769
  • Restricted to one authorized user
  • One print only
  • Available in
    PDF
  • Free industry update
    (Within 180 days)
  •   Free report update in next update cycle
    (Apr 2021 - Apr 2022)
  • Five Users
  • $6,450
  • Limited to five authorized users
  • Print upto five copies
  • Available in
    PDF
  • Free industry update
    (Within 180 days)
  •   Free report update in next update cycle
    (Apr 2021 - Apr 2022)
  • Enterprise
    License/PDF

  • $10,995
  • Unlimited
    within
    company/enterprise
  • Available in Excel & PDF
  • Free industry update
    (Within 180 days)
  •   Free report update in next update cycle
    (Apr 2021 - Apr 2022)
  • Library
    Membership

  • $999 $ 1,175
    Per User/ Per month/ Billed annually
  • Published Content
    E-access
  • Company Profiles
    E-access
  • Newly Added Content Access
  • 10 PDF
    Downloads
  • 5 Excel Data
    Pack Downloads
  • 250 Company Profiles PDF Downloads
  • Buy Now

*Taxes/Fees, if applicable will be added during checkout. All prices in USD

RELATED REPORTS
 

Why Allied Market Research?


Infallible Methodology

To ensure high-level data integrity, accurate analysis, and impeccable forecasts

Analyst Support

For complete satisfaction

Customization

On-demand customization of scope of the report to exactly meet your needs

TARGETED MARKET VIEW

Targeted market view to provide pertinent information and save time of readers

Get fresh content delivered

Get insights on topics that are crucial for your business. Stay abreast of your interest areas.

Get Industry Data Alerts

Why Allied Market Research?

Infallible Methodology

To ensure high-level data integrity, accurate analysis, and impeccable forecasts

Analyst Support

For complete satisfaction

Customization

On-demand customization of scope of the report to exactly meet your needs

TARGETED MARKET VIEW

Targeted market view to provide pertinent information and save time of readers