
Wood Furniture Market Research, 2033
Market Introduction and Definition
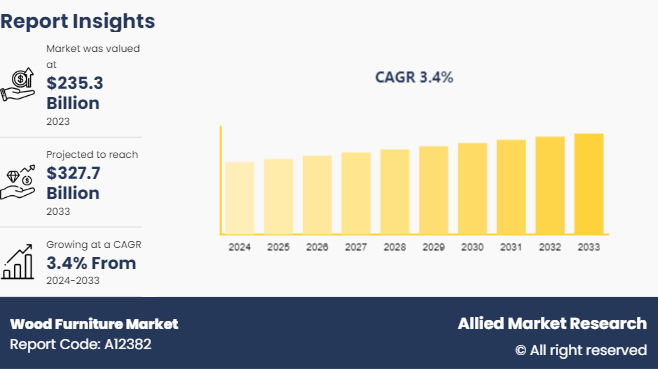
The global wood furniture market size was valued at $235.3 billion in 2023, and is projected to reach $327.7 billion by 2033, growing at a CAGR of 3.4% from 2024 to 2033. Wood furniture is constructed from solid or engineered wood, such as plywood, particleboard, or medium-density fibreboard (MDF) . These items are renowned for their longevity, aesthetic appeal, and adaptability, with meticulous craftsmanship and naturalistic finishes that complement the interior design. The wood furniture buisness is developing due to increased urbanization, rising disposable incomes, and improving customer preferences for sustainable and environmentally friendly products. The growth of the real estate and hospitality industries has created a need for high-quality furniture for homeowners, businesses, and hotels. Furthermore, developments in manufacturing technology, such as computer-aided design (CAD) and automated woodworking, have cut production costs while increasing customization. The growing acceptance of e-commerce platforms has fueled market expansion by giving customers easy access to a wide range of styles and patterns, while environmental consciousness has pushed the use of certified wood materials derived from sustainable forestry techniques.
Key Takeaways
- The wood furniture market study covers 20 countries. The research includes a segment analysis of each country in terms of value for the projected period.
- More than 1, 500 product literatures, industry releases, annual reports, and other such documents of major wood furniture industry participants along with authentic industry journals, trade associations' releases, and government websites have been reviewed for generating high-value industry insights.
- The study integrated high-quality data, professional opinions and analysis, and critical independent perspectives. The research approach is intended to provide a balanced view of global markets and to assist stakeholders in making educated decisions in order to achieve their most ambitious growth objectives.
Key market dynamics
The increasing speed of urbanization in emerging countries has greatly raised demand for wood furniture, owing to the construction of housing infrastructure. Urban populations, particularly in emerging nations, are enjoying more discretionary money and possess a great taste for modern, trendy furnishings. Furthermore, government and private sector initiatives in affordable housing projects ensure a steady need for residential furnishings, especially wood. This trend is fueled by the growing popularity of multi-functional and space-saving hardwood furniture designs geared to small urban living areas.
The wood furniture business is heavily reliant on the availability and pricing of raw materials like lumber and engineered wood. Timber prices fluctuate owing to deforestation legislation, trade restrictions, and supply chain interruptions, posing issues for manufacturers. Such instability frequently results in higher manufacturing costs, which are passed on to customers, thereby depressing the wood furniture market demand.
Consumers are increasingly looking for personalized furniture solutions that respond to their specific interests and space needs. This tendency has given the development of modular furniture, which is customizable and quick to assemble. Wood furniture makers may capitalize on this need by providing personalized solutions with multi-functional and space-efficient designs that appeal to both home and commercial customers.
Parent Market Analysis of Global Wood Furniture Market
The furniture industry was valued at $556.3 Billion in 2023, out of which the wood furniture market was valued at $235.3 Billion in 2023. The furniture industry's major focus is on innovation, sustainability, and utility, which helps the wood furniture market. As consumers prioritize quality and aesthetics, wood furniture's ageless appeal makes it a popular choice for home and commercial uses. The industry's emphasis on eco-friendly techniques, such as employing certified sustainable timber and reused materials, is in line with growing customer demand for ecologically responsible products. Technological improvements, such as CNC machining and 3D design software, allow producers to construct detailed and durable hardwood furniture more efficiently, increasing market competitiveness.
Parent Market Analysis, 2023
Market Name | Market Size ($Billion) |
Furniture Market | 556.3 |
Wood Furniture | 235.3 |
Market Segmentation
The wood furniture market is segmented into product type, price point, material, distribution channel, and region. On the basis of product type, the market is divided into residential furniture and commercial furniture. By price point, the market is segregated into economy, medium, and premium. On the basis of material, the market is divided into solid furniture and engineered wood. By distribution channel, the market is divided into offline and online. Region-wise, the market is analyzed across North America, Europe, Asia-Pacific, and LAMEA.
Regional/Country Market Outlook
In North America, rise in demand for licensed wood furniture tied to popular franchises, such as those from Disney and Marvel, is propelling sales. The region also sees rise in eco-conscious consumers favoring sustainable materials, encouraging manufacturers to adopt greener practices.
Meanwhile, the Asia-Pacific wood furniture market is witnessing rapid growth due to rise in disposable incomes and growing middle class population, particularly in countries such as China and India. Rise in urbanization and changing lifestyles are leading to higher spending on children's products, including wood furniture. In addition, the focus on educational and therapeutic wood furniture is gaining traction, as parents look for items that offer developmental benefits.
In Europe, the wood furniture market is characterized by a strong emphasis on quality and safety standards, with consumers attracted toward high-end, artisanal wood furniture. This region also benefits from a growing trend in customization, where consumers seek unique, personalized plush products. Thus, rise in disposable income, rise in demand for licensed and sustainable toys, and an emphasis on quality, positions the wood furniture market for sustained growth across these key regions, presenting opportunities for manufacturers to innovate and expand their offerings.
Industry Trends:
- According to an article published by the Joint Center for Housing Studies (JCHS) of Harvard University in 2021, 71% of homeowners in America who started a DIY project during the pandemic had already planned the project prior to the outbreak. Also, the article further elaborates that though the percentage share of DIY spending as part of home expenditure has been showcasing a decreasing trend in the years between 2011 to 2022, the overall home improvement market is expected to increase strongly in the coming years which is expected to increase the overall spending on DIY activities.
- With the rise of smart home technology, there is an increasing interest in furniture with integrated tech features such as wireless charging capabilities, built-in speakers, and IoT connectivity. The smart furniture market is projected to grow in the coming years
Competitive Landscape
The major players operating in the market to increase their wood furniture market share include Kimball International, Durham Furniture Inc., Williams-Sonoma, Inc., Inter IKEA Group, Ashley Furniture Industries Inc., Raymour & Flanigan, American Signature, Jason Furniture (HangZhou) Co., Ltd, La-Z-Boy Inc., and Oppein Home Group Inc.
Recent Key Strategies and Developments
- In February 2023, The Inter IKEA Group launched a new transitional range featuring three collections aimed at inspiring households to adopt more sustainable buying habits. The collections, namely Vivid Wonderland, Glorious Green, and Simple Serenity, are designed to encourage consumers to make eco-friendly choices in their purchases.
- In September 2022, Durham Furniture Inc. collaborated with Intiaro, a technology company specializing in 3D solutions, to enhance the online and in-store experience through advanced 3D strategy and visualization tools.
Key Benefits For Stakeholders
- This report provides a quantitative analysis of the market segments, current trends, estimations, and dynamics of the wood furniture market analysis from 2024 to 2033 to identify the prevailing wood furniture market opportunities.
- The market research is offered along with information related to key drivers, restraints, and opportunities.
- Porter's five forces analysis highlights the potency of buyers and suppliers to enable stakeholders make profit-oriented business decisions and strengthen their supplier-buyer network.
- In-depth analysis of the wood furniture market segmentation assists to determine the prevailing market opportunities.
- Major countries in each region are mapped according to their revenue contribution to the global market.
- Market player positioning facilitates benchmarking and provides a clear understanding of the present position of the market players.
- The report includes the analysis of the regional as well as global wood furniture market trends, key players, market segments, application areas, and wood furniture market growth strategies.
Wood Furniture Market Report Highlights
| Aspects | Details |
| Market Size By 2033 | USD 327.7 Billion |
| Growth Rate | CAGR of 3.4% |
| Forecast period | 2024 - 2033 |
| Report Pages | 230 |
| By Product Type |
|
| By Price Point |
|
| By Material |
|
| By Distribution Channel |
|
| By Region |
|
| Key Market Players | American Signature, Jason Furniture (HangZhou) Co., Ltd, Oppein Home Group Inc., Raymour & Flanigan, Williams-Sonoma, Inc., Ashley Furniture Industries Inc., Kimball International, Durham Furniture Inc., Inter IKEA Group, La-Z-Boy Inc. |
The wood furniture market was valued at $235.3 billion in 2023 and is estimated to reach $327.7 billion by 2033, exhibiting a CAGR of 3.4% from 2024 to 2033
The wood furniture market registered a CAGR of 3.4% from 2024 to 2033.
The forecast period in the wood furniture market report is from 2024 to 2033.
The top companies that hold the market share in the wood furniture market include Kimball International, Durham Furniture Inc., Williams-Sonoma, Inc., Inter IKEA Group, and others.
The wood furniture market report has 4 segments. The segments are product type, material type, price point and distribution channel.
Loading Table Of Content...

