0
2022
Wood Plastic Composites Market

Wood Plastic Composites Market

by Application (Building and Construction, Automotive Components, Industrial and Consumer Products, Others), by Type (Polyethylene, Polyvinylchloride, Polypropylene, Others): Global Opportunity Analysis and Industry Forecast, 2021-2030

✷  Report Code: A01336
May 2022 | Pages: 118
Tables: 102
Charts: 62
  • Formats*:

  • pdf

    Single User License, Five User
    License & Enterprise User License

  • xls

    Data Pack Excel License

  • ppt

    It comes with the additional cost
    of $2500.00 contact sales.


Wood Plastic Composites Market Research, 2030

The global wood plastic composites market was valued at $5.4 billion in 2020, and is projected to reach $12.6 billion by 2030, growing at a CAGR of 8.9% from 2021 to 2030.
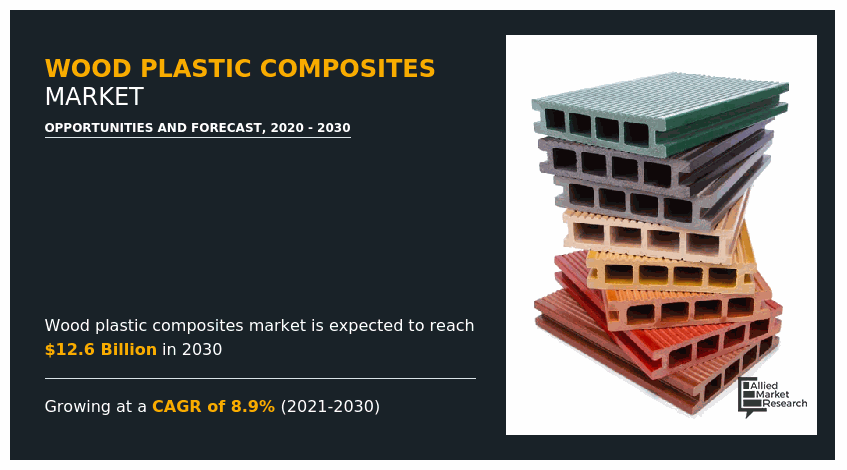
Demand for the wood plastics composites declined since 2020. Due to supply chain challenges, the markets experience difficulties in import and export.

Wood Plastic Composites Market

Wood plastics are a sort of natural composite made from wood and sawdust. It is an environment friendly natural composite. It is used in application of  both indoor and outdoor use, owing to durability and resistance . The composite solute can be chosen in various ways. The user can mix and match the woods in the composite due to the fact that wood comes in various types. Plastics are blended with more than 40% of the wood components. Wood plastic composites are gaining popularity in the global economy. Composites are used more than any other material. The wood plastics composites are produced by using recycled plastics at low melting temperatures as well as low cost.

There is increase in demand for wood plastic composites in building and automobile sectors, owing to low-cost and easy to use in non-structural areas, such as balconies, stairs,  and pillars. Furthermore, Wood plastic composites have various advantages,  compared to its alternatives. They are used in interiors, automotive speakers, home furniture, and kitchen appliances as they are robust, rust-free, low-maintenance, and can withstand high temperature. This has resulted in increase in demand for wood plastic composites all across the globe. Furthermore, growth of construction and building sectors is due to industrialization and urbanization in developing countries of the aforementioned factors drive the growth of the global wood composites market.

On the other hand, rise in cost of R&D restraints the market growth. Wood is a material that demands continuous investigation. This composite contains high-quality and expensive timber. Its parts can be used in a wide range of applications. As a result, the market for wood components is deteriorating. Furthermore, emergence of greenwood plastics composites is expected to provide new growth opportunities for the market. The durability of environment friendly composites gain popularity. Toxins are abundant in  composites which are manufactured . These pollutants harm both the environment as well as the people who use them. As a result, demand for environment friendly composites is increasing in numerous areas.

The wood plastic composites market is segmented on the basis of type, application, and region. By type, it  is segregated into polyethylene, polyvinylchloride, polypropylene, and others. As per the application, it is fragmented into building & construction, automotive components, industrial & consumer products, and others. Region-wise, it is analyzed across North America, Europe, Asia-Pacific, and LAMEA.

The key players profiled in this report include AIMPLAS, Beologic N.V., Dow, FKuR, Fortune Brands, JELU-WERK J. Ehrler GmbH & Co. KG, Renolit SE, TimberTech, Trex Company, Inc., Universal Forest Products, Inc The global wood plastic composites market report provides in-depth competitive analysis as well as profiles of these major players.
Wood Plastic Composites Market

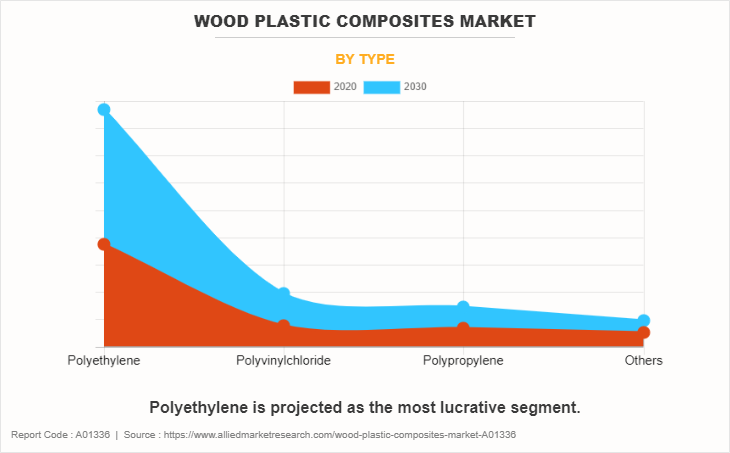
By type, polyethylene segment held the largest share of more than 69.4% in the wood plastic composites market in 2020, owing to its molecular structure and special arrangement of the molecules however, polyethylene (PE)-based composites of wood-plastic are widely used for producing decking including flooring, lumber, molding strips, furniture materials, wall cladding, hollow boards, and hollow filler profiles. Increase in construction activities across the globe augments the growth of the wood-plastic composites market.
Wood Plastic Composites Market

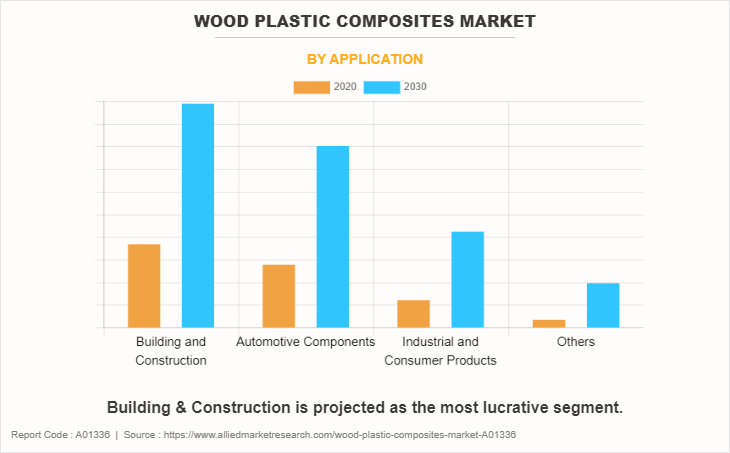
On the basis of application, building & construction segment  accounted for the major share of the market, owing to the high demand from decking. Eradication of barriers to promote foreign investments coupled with changing consumer focus toward green buildings is projected to boost the demand for wood plastic composite in the construction industry in the future.
Wood Plastic Composites Market

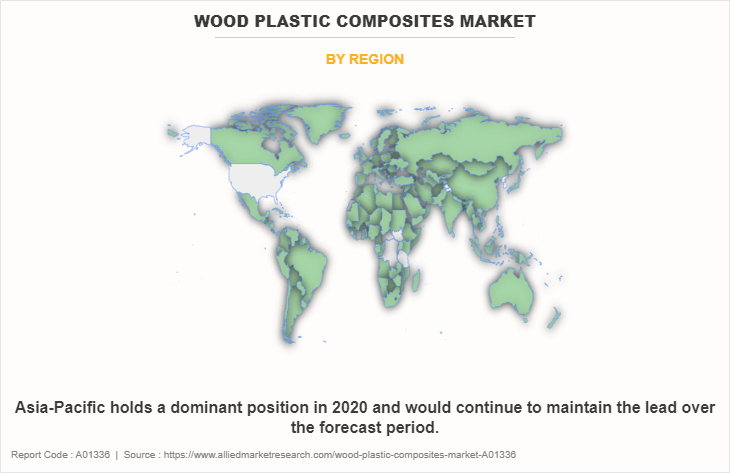
Region-wise, Asia-Pacific has dominated the wood plastic composites market with a share of more than 46.8% in 2020. Increase in building and construction activities in the Asia-Pacific countries, such as the China, India and Japan due to economic reforms and rise in per capita income of the individuals increases the demand for wood-plastic composites. Wood-plastic composites are preferred due to lightweight and good chemical and pest resistance compared to conventional wood.

Impact of COVID-19 on Global Wood Plastic Composites Market

  • The outbreak of COVID-19 led to partial or complete shutdown of production facilities that do not come under essential goods, owing to prolonged lockdown in major countries, including the U.S., China, Japan, India, and Germany. It led to either closure or suspension of their production activities in most of the industrial units across the globe.
  • COVID-19 proved to be a major challenge for the wood plastic composite market. The outbreak of coronavirus disrupted the supply chain and postponed the deliveries of wood composites and other raw materials from yards, due to lockdown and shortages of staff.
  • Industries are being shut down all across the world. People's purchasing power is decreasing, which has a direct impact on the automobile and construction industries, lowering demand for wood-plastic composites and limiting industry growth.
  • During this time, the construction industry suffered numerous losses. It's because of the high use of wood plastics. Construction, on the other hand, come to a halt. The need for wood plastics and composites is dwindling. Demand for the wood plastics and composites declined since 2020. Due to supply chain challenges, the markets experience difficulties in import and export. However, the demand for wood plastics has increased since 2021. New developments will create much more growth in the wood plastics composite industry.

Key Benefits For Stakeholders

  • This report provides a quantitative analysis of the market segments, current trends, estimations, and dynamics of the wood plastic composites market analysis from 2020 to 2030 to identify the prevailing wood plastic composites market opportunities.
  • The market research is offered along with information related to key drivers, restraints, and opportunities.
  • Porter's five forces analysis highlights the potency of buyers and suppliers to enable stakeholders make profit-oriented business decisions and strengthen their supplier-buyer network.
  • In-depth analysis of the wood plastic composites market segmentation assists to determine the prevailing market opportunities.
  • Major countries in each region are mapped according to their revenue contribution to the global market.
  • Market player positioning facilitates benchmarking and provides a clear understanding of the present position of the market players.
  • The report includes the analysis of the regional as well as global wood plastic composites market trends, key players, market segments, application areas, and market growth strategies.

Wood Plastic Composites Market Report Highlights

Aspects Details
Market Size By 2030 USD 12.6 billion
Growth Rate CAGR of 8.9%
Forecast period 2020 - 2030
Report Pages 118
By Type
  • Polyethylene
  • Polyvinylchloride
  • Polypropylene
  • Others
By Application
  • Building and Construction
  • Automotive Components
  • Industrial and Consumer Products
  • Others
By Region
  • North America  (U.S., Canada, Mexico)
  • Europe  (Germany, U.K., France, Italy, Spain, Rest of Europe)
  • Asia-Pacific  (China, India, Japan, South Korea, Rest of Asia-Pacific)
  • LAMEA  (Brazil, South Africa,, Saudi Arabia, Rest of LAMEA)
Key Market Players Beologic, Renolit SE, FKuR, UPF Industries, Inc., JELU-WERK J. Ehrler GmbH & Co. KG, Dow Inc., Trex Company, Inc., Fortune Brands Homes & Security, AIMPLAS, TimberTech

Analyst Review

Wood-plastic composites are hybrid materials made by mixing natural wood products, such as bamboo, pulp, and bark with thermoplastics or polymers. These products are easily pierced and planned and are made from biodegradable, recyclable and renewable plastic materials. Wood-plastic composites have the properties of wood and plastic. These composites are inherently versatile, durable, and resistant to spoilage, allowing manufacturers to create them in any shape. Wood-plastic composites work in hot zones, so they can be used in places where ordinary wood cannot be used. The production of these materials promotes the reuse of wood waste that would otherwise go to landfills.

The use of wood plastic composites prevents deforestation, owing to which they act as an ideal substitute for hard wood. In addition, manufacturing process of wood plastic composites does not involve any chemical which can be harmful or toxic to the environment. These environmental concerns and rise in awareness regarding wood plastic composites act as a primary factors driving the growth of the market.

 
  • CHAPTER 1: INTRODUCTION

    • 1.1. Report description

    • 1.2. Key market segments

    • 1.3. Key benefits to the stakeholders

    • 1.4. Research Methodology

      • 1.4.1. Primary research

      • 1.4.2. Secondary research

      • 1.4.3. Analyst tools and models

  • CHAPTER 2: EXECUTIVE SUMMARY

    • 2.1. CXO Perspective

  • CHAPTER 3: MARKET OVERVIEW

    • 3.1. Market definition and scope

    • 3.2. Key findings

      • 3.2.1. Top impacting factors

      • 3.2.2. Top investment pockets

    • 3.3. Porter’s five forces analysis

    • 3.4. Market dynamics

      • 3.4.1. Drivers

      • 3.4.2. Restraints

      • 3.4.3. Opportunities

    • 3.5. Market Share Analysis

    • 3.6. Value Chain Analysis

    • 3.7. Pricing Analysis

    • 3.8. Regulatory Guidelines

    • 3.9. Patent Landscape

  • CHAPTER 4: WOOD PLASTIC COMPOSITES MARKET, BY APPLICATION

    • 4.1. Overview

      • 4.1.1. Market size and forecast

    • 4.2. Building and Construction

      • 4.2.1. Key market trends, growth factors and opportunities

      • 4.2.2. Market size and forecast, by region

      • 4.2.3. Market share analysis by country

    • 4.3. Automotive Components

      • 4.3.1. Key market trends, growth factors and opportunities

      • 4.3.2. Market size and forecast, by region

      • 4.3.3. Market share analysis by country

    • 4.4. Industrial and Consumer Products

      • 4.4.1. Key market trends, growth factors and opportunities

      • 4.4.2. Market size and forecast, by region

      • 4.4.3. Market share analysis by country

    • 4.5. Others

      • 4.5.1. Key market trends, growth factors and opportunities

      • 4.5.2. Market size and forecast, by region

      • 4.5.3. Market share analysis by country

  • CHAPTER 5: WOOD PLASTIC COMPOSITES MARKET, BY TYPE

    • 5.1. Overview

      • 5.1.1. Market size and forecast

    • 5.2. Polyethylene

      • 5.2.1. Key market trends, growth factors and opportunities

      • 5.2.2. Market size and forecast, by region

      • 5.2.3. Market share analysis by country

    • 5.3. Polyvinylchloride

      • 5.3.1. Key market trends, growth factors and opportunities

      • 5.3.2. Market size and forecast, by region

      • 5.3.3. Market share analysis by country

    • 5.4. Polypropylene

      • 5.4.1. Key market trends, growth factors and opportunities

      • 5.4.2. Market size and forecast, by region

      • 5.4.3. Market share analysis by country

    • 5.5. Others

      • 5.5.1. Key market trends, growth factors and opportunities

      • 5.5.2. Market size and forecast, by region

      • 5.5.3. Market share analysis by country

  • CHAPTER 6: WOOD PLASTIC COMPOSITES MARKET, BY REGION

    • 6.1. Overview

      • 6.1.1. Market size and forecast By Region

    • 6.2. North America

      • 6.2.1. Key market trends, growth factors and opportunities

      • 6.2.2. Market size and forecast, by Application

      • 6.2.3. Market size and forecast, by Type

      • 6.2.4. Market size and forecast, by country

        • 6.2.4.1. U.S.
          • 6.2.4.1.1. Market size and forecast, by Application
          • 6.2.4.1.2. Market size and forecast, by Type
        • 6.2.4.2. Canada
          • 6.2.4.2.1. Market size and forecast, by Application
          • 6.2.4.2.2. Market size and forecast, by Type
        • 6.2.4.3. Mexico
          • 6.2.4.3.1. Market size and forecast, by Application
          • 6.2.4.3.2. Market size and forecast, by Type
    • 6.3. Europe

      • 6.3.1. Key market trends, growth factors and opportunities

      • 6.3.2. Market size and forecast, by Application

      • 6.3.3. Market size and forecast, by Type

      • 6.3.4. Market size and forecast, by country

        • 6.3.4.1. Germany
          • 6.3.4.1.1. Market size and forecast, by Application
          • 6.3.4.1.2. Market size and forecast, by Type
        • 6.3.4.2. U.K.
          • 6.3.4.2.1. Market size and forecast, by Application
          • 6.3.4.2.2. Market size and forecast, by Type
        • 6.3.4.3. France
          • 6.3.4.3.1. Market size and forecast, by Application
          • 6.3.4.3.2. Market size and forecast, by Type
        • 6.3.4.4. Italy
          • 6.3.4.4.1. Market size and forecast, by Application
          • 6.3.4.4.2. Market size and forecast, by Type
        • 6.3.4.5. Spain
          • 6.3.4.5.1. Market size and forecast, by Application
          • 6.3.4.5.2. Market size and forecast, by Type
        • 6.3.4.6. Rest of Europe
          • 6.3.4.6.1. Market size and forecast, by Application
          • 6.3.4.6.2. Market size and forecast, by Type
    • 6.4. Asia-Pacific

      • 6.4.1. Key market trends, growth factors and opportunities

      • 6.4.2. Market size and forecast, by Application

      • 6.4.3. Market size and forecast, by Type

      • 6.4.4. Market size and forecast, by country

        • 6.4.4.1. China
          • 6.4.4.1.1. Market size and forecast, by Application
          • 6.4.4.1.2. Market size and forecast, by Type
        • 6.4.4.2. India
          • 6.4.4.2.1. Market size and forecast, by Application
          • 6.4.4.2.2. Market size and forecast, by Type
        • 6.4.4.3. Japan
          • 6.4.4.3.1. Market size and forecast, by Application
          • 6.4.4.3.2. Market size and forecast, by Type
        • 6.4.4.4. South Korea
          • 6.4.4.4.1. Market size and forecast, by Application
          • 6.4.4.4.2. Market size and forecast, by Type
        • 6.4.4.5. Rest of Asia-Pacific
          • 6.4.4.5.1. Market size and forecast, by Application
          • 6.4.4.5.2. Market size and forecast, by Type
    • 6.5. LAMEA

      • 6.5.1. Key market trends, growth factors and opportunities

      • 6.5.2. Market size and forecast, by Application

      • 6.5.3. Market size and forecast, by Type

      • 6.5.4. Market size and forecast, by country

        • 6.5.4.1. Brazil
          • 6.5.4.1.1. Market size and forecast, by Application
          • 6.5.4.1.2. Market size and forecast, by Type
        • 6.5.4.2. South Africa,
          • 6.5.4.2.1. Market size and forecast, by Application
          • 6.5.4.2.2. Market size and forecast, by Type
        • 6.5.4.3. Saudi Arabia
          • 6.5.4.3.1. Market size and forecast, by Application
          • 6.5.4.3.2. Market size and forecast, by Type
        • 6.5.4.4. Rest of LAMEA
          • 6.5.4.4.1. Market size and forecast, by Application
          • 6.5.4.4.2. Market size and forecast, by Type
  • CHAPTER 7: COMPETITIVE LANDSCAPE

    • 7.1. Introduction

    • 7.2. Top winning strategies

    • 7.3. Product Mapping of Top 10 Player

    • 7.4. Competitive Dashboard

    • 7.5. Competitive Heatmap

    • 7.6. Top player positioning, 2020

  • CHAPTER 8: COMPANY PROFILES

    • 8.1. Beologic

      • 8.1.1. Company overview

      • 8.1.2. Key Executives

      • 8.1.3. Company snapshot

      • 8.1.4. Operating business segments

      • 8.1.5. Product portfolio

    • 8.2. FKuR

      • 8.2.1. Company overview

      • 8.2.2. Key Executives

      • 8.2.3. Company snapshot

      • 8.2.4. Operating business segments

      • 8.2.5. Product portfolio

    • 8.3. TimberTech

      • 8.3.1. Company overview

      • 8.3.2. Key Executives

      • 8.3.3. Company snapshot

      • 8.3.4. Operating business segments

      • 8.3.5. Product portfolio

    • 8.4. Trex Company, Inc.

      • 8.4.1. Company overview

      • 8.4.2. Key Executives

      • 8.4.3. Company snapshot

      • 8.4.4. Operating business segments

      • 8.4.5. Product portfolio

      • 8.4.6. Business performance

    • 8.5. AIMPLAS

      • 8.5.1. Company overview

      • 8.5.2. Key Executives

      • 8.5.3. Company snapshot

      • 8.5.4. Operating business segments

      • 8.5.5. Product portfolio

    • 8.6. Dow Inc.

      • 8.6.1. Company overview

      • 8.6.2. Key Executives

      • 8.6.3. Company snapshot

      • 8.6.4. Operating business segments

      • 8.6.5. Product portfolio

      • 8.6.6. Business performance

      • 8.6.7. Key strategic moves and developments

    • 8.7. Fortune Brands Homes & Security

      • 8.7.1. Company overview

      • 8.7.2. Key Executives

      • 8.7.3. Company snapshot

      • 8.7.4. Operating business segments

      • 8.7.5. Product portfolio

      • 8.7.6. Business performance

      • 8.7.7. Key strategic moves and developments

    • 8.8. JELU-WERK J. Ehrler GmbH & Co. KG

      • 8.8.1. Company overview

      • 8.8.2. Key Executives

      • 8.8.3. Company snapshot

      • 8.8.4. Operating business segments

      • 8.8.5. Product portfolio

    • 8.9. Renolit SE

      • 8.9.1. Company overview

      • 8.9.2. Key Executives

      • 8.9.3. Company snapshot

      • 8.9.4. Operating business segments

      • 8.9.5. Product portfolio

      • 8.9.6. Key strategic moves and developments

    • 8.10. UPF Industries, Inc.

      • 8.10.1. Company overview

      • 8.10.2. Key Executives

      • 8.10.3. Company snapshot

      • 8.10.4. Operating business segments

      • 8.10.5. Product portfolio

      • 8.10.6. Business performance

  • LIST OF TABLES

  • TABLE 01. GLOBAL WOOD PLASTIC COMPOSITES MARKET, BY APPLICATION, 2020-2030 ($MILLION)
    TABLE 02. WOOD PLASTIC COMPOSITES MARKET FOR BUILDING AND CONSTRUCTION, BY REGION, 2020-2030 ($MILLION)
    TABLE 03. WOOD PLASTIC COMPOSITES MARKET FOR AUTOMOTIVE COMPONENTS, BY REGION, 2020-2030 ($MILLION)
    TABLE 04. WOOD PLASTIC COMPOSITES MARKET FOR INDUSTRIAL AND CONSUMER PRODUCTS, BY REGION, 2020-2030 ($MILLION)
    TABLE 05. WOOD PLASTIC COMPOSITES MARKET FOR OTHERS, BY REGION, 2020-2030 ($MILLION)
    TABLE 06. GLOBAL WOOD PLASTIC COMPOSITES MARKET, BY TYPE, 2020-2030 ($MILLION)
    TABLE 07. WOOD PLASTIC COMPOSITES MARKET FOR POLYETHYLENE, BY REGION, 2020-2030 ($MILLION)
    TABLE 08. WOOD PLASTIC COMPOSITES MARKET FOR POLYVINYLCHLORIDE, BY REGION, 2020-2030 ($MILLION)
    TABLE 09. WOOD PLASTIC COMPOSITES MARKET FOR POLYPROPYLENE, BY REGION, 2020-2030 ($MILLION)
    TABLE 10. WOOD PLASTIC COMPOSITES MARKET FOR OTHERS, BY REGION, 2020-2030 ($MILLION)
    TABLE 11. WOOD PLASTIC COMPOSITES MARKET, BY REGION, 2020-2030 ($MILLION)
    TABLE 12. NORTH AMERICA WOOD PLASTIC COMPOSITES MARKET, BY APPLICATION, 2020-2030 ($MILLION)
    TABLE 13. NORTH AMERICA WOOD PLASTIC COMPOSITES MARKET, BY TYPE, 2020-2030 ($MILLION)
    TABLE 14. NORTH AMERICA WOOD PLASTIC COMPOSITES MARKET, BY COUNTRY, 2020-2030 ($MILLION)
    TABLE 15. U.S. WOOD PLASTIC COMPOSITES MARKET, BY APPLICATION, 2020-2030 ($MILLION)
    TABLE 16. U.S. WOOD PLASTIC COMPOSITES MARKET, BY TYPE, 2020-2030 ($MILLION)
    TABLE 17. CANADA WOOD PLASTIC COMPOSITES MARKET, BY APPLICATION, 2020-2030 ($MILLION)
    TABLE 18. CANADA WOOD PLASTIC COMPOSITES MARKET, BY TYPE, 2020-2030 ($MILLION)
    TABLE 19. MEXICO WOOD PLASTIC COMPOSITES MARKET, BY APPLICATION, 2020-2030 ($MILLION)
    TABLE 20. MEXICO WOOD PLASTIC COMPOSITES MARKET, BY TYPE, 2020-2030 ($MILLION)
    TABLE 21. EUROPE WOOD PLASTIC COMPOSITES MARKET, BY APPLICATION, 2020-2030 ($MILLION)
    TABLE 22. EUROPE WOOD PLASTIC COMPOSITES MARKET, BY TYPE, 2020-2030 ($MILLION)
    TABLE 23. EUROPE WOOD PLASTIC COMPOSITES MARKET, BY COUNTRY, 2020-2030 ($MILLION)
    TABLE 24. GERMANY WOOD PLASTIC COMPOSITES MARKET, BY APPLICATION, 2020-2030 ($MILLION)
    TABLE 25. GERMANY WOOD PLASTIC COMPOSITES MARKET, BY TYPE, 2020-2030 ($MILLION)
    TABLE 26. U.K. WOOD PLASTIC COMPOSITES MARKET, BY APPLICATION, 2020-2030 ($MILLION)
    TABLE 27. U.K. WOOD PLASTIC COMPOSITES MARKET, BY TYPE, 2020-2030 ($MILLION)
    TABLE 28. FRANCE WOOD PLASTIC COMPOSITES MARKET, BY APPLICATION, 2020-2030 ($MILLION)
    TABLE 29. FRANCE WOOD PLASTIC COMPOSITES MARKET, BY TYPE, 2020-2030 ($MILLION)
    TABLE 30. ITALY WOOD PLASTIC COMPOSITES MARKET, BY APPLICATION, 2020-2030 ($MILLION)
    TABLE 31. ITALY WOOD PLASTIC COMPOSITES MARKET, BY TYPE, 2020-2030 ($MILLION)
    TABLE 32. SPAIN WOOD PLASTIC COMPOSITES MARKET, BY APPLICATION, 2020-2030 ($MILLION)
    TABLE 33. SPAIN WOOD PLASTIC COMPOSITES MARKET, BY TYPE, 2020-2030 ($MILLION)
    TABLE 34. REST OF EUROPE WOOD PLASTIC COMPOSITES MARKET, BY APPLICATION, 2020-2030 ($MILLION)
    TABLE 35. REST OF EUROPE WOOD PLASTIC COMPOSITES MARKET, BY TYPE, 2020-2030 ($MILLION)
    TABLE 36. ASIA-PACIFIC WOOD PLASTIC COMPOSITES MARKET, BY APPLICATION, 2020-2030 ($MILLION)
    TABLE 37. ASIA-PACIFIC WOOD PLASTIC COMPOSITES MARKET, BY TYPE, 2020-2030 ($MILLION)
    TABLE 38. ASIA-PACIFIC WOOD PLASTIC COMPOSITES MARKET, BY COUNTRY, 2020-2030 ($MILLION)
    TABLE 39. CHINA WOOD PLASTIC COMPOSITES MARKET, BY APPLICATION, 2020-2030 ($MILLION)
    TABLE 40. CHINA WOOD PLASTIC COMPOSITES MARKET, BY TYPE, 2020-2030 ($MILLION)
    TABLE 41. INDIA WOOD PLASTIC COMPOSITES MARKET, BY APPLICATION, 2020-2030 ($MILLION)
    TABLE 42. INDIA WOOD PLASTIC COMPOSITES MARKET, BY TYPE, 2020-2030 ($MILLION)
    TABLE 43. JAPAN WOOD PLASTIC COMPOSITES MARKET, BY APPLICATION, 2020-2030 ($MILLION)
    TABLE 44. JAPAN WOOD PLASTIC COMPOSITES MARKET, BY TYPE, 2020-2030 ($MILLION)
    TABLE 45. SOUTH KOREA WOOD PLASTIC COMPOSITES MARKET, BY APPLICATION, 2020-2030 ($MILLION)
    TABLE 46. SOUTH KOREA WOOD PLASTIC COMPOSITES MARKET, BY TYPE, 2020-2030 ($MILLION)
    TABLE 47. REST OF ASIA-PACIFIC WOOD PLASTIC COMPOSITES MARKET, BY APPLICATION, 2020-2030 ($MILLION)
    TABLE 48. REST OF ASIA-PACIFIC WOOD PLASTIC COMPOSITES MARKET, BY TYPE, 2020-2030 ($MILLION)
    TABLE 49. LAMEA WOOD PLASTIC COMPOSITES MARKET, BY APPLICATION, 2020-2030 ($MILLION)
    TABLE 50. LAMEA WOOD PLASTIC COMPOSITES MARKET, BY TYPE, 2020-2030 ($MILLION)
    TABLE 51. LAMEA WOOD PLASTIC COMPOSITES MARKET, BY COUNTRY, 2020-2030 ($MILLION)
    TABLE 52. BRAZIL WOOD PLASTIC COMPOSITES MARKET, BY APPLICATION, 2020-2030 ($MILLION)
    TABLE 53. BRAZIL WOOD PLASTIC COMPOSITES MARKET, BY TYPE, 2020-2030 ($MILLION)
    TABLE 54. SOUTH AFRICA, WOOD PLASTIC COMPOSITES MARKET, BY APPLICATION, 2020-2030 ($MILLION)
    TABLE 55. SOUTH AFRICA, WOOD PLASTIC COMPOSITES MARKET, BY TYPE, 2020-2030 ($MILLION)
    TABLE 56. SAUDI ARABIA WOOD PLASTIC COMPOSITES MARKET, BY APPLICATION, 2020-2030 ($MILLION)
    TABLE 57. SAUDI ARABIA WOOD PLASTIC COMPOSITES MARKET, BY TYPE, 2020-2030 ($MILLION)
    TABLE 58. REST OF LAMEA WOOD PLASTIC COMPOSITES MARKET, BY APPLICATION, 2020-2030 ($MILLION)
    TABLE 59. REST OF LAMEA WOOD PLASTIC COMPOSITES MARKET, BY TYPE, 2020-2030 ($MILLION)
    TABLE 60. BEOLOGIC: KEY EXECUTIVES
    TABLE 61. BEOLOGIC: COMPANY SNAPSHOT
    TABLE 62. BEOLOGIC: PRODUCT SEGMENTS
    TABLE 63. BEOLOGIC: PRODUCT PORTFOLIO
    TABLE 64. FKUR: KEY EXECUTIVES
    TABLE 65. FKUR: COMPANY SNAPSHOT
    TABLE 66. FKUR: PRODUCT SEGMENTS
    TABLE 67. FKUR: PRODUCT PORTFOLIO
    TABLE 68. TIMBERTECH: KEY EXECUTIVES
    TABLE 69. TIMBERTECH: COMPANY SNAPSHOT
    TABLE 70. TIMBERTECH: PRODUCT SEGMENTS
    TABLE 71. TIMBERTECH: PRODUCT PORTFOLIO
    TABLE 72. TREX COMPANY, INC.: KEY EXECUTIVES
    TABLE 73. TREX COMPANY, INC.: COMPANY SNAPSHOT
    TABLE 74. TREX COMPANY, INC.: PRODUCT SEGMENTS
    TABLE 75. TREX COMPANY, INC.: PRODUCT PORTFOLIO
    TABLE 76. AIMPLAS: KEY EXECUTIVES
    TABLE 77. AIMPLAS: COMPANY SNAPSHOT
    TABLE 78. AIMPLAS: PRODUCT SEGMENTS
    TABLE 79. AIMPLAS: PRODUCT PORTFOLIO
    TABLE 80. DOW INC.: KEY EXECUTIVES
    TABLE 81. DOW INC.: COMPANY SNAPSHOT
    TABLE 82. DOW INC.: PRODUCT SEGMENTS
    TABLE 83. DOW INC.: PRODUCT PORTFOLIO
    TABLE 84. DOW INC.: KEY STRATERGIES
    TABLE 85. FORTUNE BRANDS HOMES & SECURITY: KEY EXECUTIVES
    TABLE 86. FORTUNE BRANDS HOMES & SECURITY: COMPANY SNAPSHOT
    TABLE 87. FORTUNE BRANDS HOMES & SECURITY: PRODUCT SEGMENTS
    TABLE 88. FORTUNE BRANDS HOMES & SECURITY: PRODUCT PORTFOLIO
    TABLE 89. FORTUNE BRANDS HOMES & SECURITY: KEY STRATERGIES
    TABLE 90. JELU-WERK J. EHRLER GMBH & CO. KG: KEY EXECUTIVES
    TABLE 91. JELU-WERK J. EHRLER GMBH & CO. KG: COMPANY SNAPSHOT
    TABLE 92. JELU-WERK J. EHRLER GMBH & CO. KG: PRODUCT SEGMENTS
    TABLE 93. JELU-WERK J. EHRLER GMBH & CO. KG: PRODUCT PORTFOLIO
    TABLE 94. RENOLIT SE: KEY EXECUTIVES
    TABLE 95. RENOLIT SE: COMPANY SNAPSHOT
    TABLE 96. RENOLIT SE: PRODUCT SEGMENTS
    TABLE 97. RENOLIT SE: PRODUCT PORTFOLIO
    TABLE 98. RENOLIT SE: KEY STRATERGIES
    TABLE 99. UPF INDUSTRIES, INC.: KEY EXECUTIVES
    TABLE 100. UPF INDUSTRIES, INC.: COMPANY SNAPSHOT
    TABLE 101. UPF INDUSTRIES, INC.: PRODUCT SEGMENTS
    TABLE 102. UPF INDUSTRIES, INC.: PRODUCT PORTFOLIO
  • LIST OF FIGURES

  • FIGURE 1.WOOD PLASTIC COMPOSITES MARKET SEGMENTATION
    FIGURE 2.WOOD PLASTIC COMPOSITES MARKET,2020-2030
    FIGURE 3.WOOD PLASTIC COMPOSITES MARKET,2020-2030
    FIGURE 4. TOP INVESTMENT POCKETS, BY REGION
    FIGURE 5.PORTER FIVE-1
    FIGURE 6.PORTER FIVE-2
    FIGURE 7.PORTER FIVE-3
    FIGURE 8.PORTER FIVE-4
    FIGURE 9.PORTER FIVE-5
    FIGURE 10.TOP PLAYER POSITIONING
    FIGURE 11.WOOD PLASTIC COMPOSITES MARKET:DRIVERS, RESTRAINTS AND OPPORTUNITIES
    FIGURE 12.PRICING ANALYSIS
    FIGURE 13.REGULATORY GUIDELINES
    FIGURE 14.VALUE CHAIN ANALYSIS
    FIGURE 15.PATENT ANALYSIS BY COMPANY
    FIGURE 16.PATENT ANALYSIS BY COUNTRY
    FIGURE 17.MARKET SHARE ANALYSIS
    FIGURE 18.WOOD PLASTIC COMPOSITES MARKET,BY APPLICATION,2020(%)
    FIGURE 19.COMPARATIVE SHARE ANALYSIS OF BUILDING AND CONSTRUCTION WOOD PLASTIC COMPOSITES MARKET,2020-2030(%)
    FIGURE 20.COMPARATIVE SHARE ANALYSIS OF AUTOMOTIVE COMPONENTS WOOD PLASTIC COMPOSITES MARKET,2020-2030(%)
    FIGURE 21.COMPARATIVE SHARE ANALYSIS OF INDUSTRIAL AND CONSUMER PRODUCTS WOOD PLASTIC COMPOSITES MARKET,2020-2030(%)
    FIGURE 22.COMPARATIVE SHARE ANALYSIS OF OTHERS WOOD PLASTIC COMPOSITES MARKET,2020-2030(%)
    FIGURE 23.WOOD PLASTIC COMPOSITES MARKET,BY TYPE,2020(%)
    FIGURE 24.COMPARATIVE SHARE ANALYSIS OF POLYETHYLENE WOOD PLASTIC COMPOSITES MARKET,2020-2030(%)
    FIGURE 25.COMPARATIVE SHARE ANALYSIS OF POLYVINYLCHLORIDE WOOD PLASTIC COMPOSITES MARKET,2020-2030(%)
    FIGURE 26.COMPARATIVE SHARE ANALYSIS OF POLYPROPYLENE WOOD PLASTIC COMPOSITES MARKET,2020-2030(%)
    FIGURE 27.COMPARATIVE SHARE ANALYSIS OF OTHERS WOOD PLASTIC COMPOSITES MARKET,2020-2030(%)
    FIGURE 28.WOOD PLASTIC COMPOSITES MARKET BY REGION,2020
    FIGURE 29.U.S. WOOD PLASTIC COMPOSITES MARKET,2020-2030($MILLION)
    FIGURE 30.CANADA WOOD PLASTIC COMPOSITES MARKET,2020-2030($MILLION)
    FIGURE 31.MEXICO WOOD PLASTIC COMPOSITES MARKET,2020-2030($MILLION)
    FIGURE 32.GERMANY WOOD PLASTIC COMPOSITES MARKET,2020-2030($MILLION)
    FIGURE 33.U.K. WOOD PLASTIC COMPOSITES MARKET,2020-2030($MILLION)
    FIGURE 34.FRANCE WOOD PLASTIC COMPOSITES MARKET,2020-2030($MILLION)
    FIGURE 35.ITALY WOOD PLASTIC COMPOSITES MARKET,2020-2030($MILLION)
    FIGURE 36.SPAIN WOOD PLASTIC COMPOSITES MARKET,2020-2030($MILLION)
    FIGURE 37.REST OF EUROPE WOOD PLASTIC COMPOSITES MARKET,2020-2030($MILLION)
    FIGURE 38.CHINA WOOD PLASTIC COMPOSITES MARKET,2020-2030($MILLION)
    FIGURE 39.INDIA WOOD PLASTIC COMPOSITES MARKET,2020-2030($MILLION)
    FIGURE 40.JAPAN WOOD PLASTIC COMPOSITES MARKET,2020-2030($MILLION)
    FIGURE 41.SOUTH KOREA WOOD PLASTIC COMPOSITES MARKET,2020-2030($MILLION)
    FIGURE 42.REST OF ASIA-PACIFIC WOOD PLASTIC COMPOSITES MARKET,2020-2030($MILLION)
    FIGURE 43.BRAZIL WOOD PLASTIC COMPOSITES MARKET,2020-2030($MILLION)
    FIGURE 44.SOUTH AFRICA, WOOD PLASTIC COMPOSITES MARKET,2020-2030($MILLION)
    FIGURE 45.SAUDI ARABIA WOOD PLASTIC COMPOSITES MARKET,2020-2030($MILLION)
    FIGURE 46.REST OF LAMEA WOOD PLASTIC COMPOSITES MARKET,2020-2030($MILLION)
    FIGURE 47. TOP WINNING STRATEGIES, BY YEAR
    FIGURE 48. TOP WINNING STRATEGIES, BY DEVELOPMENT
    FIGURE 49. TOP WINNING STRATEGIES, BY COMPANY
    FIGURE 50.PRODUCT MAPPING OF TOP 10 PLAYERS
    FIGURE 51.COMPETITIVE DASHBOARD
    FIGURE 52.COMPETITIVE HEATMAP OF TOP 10 KEY PLAYERS
    FIGURE 53.TIMBERTECH LTD..: NET SALES ,($MILLION)
    FIGURE 54.TREX COMPANY, INC..: NET SALES ,($MILLION)
    FIGURE 55.BEOLOGIC N.V..: NET SALES ,($MILLION)
    FIGURE 56.FKUR KUNSTSTOFF GMBH.: NET SALES ,($MILLION)
    FIGURE 57.AIMPLAS.: NET SALES ,($MILLION)
    FIGURE 58.DOW.: NET SALES ,($MILLION)
    FIGURE 59.FORTUNE BRANDS INC..: NET SALES ,($MILLION)
    FIGURE 60.JELU-WERK J. EHRLER GMBH & CO. KG.: NET SALES ,($MILLION)
    FIGURE 61.RENOLIT SE.: NET SALES ,($MILLION)
    FIGURE 62.UNIVERSAL FOREST PRODUCTS, INC: NET SALES ,($MILLION)


Wood plastic composites (WPCs) offer a number of potential benefits, such as dimensional stability, recyclability, design flexibility, and others. The presence of wood in a plastic matrix can result in a stiffer and lower cost material as compared to use of only plastic. These composites are identified as sustainable materials due to use of wood particles, which is a byproduct of sawmill and other wood-processing waste streams and most plastic is derived from consumer and industrial recycling efforts. These composites offer higher flexibility to the material with respect to shape and color. Furthermore, reduction in need of higher amount of material can be obtained through engineering of special shapes.

The ratio of wood, plastic, and additives in WPC depends on the manufacturing process and desired properties of the end product; however, the amount of wood required in WPC is in the range of 20–85%. WPC commercial products are increasingly replacing several products in various structural applications, especially in the construction sector.

Asia-Pacific is expected to have a significant market share in the global market by 2023, owing to the coverage of wood plastic composite infrastructure and supply. In addition, increase in inclination toward biodegradable building materials is expected to expand the Asia-Pacific market share, as automotive and consumer product segments are implementing WPC, owing to its high flexibility in design.

PURCHASE OPTIONS

Call or Email us

U.S.-Canada Toll-free: +1-800-792-5285
Int'l : +1-503-894-6022
Europe : +44-845-528-1300
Email : help@alliedmarketresearch.com
 
FREQUENTLY ASKED QUESTIONS?

A. Key factors that are driving the market growth include rising demand for sustainable construction materials along with an increase in the renovation and repair activities in the residential sector across the globe.

A. The market players are adopting various growth strategies and also investing in R&D extensively to develop technically advanced unique products which are expected to drive the market size.

A. Asia-Pacific region will provide more business opportunities for wood plastic composites market in coming years

A. AIMPLAS, Beologic N.V., Dow, FKuR, Fortune Brands, JELU-WERK J. Ehrler GmbH & Co. KG, Renolit SE, TimberTech, and Trex Company, Inc. are the top players in wood plastic composites market.

A. By type segment holds the maximum share of the wood plastic composites market.

A. Polyethylene, polyvinylchloride, and polypropylene application are the potential customers of wood plastic composites industry.

A. Wood plastic composites have a lower melting temperature as compared to conventional wood products, which lowers the energy cost for end-users and also reduces the environmental impact of the product. 

A. The rise of infill development is projected to create opportunities for wood plastic composite manufacturers over the forecast period.

Looking for Customization?

 Customization Request

Have a Question?

 Speak with Analyst

Any Confusion?

 Inquire Before Buying

Have a glance of the Report

  Request Sample
RELATED TAGS

Purchase Full Report of
Wood Plastic Composites Market

Start reading instantly.
This Report and over 67,068+ more Reports, Available with Avenue Library. T&C*.

  • Online Only
  • $3,570
  • Online cloud access only
  • Restricted print, copy, paste & download
  • Read only
  • Free industry update
    (Within 180 days)
  • Free report update in next update cycle
    (May 2023 - May 2024)
  • Data Pack
  • $3,840
  • Restricted to one authorized user
  • One print only
  • Available in
    Excel
  • Free industry update
    (Within 180 days)
  •   Free report update in next update cycle
    (May 2023 - May 2024)
  • Single User
  • $5,730
  • Restricted to one authorized user
  • One print only
  • Available in
    PDF
  • Free industry update
    (Within 180 days)
  •   Free report update in next update cycle
    (May 2023 - May 2024)
  • Five Users
  • $6,450
  • Limited to five authorized users
  • Print upto five copies
  • Available in
    PDF
  • Free industry update
    (Within 180 days)
  •   Free report update in next update cycle
    (May 2023 - May 2024)
  • Enterprise
    License/PDF

  • $9,600
  • Unlimited
    within
    company/enterprise
  • Available in Excel & PDF
  • Free industry update
    (Within 180 days)
  •   Free report update in next update cycle
    (May 2023 - May 2024)
  • Library
    Membership

  • $999 $ 1,175
    Per User/ Per month/ Billed annually
  • Published Content
    E-access
  • Company Profiles
    E-access
  • Newly Added Content Access
  • 10 PDF
    Downloads
  • 5 Excel Data
    Pack Downloads
  • 250 Company Profiles PDF Downloads
  • Buy Now

*Taxes/Fees, if applicable will be added during checkout. All prices in USD

RELATED REPORTS
 

Why Allied Market Research?


Infallible Methodology

To ensure high-level data integrity, accurate analysis, and impeccable forecasts

Analyst Support

For complete satisfaction

Customization

On-demand customization of scope of the report to exactly meet your needs

TARGETED MARKET VIEW

Targeted market view to provide pertinent information and save time of readers

Get fresh content delivered

Get insights on topics that are crucial for your business. Stay abreast of your interest areas.

Get Industry Data Alerts

Why Allied Market Research?

Infallible Methodology

To ensure high-level data integrity, accurate analysis, and impeccable forecasts

Analyst Support

For complete satisfaction

Customization

On-demand customization of scope of the report to exactly meet your needs

TARGETED MARKET VIEW

Targeted market view to provide pertinent information and save time of readers