
Wood Preservative Market Research, 2033
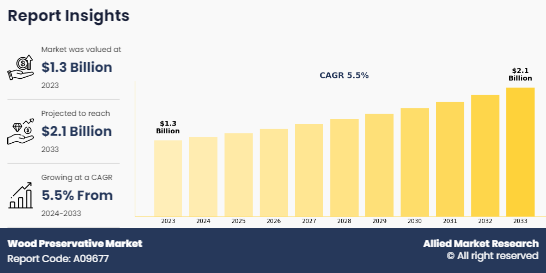
The global wood preservative market size was valued at $1.3 billion in 2023, and is projected to reach $2.1 billion by 2033, growing at a CAGR of 5.5% from 2024 to 2033. Treated wood is widely used in residential construction for applications such as decking, fencing, siding, and roofing. The use of treated wood ensures longevity and reduces maintenance costs, making it a preferred choice for homeowners and builders. In commercial construction, treated wood is used for structural framing, cladding, and decking. The durability and strength provided by treated wood make it suitable for various commercial applications, including office buildings, retail spaces, and industrial facilities. As consumers and industries become more aware of the benefits of using treated wood, the demand for wood preservatives is expected to increase in the future.
Introduction
Wood preservatives are substances applied to wood to protect it from decay, fungi, insects, and other environmental factors that can cause deterioration. These preservatives extend the lifespan of wood and enhance its durability, making it suitable for various applications, including construction, furniture, fencing, and railway sleepers. There are different types of wood preservatives available, and they can be categorized based on their active ingredients and application methods.
Key Takeaways
- The key players in the wood preservative market are BASF SE, Lonza Group, Koppers Inc., Viance, LLC, Remmers Group, Troy Corporation, Borax Inc., Lanxess AG, Dolphin Bay Chemicals, and Kop-Coat, Inc.
- More than 6,765 product literatures, industry releases, annual reports, and other such documents of major industry participants along with authentic industry journals, trade associations' releases, and government websites have been reviewed for generating high-value industry insights.
- The segment analysis of each country in terms of value and volume during the forecast period 2023-2033 is covered in the global wood preservative market report.
Market Dynamics
The construction and infrastructure development sector is a major driver for the wood preservative industry. As per the National Action Plans on Business and Human Rights, the global construction industry spending was expected to reach $10.5 trillion by 2023, with residential construction constituting the largest segment. Prioritizing sustainable practices, ethical conduct, and innovative solutions in construction is essential for advancing Sustainable Development Goals 9 and 11. Goal 9 aims to "Build resilient infrastructure, promote inclusive and sustainable industrialization, and foster innovation," while Goal 11 targets "Making cities and human settlements inclusive, safe, resilient, and sustainable.
Moreover, emerging economies are experiencing a growing demand for housing due to various factors such as population growth, urbanization, and rise in household incomes. As more people seek affordable and quality housing, there is rise in residential construction activities to meet this demand. In residential construction, treated wood is a preferred material owing to its enhanced durability and cost-effectiveness. Treated wood is processed with wood preservatives to protect it from decay, termites, and fungi, thereby extending its lifespan and reducing maintenance costs. The use of treated wood in residential construction leads to a higher demand for wood preservatives. As the construction industry grows in emerging economies, the need for wood preservatives also increases to treat the large quantities of wood used in building homes and other structures.
However, fluctuations in the prices of chemicals, solvents, and wood can lead to increased production costs for manufacturers. Rise in costs of raw materials can significantly impact the profitability of manufacturers, especially when they are unable to pass on the increased costs to consumers due to competitive pricing pressures. Volatile raw material prices can create price instability in the market, making it challenging for manufacturers to maintain consistent pricing strategies. This can lead to fluctuating prices of treated wood products, affecting consumer purchasing decisions and market demand. Nevertheless, innovation and product development are expected to offer lucrative wood preservative market growth opportunities in the coming years.
Segments Overview
The wood preservative market is segmented on the basis of type, end-use, and region. By type, it is categorized into water-based, solvent-based, and oil-based. By end-use, it is categorized into residential, commercial, and industrial. Region-wise, the wood preservative market share is studied across North America, Europe, Asia-Pacific, and LAMEA.

In 2023, the Asia-Pacific region held the largest revenue share in the global wood preservative market, representing approximately two-thirds of its total revenue. This region is expected to continue its market dominance throughout the forecast period, with a projected compound annual growth rate (CAGR) of 5.7% from 2024 to 2033. Several factors drive the use of wood preservatives in the Asia-Pacific region, including rapid urbanization, infrastructure growth, residential construction, and growing awareness of sustainable building methods.

Water-based segment accounted for the largest share in 2023, contributing to more than three-fourths of the global wood preservative market revenue, and is projected to maintain its lead position during the forecast period. This segment is expected to continue leading the market through the forecast period, with a projected compound annual growth rate (CAGR) of 5.4% from 2024 to 2033. Water-based wood preservatives are increasingly preferred due to their eco-friendly nature, safety, and efficacy in safeguarding and improving wood performance across diverse applications. Their advantages include environmental friendliness, easy application, rapid drying, superior performance, longevity, aesthetic appeal, and cost efficiency, making them increasingly popular among contractors, homeowners, and DIY enthusiasts seeking sustainable and high-quality wood treatment options.

In 2023, the residential sector held the largest portion of the global wood preservative market, accounting for more than two-thirds of its total revenue. This segment is expected to maintain its leadership throughout the forecast period, with a projected compound annual growth rate (CAGR) of 5.4% from 2024 to 2033. Wood preservatives play a crucial role in residential construction, upkeep, and remodeling projects by ensuring the longevity, safety, and visual appeal of wooden structures and elements. By shielding wood against decay, fungi, pests, moisture, and other environmental elements, these preservatives assist homeowners in preserving a healthy, secure, and aesthetically pleasing living environment.
Competitive Analysis
The major players operating in the global Wood Preservative Market are BASF SE, Lonza Group, Koppers Inc., Viance, LLC, Remmers Group, Troy Corporation, Borax Inc., Lanxess AG, Dolphin Bay Chemicals, and Kop-Coat, Inc.
Historical Overview of Wood Preservative Market
- Early 19th Century: Copper-based preservatives, such as copper sulfate and copper arsenate, were developed and used to protect wood from decay and insect infestation. These preservatives were widely used in the construction of railway sleepers, fencing, and utility poles.
- Early to Mid-19th Century: Pentachlorophenol (PCP) was introduced as a wood preservative and became popular for treating utility poles, marine pilings, and other outdoor applications due to its effectiveness against decay and insects.
- 20th Century: Chromated Copper Arsenate (CCA) was developed and became one of the most widely used wood preservatives in the 20th century. It is a water-based preservative containing copper, chromium, and arsenic, and it was used for residential, commercial, and agricultural applications.
- Late 20th Century: Alkaline Copper Quaternary (ACQ) and Copper Azole (CA) were developed as alternatives to CCA. These water-based preservatives containing copper and organic azoles became popular due to their effectiveness, safety, and environmental friendliness.
- Early 21st Century: With growing awareness of environmental issues and stricter regulations, there has been a shift towards the development and use of eco-friendly wood preservatives that are less toxic and pose minimal risk to the environment. Natural oils, borates, and other organic-based preservatives have gained popularity as eco-friendly alternatives to traditional wood preservatives.
- 21st Century: Advancements in wood preservation technologies have led to the development of more effective and long-lasting wood preservatives. Innovations in preservative formulations, application methods, and treatment processes have helped to improve the performance, durability, and sustainability of treated wood products.
- Current Trends: Ongoing research and development in wood preservation technologies are focused on enhancing the effectiveness, safety, and environmental sustainability of wood preservatives.
Key Benefits For Stakeholders
- This report provides a quantitative analysis of the market segments, current trends, estimations, and dynamics of the wood preservative market analysis from 2023 to 2033 to identify the prevailing wood preservative market opportunities.
- The market research is offered along with information related to key drivers, restraints, and opportunities.
- Porter's five forces analysis highlights the potency of buyers and suppliers to enable stakeholders make profit-oriented business decisions and strengthen their supplier-buyer network.
- In-depth analysis of the wood preservative market segmentation assists to determine the prevailing market opportunities.
- Major countries in each region are mapped according to their revenue contribution to the global market.
- Market player positioning facilitates benchmarking and provides a clear understanding of the present position of the market players.
- The report includes the analysis of the regional as well as global wood preservative market trends, key players, market segments, application areas, and market growth strategies.
Wood Preservative Market Report Highlights
| Aspects | Details |
| Forecast period | 2023 - 2033 |
| Report Pages | 250 |
| By Type |
|
| By End-use |
|
| By Region |
|
| Key Market Players | Viance, LLC, BASF SE, Dolphin Bay Chemicals, Koppers Inc., Lonza Group AG, Remmers Group, Lanxess AG, Borax Inc., Kop-Coat, Inc., Troy Corporation |
Analyst Review
According to the insights of the CXOs of leading companies, the wood preservatives market is driven by a combination of factors including construction and infrastructure development, increase in demand for treated wood products, growing awareness about wood protection, stringent regulations, technological advancements, urbanization, sustainable construction practices, concerns about wood waste and recycling, economic growth, and expansion of the furniture industry. These drivers are expected to continue fueling the growth of the global wood preservatives market in the coming years. Rise in demand for treated wood products is a significant driver for the wood preservatives market. Treated wood offers enhanced durability, resistance to decay, fungal growth, and insect damage, making it suitable for various applications in construction, landscaping, and outdoor furniture.
Furthermore, the construction and building sector is one of the major consumers of treated wood products. Treated wood is widely used in residential, commercial, and industrial construction for structural framing, decking, fencing, and other applications. Treated wood provides increased lifespan and durability to the structures, reducing maintenance costs and extending the life of the buildings. There is a growing awareness and preference among consumers for using treated wood products due to their benefits such as increased lifespan, durability, and resistance to decay and insect damage. Consumers are willing to invest in treated wood products for their construction and outdoor projects to ensure longevity and reduce maintenance costs.
Moreover, treated wood products, when manufactured using eco-friendly preservatives, offer environmental benefits such as reduced deforestation and carbon footprint compared to alternative materials like steel and concrete. This environmental advantage is driving the adoption of treated wood products by environmentally conscious consumers and industries.
Residential sector is the leading end-user of Wood Preservative Market.
Asia-Pacific is the largest regional market for Wood Preservative.
The wood preservative market is anticipated to experience substantial growth in the upcoming years, driven by construction and infrastructure expansion, increased demand for treated wood products, rising awareness of environmental advantages, and technological innovations in wood preservation.
The wood preservative market was valued at $1.3 billion in 2023, and is estimated to reach $2.1 billion by 2033, growing at a CAGR of 5.5% from 2024 to 2033.
The major players operating in the global Wood Preservative Market are BASF SE, Lonza Group, Koppers Inc., Viance, LLC, Remmers Group, Troy Corporation, Borax Inc. ,Lanxess AG, Dolphin Bay Chemicals, and Kop-Coat, Inc.
Loading Table Of Content...
Loading Research Methodology...

