0
2022
3d Printing Market

3D Printing Market

by Technology (Stereolithography (SLA), Selective laser sintering (SLS), Electron beam melting (EBM), Fused deposition modeling (FDM), Laminated object manufacturing (LOM), Others), by Application (Consumer Electronics, Industrial, Aerospace, Automotive, Healthcare, Defense, Education and research, Others): Global Opportunity Analysis and Industry Forecast, 2020-2030

Report Code: A00145
Mar 2022 | Pages: 312
Tables: 122
Charts: 59
  • Formats*:

  • pdf

    Single User License, Five User
    License & Enterprise User License

  • xls

    Data Pack Excel License

  • ppt

    It comes with the additional cost
    of $2500.00 contact sales.


The global 3d printing market was valued at $13.2 billion in 2020 and is projected to reach $94.0 billion by 2030, growing at a CAGR of 22.1% from 2021 to 2030.

3D printing is a manufacturing technique for creating three-dimensional items from a digital file. 3D printing is used to create objects through additive processes of sequential layers of material. Owing to its great precision and economical use of resources. Further, 3D printing solution such as resin 3d printer, 3d printer filament, and 3d printing service has gained popularity in a variety of sectors for the production of bespoke items. Previously, 3D printing was only used for quick prototyping. However, as technology advances and applications expand, 3D printing is increasingly being utilized for functional testing of prototypes under working settings as well as the creation of final goods. 

The outbreak of COVID-19 has significantly impacted the growth of the 3D printing solution in 2020, owing to significant impact on prime players operating in the 3D printing supply chain. Countries across the globe have suffered major loss in terms of business and revenue, owing to lockdown and lack of availability of raw material across the world. Production and manufacturing sectors globally have been heavily impacted by the outbreak of the COVID-19 disease, which, in turn, led to economic downfall, thereby declining the growth of the 3D printing market in 2020. However, rise in penetration of 3D printing solutions in healthcare sector during COVID-19 has significantly boosted the market growth during pandemic. On the contrary, the market was principally hit by several obstacles created amid the COVID-19 pandemic, such as lack of skilled workforce availability and delay or cancelation of projects due to partial or complete lockdown, globally. Furthermore, surge in adoption of smart infrastructure solutions across automotive, retail, and healthcare sectors is expected to strengthen the market growth in 3D printing.

In addition, 3D printing is a part of additive manufacturing and uses similar techniques such as inkjet printer-albeit in three dimensions. Moreover, the 3D printing method has witnessed a surge in demand across the healthcare, defense, and automotive sector owing to the rise in deployment of 3D technology, thereby driving the market growth.
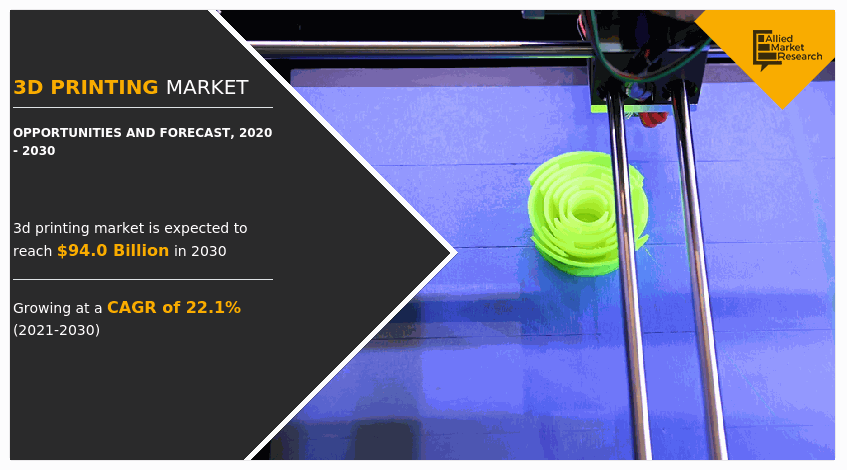
The 3D Printing industry is expected to witness notable growth during the forecast period, owing to a reduction in manufacturing cost and process downtime. Furthermore, government investments in 3D printing projects have driven the growth of the market. Moreover, ease in development in customized products is expected to propel the growth of the 3D Printing market growth during the forecast period.

However, lack of standard process control and limited availability & high cost associated with 3D printing materials are some of the prime factors that restrain the market growth. On the contrary, the rise in utilization of 3D printing in healthcare sectors, applications in various industries, and improved manufacturing processes are expected to provide lucrative opportunities for the growth of the market during the forecast period.

The outbreak of COVID-19 has significantly impacted the growth of the 3D printing market outlook in 2020, owing to a significant impact on prime players operating in the 3D printing supply chain. However, the rise in penetration of 3D printing solutions in the healthcare sector during COVID-19 has significantly boosted the market growth during a pandemic. On the contrary, the market was principally hit by several obstacles created amid the COVID-19 pandemic, such as lack of skilled workforce availability and delay or cancelation of projects due to partial or complete lockdown, globally. Furthermore, the surge in the adoption of smart infrastructure solutions across the automotive, retail, and healthcare sectors is expected to strengthen the 3D printing market size.

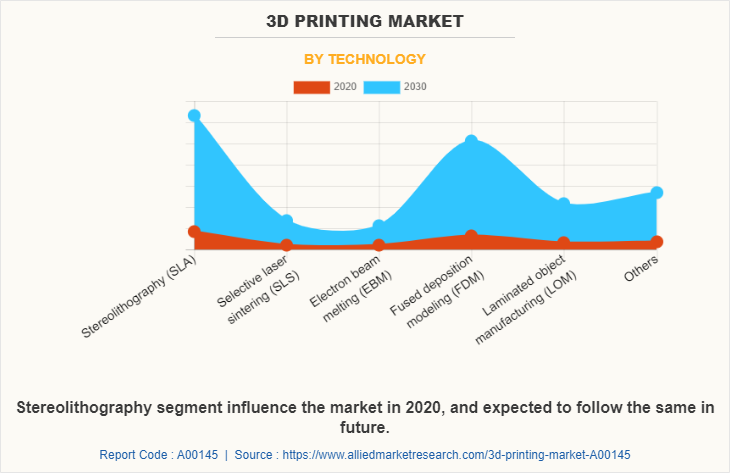
The 3D Printing market is segmented into technology, applications, and country. Depending on the technology, the market is segregated into stereolithography (SLA), selective laser sintering (SLS), electron beam melting (EBM), Fused deposition modeling (FDM), laminated object manufacturing (LOM), and others. The selective laser sintering (SLS) segment dominated the market, in terms of revenue, in 2020, and is expected to follow the same trend during the forecast period.
3D Printing Market

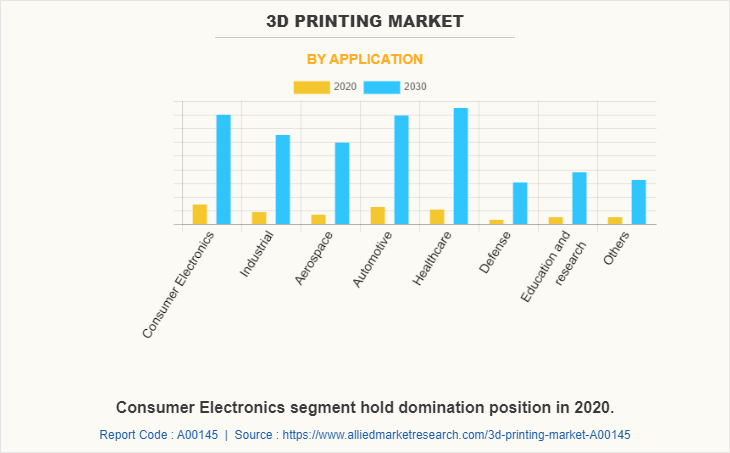
On the basis of application, it is categorized into consumer electronics, industrial, aerospace, automotive, healthcare, defense, education & research, and others. The consumer electronics segment acquired the largest 3D Printing market share in 2020, however, the healthcare segment is expected to grow at a high CAGR from 2021 to 2030.
3D Printing Market

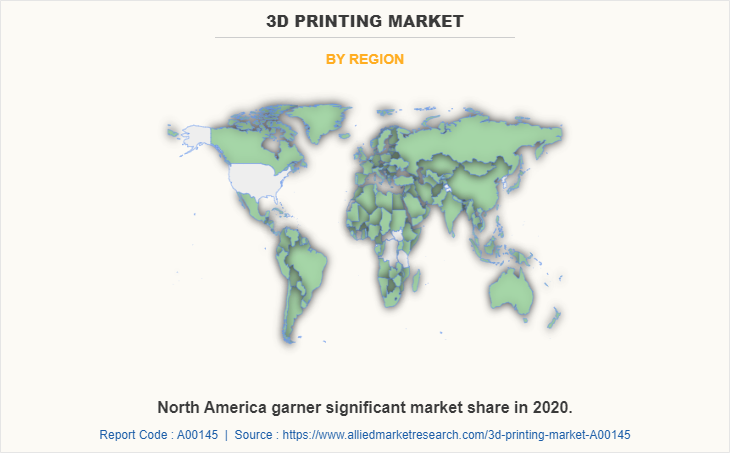
Region-wise, the 3D display market trends are analyzed across North America (the U.S., Canada, and Mexico), Europe (the UK, Germany, France, and the rest of Europe), Asia-Pacific (China, Japan, India, and the rest of the Asia-Pacific), and LAMEA (Latin America, the Middle East, and Africa). North America, specifically U.S., remains a significant participant in the global 3D printing industry This is attributed to the fact that major organizations and government institutions in the country are intensely putting resources into the technology, which is anticipated to open new avenues for the expansion of the market.
3D Printing Market

Key Benefits For Stakeholders

  • This report provides a quantitative analysis of the market segments, current trends, estimations, and dynamics of the 3d printing market analysis from 2020 to 2030 to identify the prevailing 3d printing market opportunities.
  • Market research is offered along with information related to key drivers, restraints, and opportunities.
  • Porter's five forces analysis highlights the potency of buyers and suppliers to enable stakeholders to make profit-oriented business decisions and strengthen their supplier-buyer network.
  • An in-depth analysis of the 3d printing market forecast segmentation assists to determine the prevailing market opportunities.
  • Major countries in each region are mapped according to their revenue contribution to the global market.
  • Market player positioning facilitates benchmarking and provides a clear understanding of the present position of the market players.
  • The report includes the analysis of the regional as well as global 3d printing market trends, key players, market segments, application areas, and market growth strategies.

3D Printing Market Report Highlights

Aspects Details
By Technology
  • Stereolithography (SLA)
  • Selective laser sintering (SLS)
  • Electron beam melting (EBM)
  • Fused deposition modeling (FDM)
  • Laminated object manufacturing (LOM)
  • Others
By Application
  • Consumer Electronics
  • Industrial
  • Aerospace
  • Automotive
  • Healthcare
  • Defense
  • Education and research
  • Others
By Region
  • North America  (U.S., Canada, Mexico)
  • Europe  (United Kingdom, Germany, France, Rest of Europe)
  • Asia-Pacific  (China, Japan, India, Rest of Asia-Pacific)
  • LAMEA  (Latin America, Middle East, Africa)
Key Market Players Arcam AB, Autodesk, Inc., Protolabs, 3D Systems Corp., Stratasys Ltd., Voxelijet AG, ExOne Company, Hoganas AB, Organovo Holdings, Inc., Optomec, Inc
 
  • CHAPTER 1:INTRODUCTION

    • 1.1.Report description

    • 1.2.Key market segments

    • 1.3.Key benefits to the stakeholders

    • 1.4.Research Methodology

      • 1.4.1.Secondary research

      • 1.4.2.Primary research

      • 1.4.3.Analyst tools and models

  • CHAPTER 2:EXECUTIVE SUMMARY

    • 2.1.Key findings of the study

    • 2.2.CXO Perspective

  • CHAPTER 3:MARKET OVERVIEW

    • 3.1.Market definition and scope

    • 3.2.Key findings

      • 3.2.1.Top investment pockets

    • 3.3.Porter’s five forces analysis

    • 3.4.Top player positioning

    • 3.5.Market dynamics

      • 3.5.1.Drivers

      • 3.5.2.Restraints

      • 3.5.3.Opportunities

    • 3.6.COVID-19 Impact Analysis on the market

    • 3.7.Patent Landscape

  • CHAPTER 4: NORTH AMERICA 3D PRINTING MARKET, BY TECHNOLOGY

    • 4.1 Overview

      • 4.1.1 Market size and forecast

    • 4.2 Stereolithography (SLA)

      • 4.2.1 Key market trends, growth factors and opportunities

      • 4.2.2 Market size and forecast, by region

      • 4.2.3 Market analysis by country

    • 4.3 Selective laser sintering (SLS)

      • 4.3.1 Key market trends, growth factors and opportunities

      • 4.3.2 Market size and forecast, by region

      • 4.3.3 Market analysis by country

    • 4.4 Electron beam melting (EBM)

      • 4.4.1 Key market trends, growth factors and opportunities

      • 4.4.2 Market size and forecast, by region

      • 4.4.3 Market analysis by country

    • 4.5 Fused deposition modeling (FDM)

      • 4.5.1 Key market trends, growth factors and opportunities

      • 4.5.2 Market size and forecast, by region

      • 4.5.3 Market analysis by country

    • 4.6 Laminated object manufacturing (LOM)

      • 4.6.1 Key market trends, growth factors and opportunities

      • 4.6.2 Market size and forecast, by region

      • 4.6.3 Market analysis by country

    • 4.7 Others

      • 4.7.1 Key market trends, growth factors and opportunities

      • 4.7.2 Market size and forecast, by region

      • 4.7.3 Market analysis by country

  • CHAPTER 5: NORTH AMERICA 3D PRINTING MARKET, BY APPLICATION

    • 5.1 Overview

      • 5.1.1 Market size and forecast

    • 5.2 Consumer Electronics

      • 5.2.1 Key market trends, growth factors and opportunities

      • 5.2.2 Market size and forecast, by region

      • 5.2.3 Market analysis by country

    • 5.3 Industrial

      • 5.3.1 Key market trends, growth factors and opportunities

      • 5.3.2 Market size and forecast, by region

      • 5.3.3 Market analysis by country

    • 5.4 Aerospace

      • 5.4.1 Key market trends, growth factors and opportunities

      • 5.4.2 Market size and forecast, by region

      • 5.4.3 Market analysis by country

    • 5.5 Automotive

      • 5.5.1 Key market trends, growth factors and opportunities

      • 5.5.2 Market size and forecast, by region

      • 5.5.3 Market analysis by country

    • 5.6 Healthcare

      • 5.6.1 Key market trends, growth factors and opportunities

      • 5.6.2 Market size and forecast, by region

      • 5.6.3 Market analysis by country

    • 5.7 Defense

      • 5.7.1 Key market trends, growth factors and opportunities

      • 5.7.2 Market size and forecast, by region

      • 5.7.3 Market analysis by country

    • 5.8 Education and research

      • 5.8.1 Key market trends, growth factors and opportunities

      • 5.8.2 Market size and forecast, by region

      • 5.8.3 Market analysis by country

    • 5.9 Others

      • 5.9.1 Key market trends, growth factors and opportunities

      • 5.9.2 Market size and forecast, by region

      • 5.9.3 Market analysis by country

  • CHAPTER 6: NORTH AMERICA 3D PRINTING MARKET, BY REGION

    • 6.1 Overview

      • 6.1.1 Market size and forecast

    • 6.2 North America

      • 6.2.1 Key trends and opportunities

      • 6.2.2 North America Market size and forecast, by Technology

      • 6.2.3 North America Market size and forecast, by Application

      • 6.2.4 North America Market size and forecast, by country

        • 6.2.4.1 U.S.
          • 6.2.4.1.1 Market size and forecast, by Technology
          • 6.2.4.1.2 Market size and forecast, by Application
        • 6.2.4.2 Canada
          • 6.2.4.2.1 Market size and forecast, by Technology
          • 6.2.4.2.2 Market size and forecast, by Application
        • 6.2.4.3 Mexico
          • 6.2.4.3.1 Market size and forecast, by Technology
          • 6.2.4.3.2 Market size and forecast, by Application
    • 6.3 Europe

      • 6.3.1 Key trends and opportunities

      • 6.3.2 Europe Market size and forecast, by Technology

      • 6.3.3 Europe Market size and forecast, by Application

      • 6.3.4 Europe Market size and forecast, by country

        • 6.3.4.1 United Kingdom
          • 6.3.4.1.1 Market size and forecast, by Technology
          • 6.3.4.1.2 Market size and forecast, by Application
        • 6.3.4.2 Germany
          • 6.3.4.2.1 Market size and forecast, by Technology
          • 6.3.4.2.2 Market size and forecast, by Application
        • 6.3.4.3 France
          • 6.3.4.3.1 Market size and forecast, by Technology
          • 6.3.4.3.2 Market size and forecast, by Application
        • 6.3.4.4 Rest of Europe
          • 6.3.4.4.1 Market size and forecast, by Technology
          • 6.3.4.4.2 Market size and forecast, by Application
    • 6.4 Asia-Pacific

      • 6.4.1 Key trends and opportunities

      • 6.4.2 Asia-Pacific Market size and forecast, by Technology

      • 6.4.3 Asia-Pacific Market size and forecast, by Application

      • 6.4.4 Asia-Pacific Market size and forecast, by country

        • 6.4.4.1 China
          • 6.4.4.1.1 Market size and forecast, by Technology
          • 6.4.4.1.2 Market size and forecast, by Application
        • 6.4.4.2 Japan
          • 6.4.4.2.1 Market size and forecast, by Technology
          • 6.4.4.2.2 Market size and forecast, by Application
        • 6.4.4.3 India
          • 6.4.4.3.1 Market size and forecast, by Technology
          • 6.4.4.3.2 Market size and forecast, by Application
        • 6.4.4.4 Rest of Asia-Pacific
          • 6.4.4.4.1 Market size and forecast, by Technology
          • 6.4.4.4.2 Market size and forecast, by Application
    • 6.5 LAMEA

      • 6.5.1 Key trends and opportunities

      • 6.5.2 LAMEA Market size and forecast, by Technology

      • 6.5.3 LAMEA Market size and forecast, by Application

      • 6.5.4 LAMEA Market size and forecast, by country

        • 6.5.4.1 Latin America
          • 6.5.4.1.1 Market size and forecast, by Technology
          • 6.5.4.1.2 Market size and forecast, by Application
        • 6.5.4.2 Middle East
          • 6.5.4.2.1 Market size and forecast, by Technology
          • 6.5.4.2.2 Market size and forecast, by Application
        • 6.5.4.3 Africa
          • 6.5.4.3.1 Market size and forecast, by Technology
          • 6.5.4.3.2 Market size and forecast, by Application
  • CHAPTER 7: COMPANY LANDSCAPE

    • 7.1. Introduction

    • 7.2. Top winning strategies

    • 7.3. Product Mapping of Top 10 Player

    • 7.4. Competitive Dashboard

    • 7.5. Competitive Heatmap

    • 7.6. Key developments

  • CHAPTER 8: COMPANY PROFILES

    • 8.1 3D Systems Corp.

      • 8.1.1 Company overview

      • 8.1.2 Company snapshot

      • 8.1.3 Operating business segments

      • 8.1.4 Product portfolio

      • 8.1.5 Business performance

      • 8.1.6 Key strategic moves and developments

    • 8.2 Arcam AB

      • 8.2.1 Company overview

      • 8.2.2 Company snapshot

      • 8.2.3 Operating business segments

      • 8.2.4 Product portfolio

      • 8.2.5 Business performance

      • 8.2.6 Key strategic moves and developments

    • 8.3 Stratasys Ltd.

      • 8.3.1 Company overview

      • 8.3.2 Company snapshot

      • 8.3.3 Operating business segments

      • 8.3.4 Product portfolio

      • 8.3.5 Business performance

      • 8.3.6 Key strategic moves and developments

    • 8.4 Autodesk, Inc.

      • 8.4.1 Company overview

      • 8.4.2 Company snapshot

      • 8.4.3 Operating business segments

      • 8.4.4 Product portfolio

      • 8.4.5 Business performance

      • 8.4.6 Key strategic moves and developments

    • 8.5 Optomec, Inc

      • 8.5.1 Company overview

      • 8.5.2 Company snapshot

      • 8.5.3 Operating business segments

      • 8.5.4 Product portfolio

      • 8.5.5 Business performance

      • 8.5.6 Key strategic moves and developments

    • 8.6 Organovo Holdings, Inc.

      • 8.6.1 Company overview

      • 8.6.2 Company snapshot

      • 8.6.3 Operating business segments

      • 8.6.4 Product portfolio

      • 8.6.5 Business performance

      • 8.6.6 Key strategic moves and developments

    • 8.7 Protolabs

      • 8.7.1 Company overview

      • 8.7.2 Company snapshot

      • 8.7.3 Operating business segments

      • 8.7.4 Product portfolio

      • 8.7.5 Business performance

      • 8.7.6 Key strategic moves and developments

    • 8.8 Voxelijet AG

      • 8.8.1 Company overview

      • 8.8.2 Company snapshot

      • 8.8.3 Operating business segments

      • 8.8.4 Product portfolio

      • 8.8.5 Business performance

      • 8.8.6 Key strategic moves and developments

    • 8.9 Hoganas AB

      • 8.9.1 Company overview

      • 8.9.2 Company snapshot

      • 8.9.3 Operating business segments

      • 8.9.4 Product portfolio

      • 8.9.5 Business performance

      • 8.9.6 Key strategic moves and developments

    • 8.10 ExOne Company

      • 8.10.1 Company overview

      • 8.10.2 Company snapshot

      • 8.10.3 Operating business segments

      • 8.10.4 Product portfolio

      • 8.10.5 Business performance

      • 8.10.6 Key strategic moves and developments

  • LIST OF TABLES

  • TABLE 1. GLOBAL NORTH AMERICA 3D PRINTING MARKET, BY TECHNOLOGY, 2020-2030,($MILLION)
    TABLE 2. NORTH AMERICA 3D PRINTING MARKET REVENUE, FOR STEREOLITHOGRAPHY (SLA), BY REGION , 2020-2030,($MILLION)
    TABLE 3. NORTH AMERICA 3D PRINTING MARKET STEREOLITHOGRAPHY (SLA) BY COUNTRY, 2020-2030,($MILLION)
    TABLE 4. NORTH AMERICA 3D PRINTING MARKET REVENUE, FOR SELECTIVE LASER SINTERING (SLS), BY REGION , 2020-2030,($MILLION)
    TABLE 5. NORTH AMERICA 3D PRINTING MARKET SELECTIVE LASER SINTERING (SLS) BY COUNTRY, 2020-2030,($MILLION)
    TABLE 6. NORTH AMERICA 3D PRINTING MARKET REVENUE, FOR ELECTRON BEAM MELTING (EBM), BY REGION , 2020-2030,($MILLION)
    TABLE 7. NORTH AMERICA 3D PRINTING MARKET ELECTRON BEAM MELTING (EBM) BY COUNTRY, 2020-2030,($MILLION)
    TABLE 8. NORTH AMERICA 3D PRINTING MARKET REVENUE, FOR FUSED DEPOSITION MODELING (FDM), BY REGION , 2020-2030,($MILLION)
    TABLE 9. NORTH AMERICA 3D PRINTING MARKET FUSED DEPOSITION MODELING (FDM) BY COUNTRY, 2020-2030,($MILLION)
    TABLE 10. NORTH AMERICA 3D PRINTING MARKET REVENUE, FOR LAMINATED OBJECT MANUFACTURING (LOM), BY REGION , 2020-2030,($MILLION)
    TABLE 11. NORTH AMERICA 3D PRINTING MARKET LAMINATED OBJECT MANUFACTURING (LOM) BY COUNTRY, 2020-2030,($MILLION)
    TABLE 12. NORTH AMERICA 3D PRINTING MARKET REVENUE, FOR OTHERS, BY REGION , 2020-2030,($MILLION)
    TABLE 13. NORTH AMERICA 3D PRINTING MARKET OTHERS BY COUNTRY, 2020-2030,($MILLION)
    TABLE 14. GLOBAL NORTH AMERICA 3D PRINTING MARKET, BY APPLICATION, 2020-2030,($MILLION)
    TABLE 15. NORTH AMERICA 3D PRINTING MARKET REVENUE, FOR CONSUMER ELECTRONICS, BY REGION , 2020-2030,($MILLION)
    TABLE 16. NORTH AMERICA 3D PRINTING MARKET CONSUMER ELECTRONICS BY COUNTRY, 2020-2030,($MILLION)
    TABLE 17. NORTH AMERICA 3D PRINTING MARKET REVENUE, FOR INDUSTRIAL, BY REGION , 2020-2030,($MILLION)
    TABLE 18. NORTH AMERICA 3D PRINTING MARKET INDUSTRIAL BY COUNTRY, 2020-2030,($MILLION)
    TABLE 19. NORTH AMERICA 3D PRINTING MARKET REVENUE, FOR AEROSPACE, BY REGION , 2020-2030,($MILLION)
    TABLE 20. NORTH AMERICA 3D PRINTING MARKET AEROSPACE BY COUNTRY, 2020-2030,($MILLION)
    TABLE 21. NORTH AMERICA 3D PRINTING MARKET REVENUE, FOR AUTOMOTIVE, BY REGION , 2020-2030,($MILLION)
    TABLE 22. NORTH AMERICA 3D PRINTING MARKET AUTOMOTIVE BY COUNTRY, 2020-2030,($MILLION)
    TABLE 23. NORTH AMERICA 3D PRINTING MARKET REVENUE, FOR HEALTHCARE, BY REGION , 2020-2030,($MILLION)
    TABLE 24. NORTH AMERICA 3D PRINTING MARKET HEALTHCARE BY COUNTRY, 2020-2030,($MILLION)
    TABLE 25. NORTH AMERICA 3D PRINTING MARKET REVENUE, FOR DEFENSE, BY REGION , 2020-2030,($MILLION)
    TABLE 26. NORTH AMERICA 3D PRINTING MARKET DEFENSE BY COUNTRY, 2020-2030,($MILLION)
    TABLE 27. NORTH AMERICA 3D PRINTING MARKET REVENUE, FOR EDUCATION AND RESEARCH, BY REGION , 2020-2030,($MILLION)
    TABLE 28. NORTH AMERICA 3D PRINTING MARKET EDUCATION AND RESEARCH BY COUNTRY, 2020-2030,($MILLION)
    TABLE 29. NORTH AMERICA 3D PRINTING MARKET REVENUE, FOR OTHERS, BY REGION , 2020-2030,($MILLION)
    TABLE 30. NORTH AMERICA 3D PRINTING MARKET OTHERS BY COUNTRY, 2020-2030,($MILLION)
    TABLE 31. NORTH AMERICA 3D PRINTING MARKET, BY REGION, 2020-2030,($MILLION)
    TABLE 32. NORTH AMERICA NORTH AMERICA 3D PRINTING MARKET, BY TECHNOLOGY, 2020-2030,($MILLION)
    TABLE 33. NORTH AMERICA NORTH AMERICA 3D PRINTING MARKET, BY APPLICATION, 2020-2030,($MILLION)
    TABLE 34. NORTH AMERICA NORTH AMERICA 3D PRINTING MARKET, BY COUNTRY, 2020-2030,($MILLION)
    TABLE 35. U.S. NORTH AMERICA 3D PRINTING MARKET BY TECHNOLOGY 2020-2030,($MILLION)
    TABLE 36. U.S. NORTH AMERICA 3D PRINTING MARKET BY APPLICATION 2020-2030,($MILLION)
    TABLE 37. CANADA NORTH AMERICA 3D PRINTING MARKET BY TECHNOLOGY 2020-2030,($MILLION)
    TABLE 38. CANADA NORTH AMERICA 3D PRINTING MARKET BY APPLICATION 2020-2030,($MILLION)
    TABLE 39. MEXICO NORTH AMERICA 3D PRINTING MARKET BY TECHNOLOGY 2020-2030,($MILLION)
    TABLE 40. MEXICO NORTH AMERICA 3D PRINTING MARKET BY APPLICATION 2020-2030,($MILLION)
    TABLE 41. EUROPE NORTH AMERICA 3D PRINTING MARKET, BY TECHNOLOGY, 2020-2030,($MILLION)
    TABLE 42. EUROPE NORTH AMERICA 3D PRINTING MARKET, BY APPLICATION, 2020-2030,($MILLION)
    TABLE 43. EUROPE NORTH AMERICA 3D PRINTING MARKET, BY COUNTRY, 2020-2030,($MILLION)
    TABLE 44. UNITED KINGDOM NORTH AMERICA 3D PRINTING MARKET BY TECHNOLOGY 2020-2030,($MILLION)
    TABLE 45. UNITED KINGDOM NORTH AMERICA 3D PRINTING MARKET BY APPLICATION 2020-2030,($MILLION)
    TABLE 46. GERMANY NORTH AMERICA 3D PRINTING MARKET BY TECHNOLOGY 2020-2030,($MILLION)
    TABLE 47. GERMANY NORTH AMERICA 3D PRINTING MARKET BY APPLICATION 2020-2030,($MILLION)
    TABLE 48. FRANCE NORTH AMERICA 3D PRINTING MARKET BY TECHNOLOGY 2020-2030,($MILLION)
    TABLE 49. FRANCE NORTH AMERICA 3D PRINTING MARKET BY APPLICATION 2020-2030,($MILLION)
    TABLE 50. REST OF EUROPE NORTH AMERICA 3D PRINTING MARKET BY TECHNOLOGY 2020-2030,($MILLION)
    TABLE 51. REST OF EUROPE NORTH AMERICA 3D PRINTING MARKET BY APPLICATION 2020-2030,($MILLION)
    TABLE 52. ASIA-PACIFIC NORTH AMERICA 3D PRINTING MARKET, BY TECHNOLOGY, 2020-2030,($MILLION)
    TABLE 53. ASIA-PACIFIC NORTH AMERICA 3D PRINTING MARKET, BY APPLICATION, 2020-2030,($MILLION)
    TABLE 54. ASIA-PACIFIC NORTH AMERICA 3D PRINTING MARKET, BY COUNTRY, 2020-2030,($MILLION)
    TABLE 55. CHINA NORTH AMERICA 3D PRINTING MARKET BY TECHNOLOGY 2020-2030,($MILLION)
    TABLE 56. CHINA NORTH AMERICA 3D PRINTING MARKET BY APPLICATION 2020-2030,($MILLION)
    TABLE 57. JAPAN NORTH AMERICA 3D PRINTING MARKET BY TECHNOLOGY 2020-2030,($MILLION)
    TABLE 58. JAPAN NORTH AMERICA 3D PRINTING MARKET BY APPLICATION 2020-2030,($MILLION)
    TABLE 59. INDIA NORTH AMERICA 3D PRINTING MARKET BY TECHNOLOGY 2020-2030,($MILLION)
    TABLE 60. INDIA NORTH AMERICA 3D PRINTING MARKET BY APPLICATION 2020-2030,($MILLION)
    TABLE 61. REST OF ASIA-PACIFIC NORTH AMERICA 3D PRINTING MARKET BY TECHNOLOGY 2020-2030,($MILLION)
    TABLE 62. REST OF ASIA-PACIFIC NORTH AMERICA 3D PRINTING MARKET BY APPLICATION 2020-2030,($MILLION)
    TABLE 63. LAMEA NORTH AMERICA 3D PRINTING MARKET, BY TECHNOLOGY, 2020-2030,($MILLION)
    TABLE 64. LAMEA NORTH AMERICA 3D PRINTING MARKET, BY APPLICATION, 2020-2030,($MILLION)
    TABLE 65. LAMEA NORTH AMERICA 3D PRINTING MARKET, BY COUNTRY, 2020-2030,($MILLION)
    TABLE 66. LATIN AMERICA NORTH AMERICA 3D PRINTING MARKET BY TECHNOLOGY 2020-2030,($MILLION)
    TABLE 67. LATIN AMERICA NORTH AMERICA 3D PRINTING MARKET BY APPLICATION 2020-2030,($MILLION)
    TABLE 68. MIDDLE EAST NORTH AMERICA 3D PRINTING MARKET BY TECHNOLOGY 2020-2030,($MILLION)
    TABLE 69. MIDDLE EAST NORTH AMERICA 3D PRINTING MARKET BY APPLICATION 2020-2030,($MILLION)
    TABLE 70. AFRICA NORTH AMERICA 3D PRINTING MARKET BY TECHNOLOGY 2020-2030,($MILLION)
    TABLE 71. AFRICA NORTH AMERICA 3D PRINTING MARKET BY APPLICATION 2020-2030,($MILLION)
    TABLE 72.3D SYSTEMS CORP.: COMPANY SNAPSHOT
    TABLE 73.3D SYSTEMS CORP.: OPERATING SEGMENTS
    TABLE 74.3D SYSTEMS CORP.: PRODUCT PORTFOLIO
    TABLE 75.3D SYSTEMS CORP.: NET SALES,
    TABLE 76.3D SYSTEMS CORP.: KEY STRATERGIES
    TABLE 77.ARCAM AB: COMPANY SNAPSHOT
    TABLE 78.ARCAM AB: OPERATING SEGMENTS
    TABLE 79.ARCAM AB: PRODUCT PORTFOLIO
    TABLE 80.ARCAM AB: NET SALES,
    TABLE 81.ARCAM AB: KEY STRATERGIES
    TABLE 82.STRATASYS LTD.: COMPANY SNAPSHOT
    TABLE 83.STRATASYS LTD.: OPERATING SEGMENTS
    TABLE 84.STRATASYS LTD.: PRODUCT PORTFOLIO
    TABLE 85.STRATASYS LTD.: NET SALES,
    TABLE 86.STRATASYS LTD.: KEY STRATERGIES
    TABLE 87.AUTODESK, INC.: COMPANY SNAPSHOT
    TABLE 88.AUTODESK, INC.: OPERATING SEGMENTS
    TABLE 89.AUTODESK, INC.: PRODUCT PORTFOLIO
    TABLE 90.AUTODESK, INC.: NET SALES,
    TABLE 91.AUTODESK, INC.: KEY STRATERGIES
    TABLE 92.OPTOMEC, INC: COMPANY SNAPSHOT
    TABLE 93.OPTOMEC, INC: OPERATING SEGMENTS
    TABLE 94.OPTOMEC, INC: PRODUCT PORTFOLIO
    TABLE 95.OPTOMEC, INC: NET SALES,
    TABLE 96.OPTOMEC, INC: KEY STRATERGIES
    TABLE 97.ORGANOVO HOLDINGS, INC.: COMPANY SNAPSHOT
    TABLE 98.ORGANOVO HOLDINGS, INC.: OPERATING SEGMENTS
    TABLE 99.ORGANOVO HOLDINGS, INC.: PRODUCT PORTFOLIO
    TABLE 100.ORGANOVO HOLDINGS, INC.: NET SALES,
    TABLE 101.ORGANOVO HOLDINGS, INC.: KEY STRATERGIES
    TABLE 102.PROTOLABS: COMPANY SNAPSHOT
    TABLE 103.PROTOLABS: OPERATING SEGMENTS
    TABLE 104.PROTOLABS: PRODUCT PORTFOLIO
    TABLE 105.PROTOLABS: NET SALES,
    TABLE 106.PROTOLABS: KEY STRATERGIES
    TABLE 107.VOXELIJET AG: COMPANY SNAPSHOT
    TABLE 108.VOXELIJET AG: OPERATING SEGMENTS
    TABLE 109.VOXELIJET AG: PRODUCT PORTFOLIO
    TABLE 110.VOXELIJET AG: NET SALES,
    TABLE 111.VOXELIJET AG: KEY STRATERGIES
    TABLE 112.HOGANAS AB: COMPANY SNAPSHOT
    TABLE 113.HOGANAS AB: OPERATING SEGMENTS
    TABLE 114.HOGANAS AB: PRODUCT PORTFOLIO
    TABLE 115.HOGANAS AB: NET SALES,
    TABLE 116.HOGANAS AB: KEY STRATERGIES
    TABLE 117.EXONE COMPANY: COMPANY SNAPSHOT
    TABLE 118.EXONE COMPANY: OPERATING SEGMENTS
    TABLE 119.EXONE COMPANY: PRODUCT PORTFOLIO
    TABLE 120.EXONE COMPANY: NET SALES,
    TABLE 121.EXONE COMPANY: KEY STRATERGIES
  • LIST OF FIGURES

  • FIGURE 1.NORTH AMERICA 3D PRINTING MARKET SEGMENTATION
    FIGURE 2.NORTH AMERICA 3D PRINTING MARKET,2020-2030
    FIGURE 3.NORTH AMERICA 3D PRINTING MARKET,2020-2030
    FIGURE 4. TOP INVESTMENT POCKETS, BY REGION
    FIGURE 5.PORTER FIVE-1
    FIGURE 6.PORTER FIVE-2
    FIGURE 7.PORTER FIVE-3
    FIGURE 8.PORTER FIVE-4
    FIGURE 9.PORTER FIVE-5
    FIGURE 10.TOP PLAYER POSITIONING
    FIGURE 11.NORTH AMERICA 3D PRINTING MARKET:DRIVERS, RESTRAINTS AND OPPORTUNITIES
    FIGURE 12.PATENT ANALYSIS BY COMPANY
    FIGURE 13.PATENT ANALYSIS BY COUNTRY
    FIGURE 13.NORTH AMERICA 3D PRINTING MARKET,BY TECHNOLOGY,2020(%)
    FIGURE 14.COMPARATIVE SHARE ANALYSIS OF STEREOLITHOGRAPHY (SLA) NORTH AMERICA 3D PRINTING MARKET,2020-2030(%)
    FIGURE 15.COMPARATIVE SHARE ANALYSIS OF SELECTIVE LASER SINTERING (SLS) NORTH AMERICA 3D PRINTING MARKET,2020-2030(%)
    FIGURE 16.COMPARATIVE SHARE ANALYSIS OF ELECTRON BEAM MELTING (EBM) NORTH AMERICA 3D PRINTING MARKET,2020-2030(%)
    FIGURE 17.COMPARATIVE SHARE ANALYSIS OF FUSED DEPOSITION MODELING (FDM) NORTH AMERICA 3D PRINTING MARKET,2020-2030(%)
    FIGURE 18.COMPARATIVE SHARE ANALYSIS OF LAMINATED OBJECT MANUFACTURING (LOM) NORTH AMERICA 3D PRINTING MARKET,2020-2030(%)
    FIGURE 19.COMPARATIVE SHARE ANALYSIS OF OTHERS NORTH AMERICA 3D PRINTING MARKET,2020-2030(%)
    FIGURE 20.NORTH AMERICA 3D PRINTING MARKET,BY APPLICATION,2020(%)
    FIGURE 21.COMPARATIVE SHARE ANALYSIS OF CONSUMER ELECTRONICS NORTH AMERICA 3D PRINTING MARKET,2020-2030(%)
    FIGURE 22.COMPARATIVE SHARE ANALYSIS OF INDUSTRIAL NORTH AMERICA 3D PRINTING MARKET,2020-2030(%)
    FIGURE 23.COMPARATIVE SHARE ANALYSIS OF AEROSPACE NORTH AMERICA 3D PRINTING MARKET,2020-2030(%)
    FIGURE 24.COMPARATIVE SHARE ANALYSIS OF AUTOMOTIVE NORTH AMERICA 3D PRINTING MARKET,2020-2030(%)
    FIGURE 25.COMPARATIVE SHARE ANALYSIS OF HEALTHCARE NORTH AMERICA 3D PRINTING MARKET,2020-2030(%)
    FIGURE 26.COMPARATIVE SHARE ANALYSIS OF DEFENSE NORTH AMERICA 3D PRINTING MARKET,2020-2030(%)
    FIGURE 27.COMPARATIVE SHARE ANALYSIS OF EDUCATION AND RESEARCH NORTH AMERICA 3D PRINTING MARKET,2020-2030(%)
    FIGURE 28.COMPARATIVE SHARE ANALYSIS OF OTHERS NORTH AMERICA 3D PRINTING MARKET,2020-2030(%)
    FIGURE 29.NORTH AMERICA 3D PRINTING MARKET BY REGION,2020
    FIGURE 30.U.S. NORTH AMERICA 3D PRINTING MARKET,2020-2030($MILLION)
    FIGURE 31.CANADA NORTH AMERICA 3D PRINTING MARKET,2020-2030($MILLION)
    FIGURE 32.MEXICO NORTH AMERICA 3D PRINTING MARKET,2020-2030($MILLION)
    FIGURE 33.UNITED KINGDOM NORTH AMERICA 3D PRINTING MARKET,2020-2030($MILLION)
    FIGURE 34.GERMANY NORTH AMERICA 3D PRINTING MARKET,2020-2030($MILLION)
    FIGURE 35.FRANCE NORTH AMERICA 3D PRINTING MARKET,2020-2030($MILLION)
    FIGURE 36.REST OF EUROPE NORTH AMERICA 3D PRINTING MARKET,2020-2030($MILLION)
    FIGURE 37.CHINA NORTH AMERICA 3D PRINTING MARKET,2020-2030($MILLION)
    FIGURE 38.JAPAN NORTH AMERICA 3D PRINTING MARKET,2020-2030($MILLION)
    FIGURE 39.INDIA NORTH AMERICA 3D PRINTING MARKET,2020-2030($MILLION)
    FIGURE 40.REST OF ASIA-PACIFIC NORTH AMERICA 3D PRINTING MARKET,2020-2030($MILLION)
    FIGURE 41.LATIN AMERICA NORTH AMERICA 3D PRINTING MARKET,2020-2030($MILLION)
    FIGURE 42.MIDDLE EAST NORTH AMERICA 3D PRINTING MARKET,2020-2030($MILLION)
    FIGURE 43.AFRICA NORTH AMERICA 3D PRINTING MARKET,2020-2030($MILLION)
    FIGURE 44. TOP WINNING STRATEGIES, BY YEAR
    FIGURE 45. TOP WINNING STRATEGIES, BY DEVELOPMENT
    FIGURE 46. TOP WINNING STRATEGIES, BY COMPANY
    FIGURE 47.PRODUCT MAPPING OF TOP 10 PLAYERS
    FIGURE 48.COMPETITIVE DASHBOARD
    FIGURE 49.COMPETITIVE HEATMAP OF TOP 10 KEY PLAYERS
    FIGURE 50.3D SYSTEMS CORP..: NET SALES ,($MILLION)
    FIGURE 51.ARCAM AB.: NET SALES ,($MILLION)
    FIGURE 52.STRATASYS LTD..: NET SALES ,($MILLION)
    FIGURE 53.AUTODESK, INC..: NET SALES ,($MILLION)
    FIGURE 54.OPTOMEC, INC.: NET SALES ,($MILLION)
    FIGURE 55.ORGANOVO HOLDINGS, INC..: NET SALES ,($MILLION)
    FIGURE 56.PROTOLABS.: NET SALES ,($MILLION)
    FIGURE 57.VOXELIJET AG.: NET SALES ,($MILLION)
    FIGURE 58.HOGANAS AB.: NET SALES ,($MILLION)
    FIGURE 59.EXONE COMPANY.: NET SALES ,($MILLION)


3D printing is an enhanced process designed to use layers of materials to build 3D equipment or object. Furthermore, 3D printing is intended to enable users to develop a complex shape using less material than traditional manufacturing methods. In addition, the surge in demand for AI, the IoT, and smart infrastructure solutions across the automotive, consumer electronics, and healthcare sectors are expected to drive the growth of the market across North America in the coming years.

The 3D printing market is highly competitive owing to the strong presence of existing vendors. 3D printing vendors who have access to extensive technical and financial resources are anticipated to gain a competitive edge over their rivals, as they have the capacity to cater to the market requirements. The competitive environment in this market is expected to further intensify with rise in technological innovations, product extensions, and different strategies adopted by key vendors.

The surge in the adoption of 3D printing in the healthcare sector, owing to the emergence of COVID-19 has significantly boosted the growth of 3D printing solutions. Moreover, prime economies, such as the U.S. and Canada, are planning to develop and deploy next-generation 3D printing solutions across various sectors. For instance, in February 2022, AM-giant 3D Systems Inc. announced the acquisition of pellet extruding machine company Titan Robotics LLC, which is anticipated to provide lucrative opportunities for market growth.

Among the analyzed regions, the U.S.exhibits the highest adoption rate of 3D printing solutions. On the other hand, North America is expected to grow at a faster pace, due to emerging countries, such as Mexico, investing in these technologies.

Globally, various key players and government agencies operating in North America are investing in 3D printing solutions to make them compatible with various industrial platforms. For instance,in2019, according to a report by New Story, a nonprofit organization based in Mexico, announced the development of the world’s first 3D printed community. The NPO has officially revealed the first set of 3D printed homes in Mexico, which is showcasing lucrative growth opportunities for market growth. 

The key players profiled in the report include 3D Systems, Arcam AB, Autodesk Inc., Stratasys Ltd., The ExOne Company, Optomec, Inc., Organovo Holdings, Inc., Protolabs, Voxeljit AG, and Hoganas AB.

PURCHASE OPTIONS

Call or Email us

U.S.-Canada Toll-free: +1-800-792-5285
Int'l : +1-503-894-6022
Europe : +44-845-528-1300
Email : help@alliedmarketresearch.com
 
FREQUENTLY ASKED QUESTIONS?

A. The rise in the utilization of 3D printing solutions in the manufacturing and construction sector is forecast to propel the market in the coming years.

A. Consumer electronics is the leading application of the 3D Printing Market in 2020.

A. 3D systems, Protolabs, Voxeljit AG, and Arcam AB, Autodesk Inc are some of the key players in the global 3D printing market.

A. North America, specifically U.S., remains a significant participant in the global 3D printing industry.

A. The 3D Printing market was valued at $13.22 billion in 2020.

Looking for Customization?

 Customization Request

Have a Question?

 Speak with Analyst

Any Confusion?

 Inquire Before Buying

Have a glance of the Report

  Request Sample
RELATED TAGS

Purchase Full Report of
3d Printing Market

Start reading instantly.
This Report and over 68,094+ more Reports, Available with Avenue Library. T&C*.

  • Online Only
  • $3,456
  • Online cloud access only
  • Restricted print, copy, paste & download
  • Read only
  • Free industry update
    (Within 180 days)
  • Free report update in next update cycle
    (Mar 2023 - Mar 2024)
  • Data Pack
  • $3,840
  • Restricted to one authorized user
  • One print only
  • Available in
    Excel
  • Free industry update
    (Within 180 days)
  •   Free report update in next update cycle
    (Mar 2023 - Mar 2024)
  • Single User
  • $5,769
  • Restricted to one authorized user
  • One print only
  • Available in
    PDF
  • Free industry update
    (Within 180 days)
  •   Free report update in next update cycle
    (Mar 2023 - Mar 2024)
  • Five Users
  • $6,450
  • Limited to five authorized users
  • Print upto five copies
  • Available in
    PDF
  • Free industry update
    (Within 180 days)
  •   Free report update in next update cycle
    (Mar 2023 - Mar 2024)
  • Enterprise
    License/PDF

  • $10,995
  • Unlimited
    within
    company/enterprise
  • Available in Excel & PDF
  • Free industry update
    (Within 180 days)
  •   Free report update in next update cycle
    (Mar 2023 - Mar 2024)
  • Library
    Membership

  • $999 $ 1,175
    Per User/ Per month/ Billed annually
  • Published Content
    E-access
  • Company Profiles
    E-access
  • Newly Added Content Access
  • 10 PDF
    Downloads
  • 5 Excel Data
    Pack Downloads
  • 250 Company Profiles PDF Downloads
  • Buy Now

*Taxes/Fees, if applicable will be added during checkout. All prices in USD

RELATED REPORTS
 

Why Allied Market Research?


Infallible Methodology

To ensure high-level data integrity, accurate analysis, and impeccable forecasts

Analyst Support

For complete satisfaction

Customization

On-demand customization of scope of the report to exactly meet your needs

TARGETED MARKET VIEW

Targeted market view to provide pertinent information and save time of readers

Get fresh content delivered

Get insights on topics that are crucial for your business. Stay abreast of your interest areas.

Get Industry Data Alerts

Why Allied Market Research?

Infallible Methodology

To ensure high-level data integrity, accurate analysis, and impeccable forecasts

Analyst Support

For complete satisfaction

Customization

On-demand customization of scope of the report to exactly meet your needs

TARGETED MARKET VIEW

Targeted market view to provide pertinent information and save time of readers