0
New
New
2023
Iot Monetization Market

IoT Monetization Market

by Component (Solution, Service), by Business Function (Marketing and Sales, IT, Finance, Supply Chain, Operations), by Organization Size (Large Enterprises, Small and Medium sized Enterprises), by Industry Vertical (Retail, IT and Telecom, Manufacturing, Transportation and Logistics, Healthcare, BFSI, Energy and Utilities, Others): Global Opportunity Analysis and Industry Forecast, 2023-2032

Report Code: A03954
May 2023 | Pages: 405
Tables: 151
Charts: 90
  • Formats*:

  • pdf

    Single User License, Five User
    License & Enterprise User License

  • xls

    Data Pack Excel License

  • ppt

    It comes with the additional cost
    of $2500.00 contact sales.


IoT Monetization Market Research, 2032

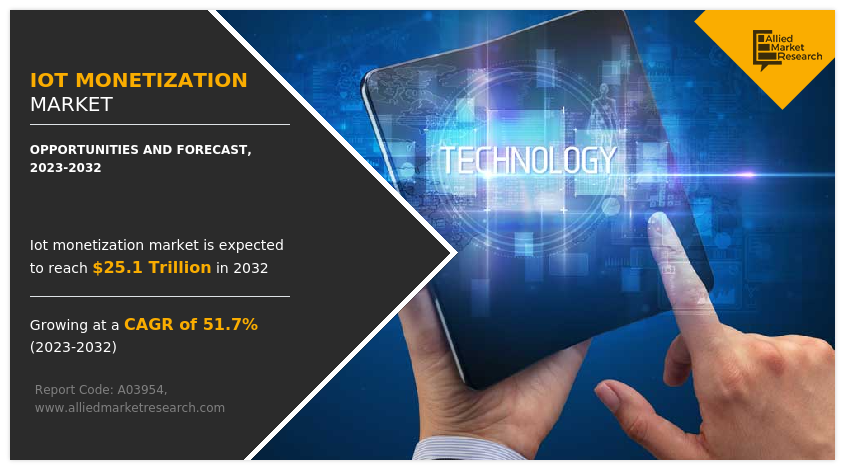
The global iot monetization market was valued at $396.6 billion in 2022, and is projected to reach $25.1 trillion by 2032, growing at a CAGR of 51.7% from 2023 to 2032.

The COVID-19 pandemic accelerated digital transformation initiatives across industries, creating opportunities for IoT monetization. Businesses sought to optimize operations, improve supply chain resilience, and enhance customer experiences through the adoption of IoT-enabled applications and services. This surge in IoT implementation opened avenues for IoT platform providers, solution developers, and service providers to monetize their offerings and provide valuable solutions to customers.

Internet of Things (IoT) monetization is a process that generates revenue from IoT-enabled products and services. Owing to the growth in dependence of the users on the IoT-based products and solutions, the companies charge the users for some extra features or for the entire product as a service. With the beginning of the Internet era along with increase in advancements in technology, almost every device is now interconnected to each other. In addition, due to the emergence of the IoT, numerous offices as well as homes have become smart and are operating through these connected devices. Also, rise in usage of smart devices such as tablets and smartphones are expected to fuel the global IoT monetization market growth.

Rise in adoption of cloud platforms and increase in internet connectivity are the major factors that drive the growth of the global IoT monetization market. In addition, surge in use of consumer electronics devices is expected to fuel the growth of the global IoT monetization market trends. However, lack of IoT standards across platforms and rise in privacy as well as security concerns are the major factors that impede the growth of the global market. Also, according to a Capgemini research report, 70% of enterprises do not get service revenues from their IoT products. Companies that want to generate revenue from IoT need to convert the information from smart and connected products into services by using the product's data stream to involve customers with additional services, or by offering the entire product as a service, which is expected to provide lucrative opportunities for the growth of the global market. Furthermore, an increase in number of smart lighting and smart city projects is anticipated to provide lucrative growth opportunities for the global IoT monetization market in the upcoming years.
IoT Monetization Market

The iot monetization market is segmented into industry vertical, component, business cunction and organization size.

Segment Review

The IoT monetization market is segmented into component, organization size, industry vertical, business functions, and region. In terms of component, the market is bifurcated into solutions and service. Based on organization size, it is classified into large enterprises and small & medium sized enterprises. According to business function, the market is classified into marketing & sales, IT, finance, supply chain, and operations. As per industry vertical, it is divided into retail, IT & telecom, manufacturing, transportation & logistics, healthcare, BFSI, energy & utilities, and others. Region wise, it is analyzed across North America, Europe, Asia-Pacific, and LAMEA.
IoT Monetization Market

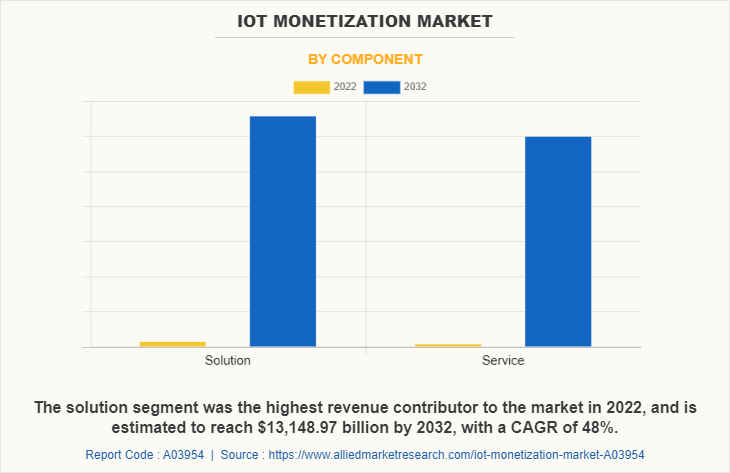
On the basis of component, the global IoT monetization market share was dominated by the solution segment in 2022 and is expected to maintain its dominance in the upcoming years. Owing to advances in technologies enabling IoT monetization to transform industries globally, from BFSI, to manufacturing, healthcare, and others, are anticipated to propel the growth of the market in the coming years. However, the service segment is expected to witness the highest growth, as IoT monetization service reduce the time and costs associated with optimizing systems in the initial phase of deployment.
IoT Monetization Market

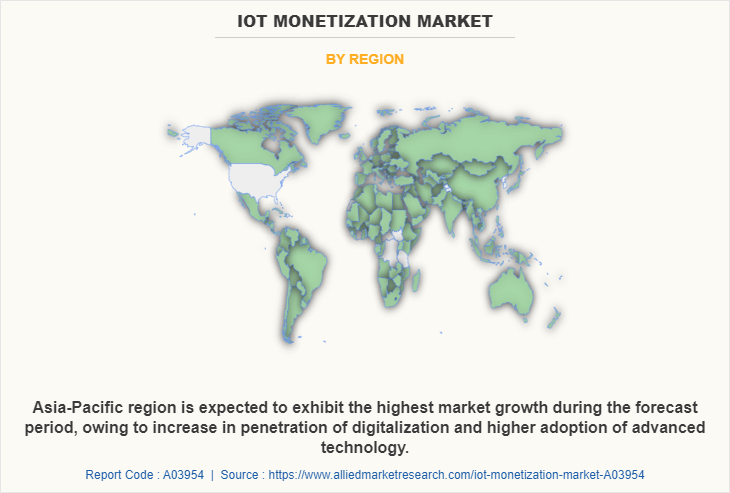
By region, North America dominated the market share in 2022 for the IoT monetization market. The increasing investments in advanced technologies such as cloud-based services, artificial intelligence (AI), machine learning (ML), business analytics solution, and IoT to improve businesses and customer experience are anticipated to propel the growth of the IoT monetization market. However, Asia-Pacific is expected to exhibit the highest growth during the forecast period. This is attributed to the increase in penetration of digitalization and higher adoption of advanced technology which are expected to provide lucrative growth opportunities for the market in this region.

COVID-19 Impact Analysis

The COVID-19 pandemic has had a significant impact on the IoT monetization industry. While some sectors experienced challenges, others witnessed opportunities for growth and innovation. One of the positive impacts of the pandemic on the IoT monetization market was the increased demand for remote monitoring and automation solutions. With restrictions on physical access and the need for social distancing, industries such as healthcare, manufacturing, and logistics sought IoT technologies to enable remote monitoring of equipment, processes, and assets. This drives the adoption of IoT solutions that facilitates real-time data collection, analytics, and control, allowing businesses to ensure operational continuity and optimize efficiency even with limited on-site personnel.

Additionally, the pandemic accelerated digital transformation initiatives across industries, further fueling the adoption of IoT solutions. As businesses looked to adapt to the changing landscape, they increasingly turned to IoT-enabled applications and services to optimize operations, improve supply chain resilience, and enhance customer experiences. This surge in IoT implementation created monetization opportunities for IoT platform providers, solution developers, and service providers. However, the COVID-19 pandemic also posed challenges to the IoT monetization industry. Disruptions in supply chains and manufacturing processes impacted the production and deployment of IoT devices and solutions. Economic uncertainties and budget constraints led to delays in investment decisions and reduced spending on IoT projects.

Furthermore, certain sectors heavily dependent on IoT, such as retail and hospitality, faced significant setbacks due to lockdowns and reduced consumer demand. This led to a temporary slowdown in IoT monetization within those sectors. Overall, while the COVID-19 pandemic presented challenges, it also acted as a catalyst for digital transformation and the adoption of IoT solutions across industries. The long-term impact on the IoT monetization industry will depend on how businesses navigate the changing landscape, adapt to evolving customer needs, and continue to innovate in the post-pandemic era.

Top Impacting Factors  

Continuous rise in the volume of enterprise data:

Organizations are becoming aware of the opportunities embedded in their enterprise data due to a continuous rise in the volume of unstructured data. Enterprises can convert raw or aggregated data based on multiple data sources into something insightful and valuable through IoT monetization, which in turn helps make right business decisions. Companies have experienced exponential rise in volume, variety, and speed of data after the adoption of data monetization. This also makes way for different opportunities that help mark the growth of the business. A lot of industry verticals use analytics and business intelligence tools to create IoT monetization opportunities by leveraging all their data assets along with structured and unstructured data within enterprise systems. For instance, retailers are using IoT monetization primarily to automate the process of analyzing billions of transactions. Moreover, financial service companies adopt IoT monetization to analyze thousands of trades to be able to capture profit from minor market inefficiencies.

Rise in market for smart cities and connected cars:

The benefits of Internet of Things (IoT) are majorly being experienced among consumer domains, such as transport and connected homes, which in turn drive the growth of the IoT monetization market forecast in smart cities and smart cars. Moreover, integrating IoT devices into cars’ systems enables additional functionality. Smart cars allow individuals to cool down or heat up cars before going for a drive, which is also one of the major factors expected to drive the growth of the IoT monetization market in smart cars. Furthermore, energy consumption and smart home technologies are also the biggest adopters of Internet of Things (IoT) and continue to drive the growth of the market owing to the significant rise in smart cities’ initiatives. By using internet connectivity, smart homes allow homeowners to control various devices and appliances in the home from remote locations. In addition, the manufacturers plan to connect maximum number of home devices to the internet in the upcoming years, which provides numerous opportunities for the growth of the IoT monetization market.

Growth in penetration of IoT:

IoT has already started to transform and disrupt entire industries, such as home devices and other appliances. Followed by the smart home, connected cars are also dominating the Internet of Things, which are the major factors driving the growth of the market. Moreover, number of businesses are increasingly adopting IoT monetization solutions, which fuel the growth of the market. For instance, 35% of manufacturing organizations are already taking advantage of smart sensors, and other 18% are expected to use them in coming years. Furthermore, according to a survey by Capgemini, 65% of the companies are allocating budget to IoT over the next 12 months, which is anticipated to drive the growth of the IoT monetization market. Thus, the rise in penetration of IoT devices in numerous industry verticals is expected to generate massive amount of data. This is anticipated to generate the need for IoT monetization solution, which fuels the growth of the market.

KEY BENEFITS FOR STAKEHOLDERS

  • The study provides an in-depth IoT monetization market analysis along with the current trends and future estimations to elucidate the imminent investment pockets.
  • Information about key drivers, restraints, and opportunities and their impact analysis on the IoT monetization market size is provided in the report.
  • The Porter’s five forces analysis illustrates the potency of buyers and suppliers operating in the IoT monetization industry.
  • The quantitative analysis of the global IoT monetization market for the period 2022–2032 is provided to determine the IoT monetization market potential.

IoT Monetization Market Report Highlights

Aspects Details
Market Size By 2032 USD 25.1 trillion
Growth Rate CAGR of 51.7%
Forecast period 2022 - 2032
Report Pages 405
By Industry Vertical
  • Retail
  • IT and Telecom
  • Manufacturing
  • Transportation and Logistics
  • Healthcare
  • BFSI
  • Energy and Utilities
  • Others
By Component
  • Solution
  • Service
By Business Function
  • Marketing and Sales
  • IT
  • Finance
  • Supply Chain
  • Operations
By Organization Size
  • Large Enterprises
  • Small and Medium sized Enterprises
By Region
  • North America  (U.S., Canada)
  • Europe  (UK, Germany, France, Italy, Spain, Rest of Europe)
  • Asia-Pacific  (China, Japan, India, Australia, South Korea, Rest of Asia-Pacific)
  • LAMEA  (Latin America, Middle East, Africa)
Key Market Players Intel Corporation, Thales Group, Telefonaktiebolaget LM Ericsson, General Electric Co., Cisco Systems, Inc., IBM Corporation, Oracle Corporation, Amdocs, Inc., Microsoft Corporation., SAP SE

Analyst Review

According to the insights of the CXOs of the leading companies, IoT data were expected to account for 10% of all the data registered globally in 2020. However, adopters of IoT companies as well as governments around the world have started to take steps to maximize the benefits and capture the potential value of streaming big data, which is estimated to drive the overall adoption of IoT monetization solutions in different industry verticals. Furthermore, key areas such as smart homes, smart cars, smart cities, and IoT-based agriculture is expected to provide key opportunities for the IoT monetization market in the upcoming years.

The IoT monetization industry presents promising growth prospects throughout the forecast period, due to the ongoing adoption of these solutions among the second and third ranking companies in the telecom sector. Also, leading companies in Telco business are already deploying 5G and IoT and they will adopt the IoT monetization solutions due to its potential benefits to stay competitive in the market. Also, the adoption of IoT monetization solutions has increased in the automotive & transportation industry as the automotive manufacturers are extensively using IoT, which fuels the growth of the market. It is easier to support cities, towns, and states, globally to meet the rise in demand for surface transportation systems through connected cars and intelligent transportation systems such as sensors and communication & traffic control technologies. Consumer electronics is also one of the emerging application segments of the IoT monetization market and is anticipated to grow during the forecast period due to increase in number of smart appliances that can be connected to smartphones and the Internet. The demand for smart consumer electronics is expected to increase with its rise in use in building smart offices, smart cities, and smart buildings.

Furthermore, according to Cisco, the revenue from Internet of Things is expected to increase to about $19 trillion in a few years. There is a rise in the adoption of number of IoT devices in the developing economies such as China and India, which boosts the growth of the market. Furthermore, continuous increase in the adoption of IoT devices among different industry verticals is expected to provide numerous opportunities for the market growth. However, according to a Capgemini report, less than 30% of organizations generate service revenue from their connected products due to several challenges such as security and privacy concerns, lack of standards, and need of significant investments. This number is anticipated to increase in the future.

The global IoT monetization market is highly competitive owing to the strong position of the existing vendors. These companies have economies of scale and a huge geographical presence. The market is largely dominated by major vendors such as Amdocs, IBM Corporation, Ericsson, SAP SE, Oracle, Thales Group, Cisco Systems, Inc., and others. However, these players have adopted various strategies to enhance their product & service offerings and increase their market penetration.

 
  • CHAPTER 1: INTRODUCTION

    • 1.1. Report description

    • 1.2. Key market segments

    • 1.3. Key benefits to the stakeholders

    • 1.4. Research Methodology

      • 1.4.1. Primary research

      • 1.4.2. Secondary research

      • 1.4.3. Analyst tools and models

  • CHAPTER 2: EXECUTIVE SUMMARY

    • 2.1. CXO Perspective

  • CHAPTER 3: MARKET OVERVIEW

    • 3.1. Market definition and scope

    • 3.2. Key findings

      • 3.2.1. Top impacting factors

      • 3.2.2. Top investment pockets

    • 3.3. Porter’s five forces analysis

      • 3.3.1. Bargaining power of suppliers

      • 3.3.2. Bargaining power of buyers

      • 3.3.3. Threat of substitutes

      • 3.3.4. Threat of new entrants

      • 3.3.5. Intensity of rivalry

    • 3.4. Market dynamics

      • 3.4.1. Drivers

        • 3.4.1.1. Rise in market for smart cities and connected cars
        • 3.4.1.2. Growth in penetration of IoT
        • 3.4.1.3. Major shift from cost savings to revenue generation
        • 3.4.1.4. Continuous rise in the volume of enterprise data

      • 3.4.2. Restraints

        • 3.4.2.1. Lack of strategic decisions and standards
        • 3.4.2.2. Privacy and security concerns

      • 3.4.3. Opportunities

        • 3.4.3.1. Growing ecosystem of IoT platforms and service providers

    • 3.5. COVID-19 Impact Analysis on the market

  • CHAPTER 4: IOT MONETIZATION MARKET, BY COMPONENT

    • 4.1. Overview

      • 4.1.1. Market size and forecast

    • 4.2. Solution

      • 4.2.1. Key market trends, growth factors and opportunities

      • 4.2.2. Market size and forecast, by region

      • 4.2.3. Market share analysis by country

    • 4.3. Service

      • 4.3.1. Key market trends, growth factors and opportunities

      • 4.3.2. Market size and forecast, by region

      • 4.3.3. Market share analysis by country

  • CHAPTER 5: IOT MONETIZATION MARKET, BY BUSINESS FUNCTION

    • 5.1. Overview

      • 5.1.1. Market size and forecast

    • 5.2. Marketing and Sales

      • 5.2.1. Key market trends, growth factors and opportunities

      • 5.2.2. Market size and forecast, by region

      • 5.2.3. Market share analysis by country

    • 5.3. IT

      • 5.3.1. Key market trends, growth factors and opportunities

      • 5.3.2. Market size and forecast, by region

      • 5.3.3. Market share analysis by country

    • 5.4. Finance

      • 5.4.1. Key market trends, growth factors and opportunities

      • 5.4.2. Market size and forecast, by region

      • 5.4.3. Market share analysis by country

    • 5.5. Supply Chain

      • 5.5.1. Key market trends, growth factors and opportunities

      • 5.5.2. Market size and forecast, by region

      • 5.5.3. Market share analysis by country

    • 5.6. Operations

      • 5.6.1. Key market trends, growth factors and opportunities

      • 5.6.2. Market size and forecast, by region

      • 5.6.3. Market share analysis by country

  • CHAPTER 6: IOT MONETIZATION MARKET, BY ORGANIZATION SIZE

    • 6.1. Overview

      • 6.1.1. Market size and forecast

    • 6.2. Large Enterprises

      • 6.2.1. Key market trends, growth factors and opportunities

      • 6.2.2. Market size and forecast, by region

      • 6.2.3. Market share analysis by country

    • 6.3. Small and Medium sized Enterprises

      • 6.3.1. Key market trends, growth factors and opportunities

      • 6.3.2. Market size and forecast, by region

      • 6.3.3. Market share analysis by country

  • CHAPTER 7: IOT MONETIZATION MARKET, BY INDUSTRY VERTICAL

    • 7.1. Overview

      • 7.1.1. Market size and forecast

    • 7.2. Retail

      • 7.2.1. Key market trends, growth factors and opportunities

      • 7.2.2. Market size and forecast, by region

      • 7.2.3. Market share analysis by country

    • 7.3. IT and Telecom

      • 7.3.1. Key market trends, growth factors and opportunities

      • 7.3.2. Market size and forecast, by region

      • 7.3.3. Market share analysis by country

    • 7.4. Manufacturing

      • 7.4.1. Key market trends, growth factors and opportunities

      • 7.4.2. Market size and forecast, by region

      • 7.4.3. Market share analysis by country

    • 7.5. Transportation and Logistics

      • 7.5.1. Key market trends, growth factors and opportunities

      • 7.5.2. Market size and forecast, by region

      • 7.5.3. Market share analysis by country

    • 7.6. Healthcare

      • 7.6.1. Key market trends, growth factors and opportunities

      • 7.6.2. Market size and forecast, by region

      • 7.6.3. Market share analysis by country

    • 7.7. BFSI

      • 7.7.1. Key market trends, growth factors and opportunities

      • 7.7.2. Market size and forecast, by region

      • 7.7.3. Market share analysis by country

    • 7.8. Energy and Utilities

      • 7.8.1. Key market trends, growth factors and opportunities

      • 7.8.2. Market size and forecast, by region

      • 7.8.3. Market share analysis by country

    • 7.9. Others

      • 7.9.1. Key market trends, growth factors and opportunities

      • 7.9.2. Market size and forecast, by region

      • 7.9.3. Market share analysis by country

  • CHAPTER 8: IOT MONETIZATION MARKET, BY REGION

    • 8.1. Overview

      • 8.1.1. Market size and forecast By Region

    • 8.2. North America

      • 8.2.1. Key trends and opportunities

      • 8.2.2. Market size and forecast, by Component

      • 8.2.3. Market size and forecast, by Business Function

      • 8.2.4. Market size and forecast, by Organization Size

      • 8.2.5. Market size and forecast, by Industry Vertical

      • 8.2.6. Market size and forecast, by country

        • 8.2.6.1. U.S.
          • 8.2.6.1.1. Key market trends, growth factors and opportunities
          • 8.2.6.1.2. Market size and forecast, by Component
          • 8.2.6.1.3. Market size and forecast, by Business Function
          • 8.2.6.1.4. Market size and forecast, by Organization Size
          • 8.2.6.1.5. Market size and forecast, by Industry Vertical
        • 8.2.6.2. Canada
          • 8.2.6.2.1. Key market trends, growth factors and opportunities
          • 8.2.6.2.2. Market size and forecast, by Component
          • 8.2.6.2.3. Market size and forecast, by Business Function
          • 8.2.6.2.4. Market size and forecast, by Organization Size
          • 8.2.6.2.5. Market size and forecast, by Industry Vertical
    • 8.3. Europe

      • 8.3.1. Key trends and opportunities

      • 8.3.2. Market size and forecast, by Component

      • 8.3.3. Market size and forecast, by Business Function

      • 8.3.4. Market size and forecast, by Organization Size

      • 8.3.5. Market size and forecast, by Industry Vertical

      • 8.3.6. Market size and forecast, by country

        • 8.3.6.1. UK
          • 8.3.6.1.1. Key market trends, growth factors and opportunities
          • 8.3.6.1.2. Market size and forecast, by Component
          • 8.3.6.1.3. Market size and forecast, by Business Function
          • 8.3.6.1.4. Market size and forecast, by Organization Size
          • 8.3.6.1.5. Market size and forecast, by Industry Vertical
        • 8.3.6.2. Germany
          • 8.3.6.2.1. Key market trends, growth factors and opportunities
          • 8.3.6.2.2. Market size and forecast, by Component
          • 8.3.6.2.3. Market size and forecast, by Business Function
          • 8.3.6.2.4. Market size and forecast, by Organization Size
          • 8.3.6.2.5. Market size and forecast, by Industry Vertical
        • 8.3.6.3. France
          • 8.3.6.3.1. Key market trends, growth factors and opportunities
          • 8.3.6.3.2. Market size and forecast, by Component
          • 8.3.6.3.3. Market size and forecast, by Business Function
          • 8.3.6.3.4. Market size and forecast, by Organization Size
          • 8.3.6.3.5. Market size and forecast, by Industry Vertical
        • 8.3.6.4. Italy
          • 8.3.6.4.1. Key market trends, growth factors and opportunities
          • 8.3.6.4.2. Market size and forecast, by Component
          • 8.3.6.4.3. Market size and forecast, by Business Function
          • 8.3.6.4.4. Market size and forecast, by Organization Size
          • 8.3.6.4.5. Market size and forecast, by Industry Vertical
        • 8.3.6.5. Spain
          • 8.3.6.5.1. Key market trends, growth factors and opportunities
          • 8.3.6.5.2. Market size and forecast, by Component
          • 8.3.6.5.3. Market size and forecast, by Business Function
          • 8.3.6.5.4. Market size and forecast, by Organization Size
          • 8.3.6.5.5. Market size and forecast, by Industry Vertical
        • 8.3.6.6. Rest of Europe
          • 8.3.6.6.1. Key market trends, growth factors and opportunities
          • 8.3.6.6.2. Market size and forecast, by Component
          • 8.3.6.6.3. Market size and forecast, by Business Function
          • 8.3.6.6.4. Market size and forecast, by Organization Size
          • 8.3.6.6.5. Market size and forecast, by Industry Vertical
    • 8.4. Asia-Pacific

      • 8.4.1. Key trends and opportunities

      • 8.4.2. Market size and forecast, by Component

      • 8.4.3. Market size and forecast, by Business Function

      • 8.4.4. Market size and forecast, by Organization Size

      • 8.4.5. Market size and forecast, by Industry Vertical

      • 8.4.6. Market size and forecast, by country

        • 8.4.6.1. China
          • 8.4.6.1.1. Key market trends, growth factors and opportunities
          • 8.4.6.1.2. Market size and forecast, by Component
          • 8.4.6.1.3. Market size and forecast, by Business Function
          • 8.4.6.1.4. Market size and forecast, by Organization Size
          • 8.4.6.1.5. Market size and forecast, by Industry Vertical
        • 8.4.6.2. Japan
          • 8.4.6.2.1. Key market trends, growth factors and opportunities
          • 8.4.6.2.2. Market size and forecast, by Component
          • 8.4.6.2.3. Market size and forecast, by Business Function
          • 8.4.6.2.4. Market size and forecast, by Organization Size
          • 8.4.6.2.5. Market size and forecast, by Industry Vertical
        • 8.4.6.3. India
          • 8.4.6.3.1. Key market trends, growth factors and opportunities
          • 8.4.6.3.2. Market size and forecast, by Component
          • 8.4.6.3.3. Market size and forecast, by Business Function
          • 8.4.6.3.4. Market size and forecast, by Organization Size
          • 8.4.6.3.5. Market size and forecast, by Industry Vertical
        • 8.4.6.4. Australia
          • 8.4.6.4.1. Key market trends, growth factors and opportunities
          • 8.4.6.4.2. Market size and forecast, by Component
          • 8.4.6.4.3. Market size and forecast, by Business Function
          • 8.4.6.4.4. Market size and forecast, by Organization Size
          • 8.4.6.4.5. Market size and forecast, by Industry Vertical
        • 8.4.6.5. South Korea
          • 8.4.6.5.1. Key market trends, growth factors and opportunities
          • 8.4.6.5.2. Market size and forecast, by Component
          • 8.4.6.5.3. Market size and forecast, by Business Function
          • 8.4.6.5.4. Market size and forecast, by Organization Size
          • 8.4.6.5.5. Market size and forecast, by Industry Vertical
        • 8.4.6.6. Rest of Asia-Pacific
          • 8.4.6.6.1. Key market trends, growth factors and opportunities
          • 8.4.6.6.2. Market size and forecast, by Component
          • 8.4.6.6.3. Market size and forecast, by Business Function
          • 8.4.6.6.4. Market size and forecast, by Organization Size
          • 8.4.6.6.5. Market size and forecast, by Industry Vertical
    • 8.5. LAMEA

      • 8.5.1. Key trends and opportunities

      • 8.5.2. Market size and forecast, by Component

      • 8.5.3. Market size and forecast, by Business Function

      • 8.5.4. Market size and forecast, by Organization Size

      • 8.5.5. Market size and forecast, by Industry Vertical

      • 8.5.6. Market size and forecast, by country

        • 8.5.6.1. Latin America
          • 8.5.6.1.1. Key market trends, growth factors and opportunities
          • 8.5.6.1.2. Market size and forecast, by Component
          • 8.5.6.1.3. Market size and forecast, by Business Function
          • 8.5.6.1.4. Market size and forecast, by Organization Size
          • 8.5.6.1.5. Market size and forecast, by Industry Vertical
        • 8.5.6.2. Middle East
          • 8.5.6.2.1. Key market trends, growth factors and opportunities
          • 8.5.6.2.2. Market size and forecast, by Component
          • 8.5.6.2.3. Market size and forecast, by Business Function
          • 8.5.6.2.4. Market size and forecast, by Organization Size
          • 8.5.6.2.5. Market size and forecast, by Industry Vertical
        • 8.5.6.3. Africa
          • 8.5.6.3.1. Key market trends, growth factors and opportunities
          • 8.5.6.3.2. Market size and forecast, by Component
          • 8.5.6.3.3. Market size and forecast, by Business Function
          • 8.5.6.3.4. Market size and forecast, by Organization Size
          • 8.5.6.3.5. Market size and forecast, by Industry Vertical
  • CHAPTER 9: COMPETITIVE LANDSCAPE

    • 9.1. Introduction

    • 9.2. Top winning strategies

    • 9.3. Product Mapping of Top 10 Player

    • 9.4. Competitive Dashboard

    • 9.5. Competitive Heatmap

    • 9.6. Top player positioning, 2022

  • CHAPTER 10: COMPANY PROFILES

    • 10.1. Amdocs, Inc.

      • 10.1.1. Company overview

      • 10.1.2. Key Executives

      • 10.1.3. Company snapshot

      • 10.1.4. Operating business segments

      • 10.1.5. Product portfolio

      • 10.1.6. Business performance

      • 10.1.7. Key strategic moves and developments

    • 10.2. IBM Corporation

      • 10.2.1. Company overview

      • 10.2.2. Key Executives

      • 10.2.3. Company snapshot

      • 10.2.4. Operating business segments

      • 10.2.5. Product portfolio

      • 10.2.6. Business performance

    • 10.3. Telefonaktiebolaget LM Ericsson

      • 10.3.1. Company overview

      • 10.3.2. Key Executives

      • 10.3.3. Company snapshot

      • 10.3.4. Operating business segments

      • 10.3.5. Product portfolio

      • 10.3.6. Business performance

    • 10.4. SAP SE

      • 10.4.1. Company overview

      • 10.4.2. Key Executives

      • 10.4.3. Company snapshot

      • 10.4.4. Operating business segments

      • 10.4.5. Product portfolio

      • 10.4.6. Business performance

    • 10.5. Oracle Corporation

      • 10.5.1. Company overview

      • 10.5.2. Key Executives

      • 10.5.3. Company snapshot

      • 10.5.4. Operating business segments

      • 10.5.5. Product portfolio

      • 10.5.6. Business performance

    • 10.6. Cisco Systems, Inc.

      • 10.6.1. Company overview

      • 10.6.2. Key Executives

      • 10.6.3. Company snapshot

      • 10.6.4. Operating business segments

      • 10.6.5. Product portfolio

      • 10.6.6. Business performance

    • 10.7. Intel Corporation

      • 10.7.1. Company overview

      • 10.7.2. Key Executives

      • 10.7.3. Company snapshot

      • 10.7.4. Operating business segments

      • 10.7.5. Product portfolio

      • 10.7.6. Business performance

    • 10.8. General Electric Co.

      • 10.8.1. Company overview

      • 10.8.2. Key Executives

      • 10.8.3. Company snapshot

      • 10.8.4. Operating business segments

      • 10.8.5. Product portfolio

      • 10.8.6. Business performance

    • 10.9. Microsoft Corporation.

      • 10.9.1. Company overview

      • 10.9.2. Key Executives

      • 10.9.3. Company snapshot

      • 10.9.4. Operating business segments

      • 10.9.5. Product portfolio

      • 10.9.6. Business performance

    • 10.10. Thales Group

      • 10.10.1. Company overview

      • 10.10.2. Key Executives

      • 10.10.3. Company snapshot

      • 10.10.4. Operating business segments

      • 10.10.5. Product portfolio

      • 10.10.6. Business performance

  • LIST OF TABLES

  • TABLE 01. GLOBAL IOT MONETIZATION MARKET, BY COMPONENT, 2022-2032 ($BILLION)
    TABLE 02. IOT MONETIZATION MARKET FOR SOLUTION, BY REGION, 2022-2032 ($BILLION)
    TABLE 03. IOT MONETIZATION MARKET FOR SERVICE, BY REGION, 2022-2032 ($BILLION)
    TABLE 04. GLOBAL IOT MONETIZATION MARKET, BY BUSINESS FUNCTION, 2022-2032 ($BILLION)
    TABLE 05. IOT MONETIZATION MARKET FOR MARKETING AND SALES, BY REGION, 2022-2032 ($BILLION)
    TABLE 06. IOT MONETIZATION MARKET FOR IT, BY REGION, 2022-2032 ($BILLION)
    TABLE 07. IOT MONETIZATION MARKET FOR FINANCE, BY REGION, 2022-2032 ($BILLION)
    TABLE 08. IOT MONETIZATION MARKET FOR SUPPLY CHAIN, BY REGION, 2022-2032 ($BILLION)
    TABLE 09. IOT MONETIZATION MARKET FOR OPERATIONS, BY REGION, 2022-2032 ($BILLION)
    TABLE 10. GLOBAL IOT MONETIZATION MARKET, BY ORGANIZATION SIZE, 2022-2032 ($BILLION)
    TABLE 11. IOT MONETIZATION MARKET FOR LARGE ENTERPRISES, BY REGION, 2022-2032 ($BILLION)
    TABLE 12. IOT MONETIZATION MARKET FOR SMALL AND MEDIUM SIZED ENTERPRISES, BY REGION, 2022-2032 ($BILLION)
    TABLE 13. GLOBAL IOT MONETIZATION MARKET, BY INDUSTRY VERTICAL, 2022-2032 ($BILLION)
    TABLE 14. IOT MONETIZATION MARKET FOR RETAIL, BY REGION, 2022-2032 ($BILLION)
    TABLE 15. IOT MONETIZATION MARKET FOR IT AND TELECOM, BY REGION, 2022-2032 ($BILLION)
    TABLE 16. IOT MONETIZATION MARKET FOR MANUFACTURING, BY REGION, 2022-2032 ($BILLION)
    TABLE 17. IOT MONETIZATION MARKET FOR TRANSPORTATION AND LOGISTICS, BY REGION, 2022-2032 ($BILLION)
    TABLE 18. IOT MONETIZATION MARKET FOR HEALTHCARE, BY REGION, 2022-2032 ($BILLION)
    TABLE 19. IOT MONETIZATION MARKET FOR BFSI, BY REGION, 2022-2032 ($BILLION)
    TABLE 20. IOT MONETIZATION MARKET FOR ENERGY AND UTILITIES, BY REGION, 2022-2032 ($BILLION)
    TABLE 21. IOT MONETIZATION MARKET FOR OTHERS, BY REGION, 2022-2032 ($BILLION)
    TABLE 22. IOT MONETIZATION MARKET, BY REGION, 2022-2032 ($BILLION)
    TABLE 23. NORTH AMERICA IOT MONETIZATION MARKET, BY COMPONENT, 2022-2032 ($BILLION)
    TABLE 24. NORTH AMERICA IOT MONETIZATION MARKET, BY BUSINESS FUNCTION, 2022-2032 ($BILLION)
    TABLE 25. NORTH AMERICA IOT MONETIZATION MARKET, BY ORGANIZATION SIZE, 2022-2032 ($BILLION)
    TABLE 26. NORTH AMERICA IOT MONETIZATION MARKET, BY INDUSTRY VERTICAL, 2022-2032 ($BILLION)
    TABLE 27. NORTH AMERICA IOT MONETIZATION MARKET, BY COUNTRY, 2022-2032 ($BILLION)
    TABLE 28. U.S. IOT MONETIZATION MARKET, BY COMPONENT, 2022-2032 ($BILLION)
    TABLE 29. U.S. IOT MONETIZATION MARKET, BY BUSINESS FUNCTION, 2022-2032 ($BILLION)
    TABLE 30. U.S. IOT MONETIZATION MARKET, BY ORGANIZATION SIZE, 2022-2032 ($BILLION)
    TABLE 31. U.S. IOT MONETIZATION MARKET, BY INDUSTRY VERTICAL, 2022-2032 ($BILLION)
    TABLE 32. CANADA IOT MONETIZATION MARKET, BY COMPONENT, 2022-2032 ($BILLION)
    TABLE 33. CANADA IOT MONETIZATION MARKET, BY BUSINESS FUNCTION, 2022-2032 ($BILLION)
    TABLE 34. CANADA IOT MONETIZATION MARKET, BY ORGANIZATION SIZE, 2022-2032 ($BILLION)
    TABLE 35. CANADA IOT MONETIZATION MARKET, BY INDUSTRY VERTICAL, 2022-2032 ($BILLION)
    TABLE 36. EUROPE IOT MONETIZATION MARKET, BY COMPONENT, 2022-2032 ($BILLION)
    TABLE 37. EUROPE IOT MONETIZATION MARKET, BY BUSINESS FUNCTION, 2022-2032 ($BILLION)
    TABLE 38. EUROPE IOT MONETIZATION MARKET, BY ORGANIZATION SIZE, 2022-2032 ($BILLION)
    TABLE 39. EUROPE IOT MONETIZATION MARKET, BY INDUSTRY VERTICAL, 2022-2032 ($BILLION)
    TABLE 40. EUROPE IOT MONETIZATION MARKET, BY COUNTRY, 2022-2032 ($BILLION)
    TABLE 41. UK IOT MONETIZATION MARKET, BY COMPONENT, 2022-2032 ($BILLION)
    TABLE 42. UK IOT MONETIZATION MARKET, BY BUSINESS FUNCTION, 2022-2032 ($BILLION)
    TABLE 43. UK IOT MONETIZATION MARKET, BY ORGANIZATION SIZE, 2022-2032 ($BILLION)
    TABLE 44. UK IOT MONETIZATION MARKET, BY INDUSTRY VERTICAL, 2022-2032 ($BILLION)
    TABLE 45. GERMANY IOT MONETIZATION MARKET, BY COMPONENT, 2022-2032 ($BILLION)
    TABLE 46. GERMANY IOT MONETIZATION MARKET, BY BUSINESS FUNCTION, 2022-2032 ($BILLION)
    TABLE 47. GERMANY IOT MONETIZATION MARKET, BY ORGANIZATION SIZE, 2022-2032 ($BILLION)
    TABLE 48. GERMANY IOT MONETIZATION MARKET, BY INDUSTRY VERTICAL, 2022-2032 ($BILLION)
    TABLE 49. FRANCE IOT MONETIZATION MARKET, BY COMPONENT, 2022-2032 ($BILLION)
    TABLE 50. FRANCE IOT MONETIZATION MARKET, BY BUSINESS FUNCTION, 2022-2032 ($BILLION)
    TABLE 51. FRANCE IOT MONETIZATION MARKET, BY ORGANIZATION SIZE, 2022-2032 ($BILLION)
    TABLE 52. FRANCE IOT MONETIZATION MARKET, BY INDUSTRY VERTICAL, 2022-2032 ($BILLION)
    TABLE 53. ITALY IOT MONETIZATION MARKET, BY COMPONENT, 2022-2032 ($BILLION)
    TABLE 54. ITALY IOT MONETIZATION MARKET, BY BUSINESS FUNCTION, 2022-2032 ($BILLION)
    TABLE 55. ITALY IOT MONETIZATION MARKET, BY ORGANIZATION SIZE, 2022-2032 ($BILLION)
    TABLE 56. ITALY IOT MONETIZATION MARKET, BY INDUSTRY VERTICAL, 2022-2032 ($BILLION)
    TABLE 57. SPAIN IOT MONETIZATION MARKET, BY COMPONENT, 2022-2032 ($BILLION)
    TABLE 58. SPAIN IOT MONETIZATION MARKET, BY BUSINESS FUNCTION, 2022-2032 ($BILLION)
    TABLE 59. SPAIN IOT MONETIZATION MARKET, BY ORGANIZATION SIZE, 2022-2032 ($BILLION)
    TABLE 60. SPAIN IOT MONETIZATION MARKET, BY INDUSTRY VERTICAL, 2022-2032 ($BILLION)
    TABLE 61. REST OF EUROPE IOT MONETIZATION MARKET, BY COMPONENT, 2022-2032 ($BILLION)
    TABLE 62. REST OF EUROPE IOT MONETIZATION MARKET, BY BUSINESS FUNCTION, 2022-2032 ($BILLION)
    TABLE 63. REST OF EUROPE IOT MONETIZATION MARKET, BY ORGANIZATION SIZE, 2022-2032 ($BILLION)
    TABLE 64. REST OF EUROPE IOT MONETIZATION MARKET, BY INDUSTRY VERTICAL, 2022-2032 ($BILLION)
    TABLE 65. ASIA-PACIFIC IOT MONETIZATION MARKET, BY COMPONENT, 2022-2032 ($BILLION)
    TABLE 66. ASIA-PACIFIC IOT MONETIZATION MARKET, BY BUSINESS FUNCTION, 2022-2032 ($BILLION)
    TABLE 67. ASIA-PACIFIC IOT MONETIZATION MARKET, BY ORGANIZATION SIZE, 2022-2032 ($BILLION)
    TABLE 68. ASIA-PACIFIC IOT MONETIZATION MARKET, BY INDUSTRY VERTICAL, 2022-2032 ($BILLION)
    TABLE 69. ASIA-PACIFIC IOT MONETIZATION MARKET, BY COUNTRY, 2022-2032 ($BILLION)
    TABLE 70. CHINA IOT MONETIZATION MARKET, BY COMPONENT, 2022-2032 ($BILLION)
    TABLE 71. CHINA IOT MONETIZATION MARKET, BY BUSINESS FUNCTION, 2022-2032 ($BILLION)
    TABLE 72. CHINA IOT MONETIZATION MARKET, BY ORGANIZATION SIZE, 2022-2032 ($BILLION)
    TABLE 73. CHINA IOT MONETIZATION MARKET, BY INDUSTRY VERTICAL, 2022-2032 ($BILLION)
    TABLE 74. JAPAN IOT MONETIZATION MARKET, BY COMPONENT, 2022-2032 ($BILLION)
    TABLE 75. JAPAN IOT MONETIZATION MARKET, BY BUSINESS FUNCTION, 2022-2032 ($BILLION)
    TABLE 76. JAPAN IOT MONETIZATION MARKET, BY ORGANIZATION SIZE, 2022-2032 ($BILLION)
    TABLE 77. JAPAN IOT MONETIZATION MARKET, BY INDUSTRY VERTICAL, 2022-2032 ($BILLION)
    TABLE 78. INDIA IOT MONETIZATION MARKET, BY COMPONENT, 2022-2032 ($BILLION)
    TABLE 79. INDIA IOT MONETIZATION MARKET, BY BUSINESS FUNCTION, 2022-2032 ($BILLION)
    TABLE 80. INDIA IOT MONETIZATION MARKET, BY ORGANIZATION SIZE, 2022-2032 ($BILLION)
    TABLE 81. INDIA IOT MONETIZATION MARKET, BY INDUSTRY VERTICAL, 2022-2032 ($BILLION)
    TABLE 82. AUSTRALIA IOT MONETIZATION MARKET, BY COMPONENT, 2022-2032 ($BILLION)
    TABLE 83. AUSTRALIA IOT MONETIZATION MARKET, BY BUSINESS FUNCTION, 2022-2032 ($BILLION)
    TABLE 84. AUSTRALIA IOT MONETIZATION MARKET, BY ORGANIZATION SIZE, 2022-2032 ($BILLION)
    TABLE 85. AUSTRALIA IOT MONETIZATION MARKET, BY INDUSTRY VERTICAL, 2022-2032 ($BILLION)
    TABLE 86. SOUTH KOREA IOT MONETIZATION MARKET, BY COMPONENT, 2022-2032 ($BILLION)
    TABLE 87. SOUTH KOREA IOT MONETIZATION MARKET, BY BUSINESS FUNCTION, 2022-2032 ($BILLION)
    TABLE 88. SOUTH KOREA IOT MONETIZATION MARKET, BY ORGANIZATION SIZE, 2022-2032 ($BILLION)
    TABLE 89. SOUTH KOREA IOT MONETIZATION MARKET, BY INDUSTRY VERTICAL, 2022-2032 ($BILLION)
    TABLE 90. REST OF ASIA-PACIFIC IOT MONETIZATION MARKET, BY COMPONENT, 2022-2032 ($BILLION)
    TABLE 91. REST OF ASIA-PACIFIC IOT MONETIZATION MARKET, BY BUSINESS FUNCTION, 2022-2032 ($BILLION)
    TABLE 92. REST OF ASIA-PACIFIC IOT MONETIZATION MARKET, BY ORGANIZATION SIZE, 2022-2032 ($BILLION)
    TABLE 93. REST OF ASIA-PACIFIC IOT MONETIZATION MARKET, BY INDUSTRY VERTICAL, 2022-2032 ($BILLION)
    TABLE 94. LAMEA IOT MONETIZATION MARKET, BY COMPONENT, 2022-2032 ($BILLION)
    TABLE 95. LAMEA IOT MONETIZATION MARKET, BY BUSINESS FUNCTION, 2022-2032 ($BILLION)
    TABLE 96. LAMEA IOT MONETIZATION MARKET, BY ORGANIZATION SIZE, 2022-2032 ($BILLION)
    TABLE 97. LAMEA IOT MONETIZATION MARKET, BY INDUSTRY VERTICAL, 2022-2032 ($BILLION)
    TABLE 98. LAMEA IOT MONETIZATION MARKET, BY COUNTRY, 2022-2032 ($BILLION)
    TABLE 99. LATIN AMERICA IOT MONETIZATION MARKET, BY COMPONENT, 2022-2032 ($BILLION)
    TABLE 100. LATIN AMERICA IOT MONETIZATION MARKET, BY BUSINESS FUNCTION, 2022-2032 ($BILLION)
    TABLE 101. LATIN AMERICA IOT MONETIZATION MARKET, BY ORGANIZATION SIZE, 2022-2032 ($BILLION)
    TABLE 102. LATIN AMERICA IOT MONETIZATION MARKET, BY INDUSTRY VERTICAL, 2022-2032 ($BILLION)
    TABLE 103. MIDDLE EAST IOT MONETIZATION MARKET, BY COMPONENT, 2022-2032 ($BILLION)
    TABLE 104. MIDDLE EAST IOT MONETIZATION MARKET, BY BUSINESS FUNCTION, 2022-2032 ($BILLION)
    TABLE 105. MIDDLE EAST IOT MONETIZATION MARKET, BY ORGANIZATION SIZE, 2022-2032 ($BILLION)
    TABLE 106. MIDDLE EAST IOT MONETIZATION MARKET, BY INDUSTRY VERTICAL, 2022-2032 ($BILLION)
    TABLE 107. AFRICA IOT MONETIZATION MARKET, BY COMPONENT, 2022-2032 ($BILLION)
    TABLE 108. AFRICA IOT MONETIZATION MARKET, BY BUSINESS FUNCTION, 2022-2032 ($BILLION)
    TABLE 109. AFRICA IOT MONETIZATION MARKET, BY ORGANIZATION SIZE, 2022-2032 ($BILLION)
    TABLE 110. AFRICA IOT MONETIZATION MARKET, BY INDUSTRY VERTICAL, 2022-2032 ($BILLION)
    TABLE 111. AMDOCS, INC.: KEY EXECUTIVES
    TABLE 112. AMDOCS, INC.: COMPANY SNAPSHOT
    TABLE 113. AMDOCS, INC.: PRODUCT SEGMENTS
    TABLE 114. AMDOCS, INC.: PRODUCT PORTFOLIO
    TABLE 115. AMDOCS, INC.: KEY STRATERGIES
    TABLE 116. IBM CORPORATION: KEY EXECUTIVES
    TABLE 117. IBM CORPORATION: COMPANY SNAPSHOT
    TABLE 118. IBM CORPORATION: SERVICE SEGMENTS
    TABLE 119. IBM CORPORATION: PRODUCT PORTFOLIO
    TABLE 120. TELEFONAKTIEBOLAGET LM ERICSSON: KEY EXECUTIVES
    TABLE 121. TELEFONAKTIEBOLAGET LM ERICSSON: COMPANY SNAPSHOT
    TABLE 122. TELEFONAKTIEBOLAGET LM ERICSSON: SERVICE SEGMENTS
    TABLE 123. TELEFONAKTIEBOLAGET LM ERICSSON: PRODUCT PORTFOLIO
    TABLE 124. SAP SE: KEY EXECUTIVES
    TABLE 125. SAP SE: COMPANY SNAPSHOT
    TABLE 126. SAP SE: SERVICE SEGMENTS
    TABLE 127. SAP SE: PRODUCT PORTFOLIO
    TABLE 128. ORACLE CORPORATION: KEY EXECUTIVES
    TABLE 129. ORACLE CORPORATION: COMPANY SNAPSHOT
    TABLE 130. ORACLE CORPORATION: SERVICE SEGMENTS
    TABLE 131. ORACLE CORPORATION: PRODUCT PORTFOLIO
    TABLE 132. CISCO SYSTEMS, INC.: KEY EXECUTIVES
    TABLE 133. CISCO SYSTEMS, INC.: COMPANY SNAPSHOT
    TABLE 134. CISCO SYSTEMS, INC.: PRODUCT SEGMENTS
    TABLE 135. CISCO SYSTEMS, INC.: PRODUCT PORTFOLIO
    TABLE 136. INTEL CORPORATION: KEY EXECUTIVES
    TABLE 137. INTEL CORPORATION: COMPANY SNAPSHOT
    TABLE 138. INTEL CORPORATION: SERVICE SEGMENTS
    TABLE 139. INTEL CORPORATION: PRODUCT PORTFOLIO
    TABLE 140. GENERAL ELECTRIC CO.: KEY EXECUTIVES
    TABLE 141. GENERAL ELECTRIC CO.: COMPANY SNAPSHOT
    TABLE 142. GENERAL ELECTRIC CO.: SERVICE SEGMENTS
    TABLE 143. GENERAL ELECTRIC CO.: PRODUCT PORTFOLIO
    TABLE 144. MICROSOFT CORPORATION.: KEY EXECUTIVES
    TABLE 145. MICROSOFT CORPORATION.: COMPANY SNAPSHOT
    TABLE 146. MICROSOFT CORPORATION.: SERVICE SEGMENTS
    TABLE 147. MICROSOFT CORPORATION.: PRODUCT PORTFOLIO
    TABLE 148. THALES GROUP: KEY EXECUTIVES
    TABLE 149. THALES GROUP: COMPANY SNAPSHOT
    TABLE 150. THALES GROUP: PRODUCT SEGMENTS
    TABLE 151. THALES GROUP: PRODUCT PORTFOLIO
  • LIST OF FIGURES

  • FIGURE 01. IOT MONETIZATION MARKET, 2022-2032
    FIGURE 02. SEGMENTATION OF IOT MONETIZATION MARKET, 2022-2032
    FIGURE 03. TOP INVESTMENT POCKETS IN IOT MONETIZATION MARKET (2023-2032)
    FIGURE 04. LOW-TO-HIGH BARGAINING POWER OF SUPPLIERS
    FIGURE 05. MODEARTE BARGAINING POWER OF BUYERS
    FIGURE 06. MODERATE THREAT OF SUBSTITUTES
    FIGURE 07. LOW THREAT OF NEW ENTRANTS
    FIGURE 08. LOW-TO-HIGH INTENSITY OF RIVALRY
    FIGURE 09. DRIVERS, RESTRAINTS AND OPPORTUNITIES: GLOBALIOT MONETIZATION MARKET
    FIGURE 10. IOT MONETIZATION MARKET, BY COMPONENT, 2022(%)
    FIGURE 11. COMPARATIVE SHARE ANALYSIS OF IOT MONETIZATION MARKET FOR SOLUTION, BY COUNTRY 2022 AND 2032(%)
    FIGURE 12. COMPARATIVE SHARE ANALYSIS OF IOT MONETIZATION MARKET FOR SERVICE, BY COUNTRY 2022 AND 2032(%)
    FIGURE 13. IOT MONETIZATION MARKET, BY BUSINESS FUNCTION, 2022(%)
    FIGURE 14. COMPARATIVE SHARE ANALYSIS OF IOT MONETIZATION MARKET FOR MARKETING AND SALES, BY COUNTRY 2022 AND 2032(%)
    FIGURE 15. COMPARATIVE SHARE ANALYSIS OF IOT MONETIZATION MARKET FOR IT, BY COUNTRY 2022 AND 2032(%)
    FIGURE 16. COMPARATIVE SHARE ANALYSIS OF IOT MONETIZATION MARKET FOR FINANCE, BY COUNTRY 2022 AND 2032(%)
    FIGURE 17. COMPARATIVE SHARE ANALYSIS OF IOT MONETIZATION MARKET FOR SUPPLY CHAIN, BY COUNTRY 2022 AND 2032(%)
    FIGURE 18. COMPARATIVE SHARE ANALYSIS OF IOT MONETIZATION MARKET FOR OPERATIONS, BY COUNTRY 2022 AND 2032(%)
    FIGURE 19. IOT MONETIZATION MARKET, BY ORGANIZATION SIZE, 2022(%)
    FIGURE 20. COMPARATIVE SHARE ANALYSIS OF IOT MONETIZATION MARKET FOR LARGE ENTERPRISES, BY COUNTRY 2022 AND 2032(%)
    FIGURE 21. COMPARATIVE SHARE ANALYSIS OF IOT MONETIZATION MARKET FOR SMALL AND MEDIUM SIZED ENTERPRISES, BY COUNTRY 2022 AND 2032(%)
    FIGURE 22. IOT MONETIZATION MARKET, BY INDUSTRY VERTICAL, 2022(%)
    FIGURE 23. COMPARATIVE SHARE ANALYSIS OF IOT MONETIZATION MARKET FOR RETAIL, BY COUNTRY 2022 AND 2032(%)
    FIGURE 24. COMPARATIVE SHARE ANALYSIS OF IOT MONETIZATION MARKET FOR IT AND TELECOM, BY COUNTRY 2022 AND 2032(%)
    FIGURE 25. COMPARATIVE SHARE ANALYSIS OF IOT MONETIZATION MARKET FOR MANUFACTURING, BY COUNTRY 2022 AND 2032(%)
    FIGURE 26. COMPARATIVE SHARE ANALYSIS OF IOT MONETIZATION MARKET FOR TRANSPORTATION AND LOGISTICS, BY COUNTRY 2022 AND 2032(%)
    FIGURE 27. COMPARATIVE SHARE ANALYSIS OF IOT MONETIZATION MARKET FOR HEALTHCARE, BY COUNTRY 2022 AND 2032(%)
    FIGURE 28. COMPARATIVE SHARE ANALYSIS OF IOT MONETIZATION MARKET FOR BFSI, BY COUNTRY 2022 AND 2032(%)
    FIGURE 29. COMPARATIVE SHARE ANALYSIS OF IOT MONETIZATION MARKET FOR ENERGY AND UTILITIES, BY COUNTRY 2022 AND 2032(%)
    FIGURE 30. COMPARATIVE SHARE ANALYSIS OF IOT MONETIZATION MARKET FOR OTHERS, BY COUNTRY 2022 AND 2032(%)
    FIGURE 31. IOT MONETIZATION MARKET BY REGION, 2022
    FIGURE 32. U.S. IOT MONETIZATION MARKET, 2022-2032 ($BILLION)
    FIGURE 33. CANADA IOT MONETIZATION MARKET, 2022-2032 ($BILLION)
    FIGURE 34. UK IOT MONETIZATION MARKET, 2022-2032 ($BILLION)
    FIGURE 35. GERMANY IOT MONETIZATION MARKET, 2022-2032 ($BILLION)
    FIGURE 36. FRANCE IOT MONETIZATION MARKET, 2022-2032 ($BILLION)
    FIGURE 37. ITALY IOT MONETIZATION MARKET, 2022-2032 ($BILLION)
    FIGURE 38. SPAIN IOT MONETIZATION MARKET, 2022-2032 ($BILLION)
    FIGURE 39. REST OF EUROPE IOT MONETIZATION MARKET, 2022-2032 ($BILLION)
    FIGURE 40. CHINA IOT MONETIZATION MARKET, 2022-2032 ($BILLION)
    FIGURE 41. JAPAN IOT MONETIZATION MARKET, 2022-2032 ($BILLION)
    FIGURE 42. INDIA IOT MONETIZATION MARKET, 2022-2032 ($BILLION)
    FIGURE 43. AUSTRALIA IOT MONETIZATION MARKET, 2022-2032 ($BILLION)
    FIGURE 44. SOUTH KOREA IOT MONETIZATION MARKET, 2022-2032 ($BILLION)
    FIGURE 45. REST OF ASIA-PACIFIC IOT MONETIZATION MARKET, 2022-2032 ($BILLION)
    FIGURE 46. LATIN AMERICA IOT MONETIZATION MARKET, 2022-2032 ($BILLION)
    FIGURE 47. MIDDLE EAST IOT MONETIZATION MARKET, 2022-2032 ($BILLION)
    FIGURE 48. AFRICA IOT MONETIZATION MARKET, 2022-2032 ($BILLION)
    FIGURE 49. TOP WINNING STRATEGIES, BY YEAR
    FIGURE 50. TOP WINNING STRATEGIES, BY DEVELOPMENT
    FIGURE 51. TOP WINNING STRATEGIES, BY COMPANY
    FIGURE 52. PRODUCT MAPPING OF TOP 10 PLAYERS
    FIGURE 53. COMPETITIVE DASHBOARD
    FIGURE 54. COMPETITIVE HEATMAP: IOT MONETIZATION MARKET
    FIGURE 55. TOP PLAYER POSITIONING, 2022
    FIGURE 56. AMDOCS, INC.: NET REVENUE, 2020-2022 ($MILLION)
    FIGURE 57. AMDOCS, INC.: REVENUE SHARE BY REGION, 2022 (%)
    FIGURE 58. IBM CORPORATION: NET REVENUE, 2020-2022 ($MILLION)
    FIGURE 59. IBM CORPORATION: RESEARCH & DEVELOPMENT EXPENDITURE, 2020-2022 ($MILLION)
    FIGURE 60. IBM CORPORATION: REVENUE SHARE BY SEGMENT, 2022 (%)
    FIGURE 61. IBM CORPORATION: REVENUE SHARE BY REGION, 2022 (%)
    FIGURE 62. TELEFONAKTIEBOLAGET LM ERICSSON: NET REVENUE, 2019-2021 ($MILLION)
    FIGURE 63. TELEFONAKTIEBOLAGET LM ERICSSON: REVENUE SHARE BY SEGMENT, 2021 (%)
    FIGURE 64. TELEFONAKTIEBOLAGET LM ERICSSON: REVENUE SHARE BY REGION, 2021 (%)
    FIGURE 65. SAP SE: NET REVENUE, 2020-2022 ($MILLION)
    FIGURE 66. SAP SE: RESEARCH & DEVELOPMENT EXPENDITURE, 2020-2022 ($MILLION)
    FIGURE 67. SAP SE: REVENUE SHARE BY SEGMENT, 2022 (%)
    FIGURE 68. SAP SE: REVENUE SHARE BY REGION, 2022 (%)
    FIGURE 69. ORACLE CORPORATION.: NET REVENUE, 2020-2022 ($MILLION)
    FIGURE 70. ORACLE CORPORATION.: RESEARCH & DEVELOPMENT EXPENDITURE, 2020-2022 ($MILLION)
    FIGURE 71. ORACLE CORPORATION.: REVENUE SHARE BY SEGMENT, 2022 (%)
    FIGURE 72. ORACLE CORPORATION.: REVENUE SHARE BY REGION, 2022 (%)
    FIGURE 73. CISCO SYSTEMS, INC.: NET REVENUE, 2020-2022 ($MILLION)
    FIGURE 74. CISCO SYSTEMS, INC.: RESEARCH & DEVELOPMENT EXPENDITURE, 2020-2022 ($MILLION)
    FIGURE 75. CISCO SYSTEMS, INC.: REVENUE SHARE BY SEGMENT, 2022 (%)
    FIGURE 76. INTEL CORPORATION.: NET REVENUE, 2020-2022 ($MILLION)
    FIGURE 77. INTEL CORPORATION.: RESEARCH & DEVELOPMENT EXPENDITURE, 2020-2022 ($MILLION)
    FIGURE 78. INTEL CORPORATION.: REVENUE SHARE BY REGION, 2022 (%)
    FIGURE 79. GENERAL ELECTRIC CO.: NET REVENUE, 2020-2022 ($MILLION)
    FIGURE 80. GENERAL ELECTRIC CO.: RESEARCH & DEVELOPMENT EXPENDITURE, 2020-2022 ($MILLION)
    FIGURE 81. GENERAL ELECTRIC CO.: REVENUE SHARE BY SEGMENT, 2022 (%)
    FIGURE 82. GENERAL ELECTRIC CO.: REVENUE SHARE BY REGION, 2022 (%)
    FIGURE 83. MICROSOFT CORPORATION.: NET REVENUE, 2019-2021 ($MILLION)
    FIGURE 84. MICROSOFT CORPORATION.: RESEARCH & DEVELOPMENT EXPENDITURE, 2019-2021 ($MILLION)
    FIGURE 85. MICROSOFT CORPORATION.: REVENUE SHARE BY SEGMENT, 2021 (%)
    FIGURE 86. MICROSOFT CORPORATION.: REVENUE SHARE BY REGION, 2021 (%)
    FIGURE 87. THALES GROUP: RESEARCH & DEVELOPMENT EXPENDITURE, 2019-2021
    FIGURE 88. THALES GROUP: NET SALES, 2019-2021 ($MILLION)
    FIGURE 89. THALES GROUP: REVENUE SHARE BY SEGMENT, 2021 (%)
    FIGURE 90. THALES GROUP: REVENUE SHARE BY REGION, 2021 (%)


The demand for the global IoT monetization market is increasing due to rising demand for image recognition in the consumer electronics devices. The increase in use of consumer electronics in the development of smart buildings, smart cities, and smart offices is expected to boost the growth of the global IoT monetization market. Also, with the emergence of a number of smart appliances, which can connect to the Internet and smartphones, the demand for IoT monetization in consumer electronics applications is expected to grow during the forecast period. Furthermore, the major factor that drives the growth of the global IoT market includes smart home and energy consumption technologies.

The global IoT Monetization market is highly competitive due to the presence of strong position of the existing vendors. These companies have economies of scale and a huge geographical presence. Some of the key players profiled in the report include Amdocs, IBM Corporation, Ericsson, SAP SE, Oracle, Gemalto NV, Cisco Systems, Inc., ARIA SYSTEMS, INC., Intel Corp., General Electric Co., and others. These players have adopted various strategies to enhance their product & service offerings and increase their market penetration. For instance, in September 2017, Gemalto has launched smallest footprint solution “Sentinel Fit” to monetize IoT device software. It offers a complete licensing and entitlement management solution to maximize monetization of software-based products, for even the smallest of IoT devices and intelligent machines.

PURCHASE OPTIONS

Call or Email us

U.S.-Canada Toll-free: +1-800-792-5285
Int'l : +1-503-894-6022
Europe : +44-845-528-1300
Email : help@alliedmarketresearch.com
 
FREQUENTLY ASKED QUESTIONS?

A. Global IoT Monetization Market is Expected to Reach $25096.43 Billion by 2032.

A. The North America is the largest market for the IoT Monetization.

A. Rise in adoption of cloud platforms and increase in internet connectivity are the major factors that drive the growth of the global IoT monetization market.

A. The key growth strategies for IoT Monetization include product portfolio expansion, acquisition, partnership, merger, and collaboration.

A. Amdocs, Inc., IBM Corporation, Ericsson, SAP SE, Oracle, Thales Group, Cisco Systems, Inc., Aria Systems, Inc., Intel Corp., and General Electric Co.

Looking for Customization?

 Customization Request

Have a Question?

 Speak with Analyst

Any Confusion?

 Inquire Before Buying

Have a glance of the Report

  Request Sample
RELATED TAGS

Purchase Full Report of
Iot Monetization Market

Start reading instantly.
This Report and over 66,944+ more Reports, Available with Avenue Library. T&C*.

  • Online Only
  • $3,570
  • Online cloud access only
  • Restricted print, copy, paste & download
  • Read only
  • Free industry update
    (Within 180 days)
  • Free report update in next update cycle
    (May 2024 - May 2025)
  • Data Pack
  • $3,840
  • Restricted to one authorized user
  • One print only
  • Available in
    Excel
  • Free industry update
    (Within 180 days)
  •   Free report update in next update cycle
    (May 2024 - May 2025)
  • Single User
  • $5,730
  • Restricted to one authorized user
  • One print only
  • Available in
    PDF
  • Free industry update
    (Within 180 days)
  •   Free report update in next update cycle
    (May 2024 - May 2025)
  • Five Users
  • $6,450
  • Limited to five authorized users
  • Print upto five copies
  • Available in
    PDF
  • Free industry update
    (Within 180 days)
  •   Free report update in next update cycle
    (May 2024 - May 2025)
  • Enterprise
    License/PDF

  • $9,600
  • Unlimited
    within
    company/enterprise
  • Available in Excel & PDF
  • Free industry update
    (Within 180 days)
  •   Free report update in next update cycle
    (May 2024 - May 2025)
  • Library
    Membership

  • $999 $ 1,175
    Per User/ Per month/ Billed annually
  • Published Content
    E-access
  • Company Profiles
    E-access
  • Newly Added Content Access
  • 10 PDF
    Downloads
  • 5 Excel Data
    Pack Downloads
  • 250 Company Profiles PDF Downloads
  • Buy Now

*Taxes/Fees, if applicable will be added during checkout. All prices in USD

RELATED REPORTS
 

Why Allied Market Research?


Infallible Methodology

To ensure high-level data integrity, accurate analysis, and impeccable forecasts

Analyst Support

For complete satisfaction

Customization

On-demand customization of scope of the report to exactly meet your needs

TARGETED MARKET VIEW

Targeted market view to provide pertinent information and save time of readers

Get fresh content delivered

Get insights on topics that are crucial for your business. Stay abreast of your interest areas.

Get Industry Data Alerts

Why Allied Market Research?

Infallible Methodology

To ensure high-level data integrity, accurate analysis, and impeccable forecasts

Analyst Support

For complete satisfaction

Customization

On-demand customization of scope of the report to exactly meet your needs

TARGETED MARKET VIEW

Targeted market view to provide pertinent information and save time of readers