0
2021
Aerospace Fasteners Market

Aerospace Fasteners Market

by Material (Aluminum, Alloy Steel, Titanium and Others), Product (Nuts & Bolts, Rivets, Screws and Others), and Application (Military Aviation, Commercial Aviation and Civil Aviation): Global Opportunity Analysis and Industry Forecast, 2021-2030

Report Code: A06980
Dec 2021 | Pages: 241
Tables: 121
Charts: 70
  • Formats*:

  • pdf

    Single User License, Five User
    License & Enterprise User License

  • xls

    Data Pack Excel License

  • ppt

    It comes with the additional cost
    of $2500.00 contact sales.


COVID-19

Pandemic disrupted the entire world and affected many industries.

Get detailed COVID-19 impact analysis on the Aerospace Fasteners Market

Request Now !

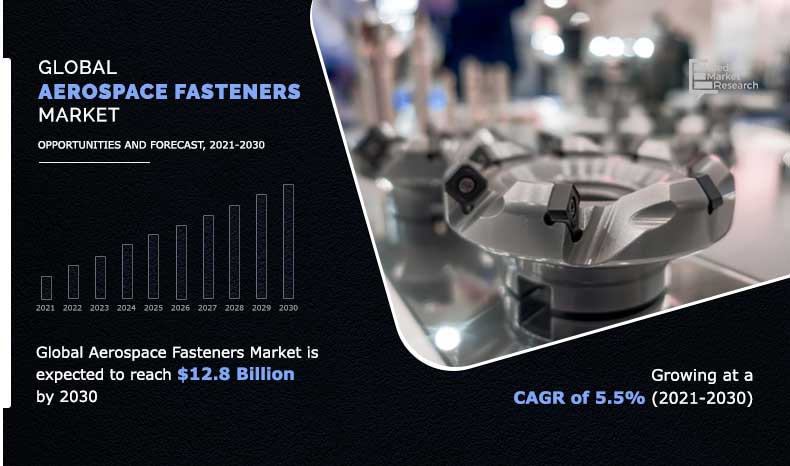
The aerospace fasteners market size was valued at $7,423.9 million in 2020, and is expected to reach $12,808.9 million by 2030, registering a CAGR 5.5% from 2021 to 2030. Aerospace fasteners are the hardware tools that are used for combining two or more objects in aircraft designing and manufacturing. The materials commonly used in the aerospace fasteners include nuts, bolts, titanium, nickel-based alloys, high strength alloys, and others. The aviation industry is always ready to adopt new technologies to reduce the overall weight of the aircraft. The standards of aerospace fasteners materials such as high operating temperature and resistance to corrosion are kept in mind to improve the fuel economy. Aerospace fasteners are mostly used in military aircraft (fighter jets), ballistic missiles, defense, satellites, and other commercial purposes aircraft.

The aerospace fasteners market was hampered during the outbreak of COVID-19 pandemic owing to regulation on logistic & air travel services. The production of new aircrafts declined significantly. In addition the MRO of the aerospace industry was also hampered. However, the demand for military aircrafts is growing significantly.

Rapid growth in global air travel owing to high standard of living, and rise in tourism majorly drive the market growth. In addition, relief in the import duties in some countries for the manufacturers drives the growth of the aerospace fasteners market. Further, many countries are focused on strengthening defense system by including fighter jets, military helicopters, and other special aircrafts in their military airforce. These factors act drive the aerospace fasteners market growth. However, 3D printing technology used in aircraft manufacturing is used for performing structural function in the aircraft. For instance, 3D printing is used for manufacturing components like panels, ducts, wings, and others. 3D technology is used for manufacturing lightweight components and reducing the number of components by printing two different adjacent parts into one single component. This is anticipated to reduce the demand for aerospace fasteners as there would be less assemblies. This acts as restraint to the market growth. Furthermore, during the outbreak of the COVID-19 pandemic, construction, manufacturing, hotel, and tourism industries were majorly affected. Manufacturing activities were halted or restricted. Construction and transportation activities, along with their supply chains, were hampered on a global level. This led to decline in manufacturing of aerospace fasteners as well as their demand in the market, thereby restraining the growth of the aerospace fasteners market. Conversely, industries are gradually resuming their regular manufacturing and services. This is expected to lead to re-initiation of aerospace fasteners companies at their full-scale capacities, which is likely to help the aerospace fasteners market to recover by mid of 2022.

Global-Aerospace-Fasteners-Market

On the contrary, increase in adoption of aerospace application in emerging countries has surged the demand for aircrafts. In addition, the aerospace fastener makers are progressively concentrating on developing countries such as Mexico, Brazil, India, and China for increasing their manufacturing. This offers open doors for outsider organizations to team up with OEMs and MROs for providing services in emerging market. This is anticipated to open new avenues for the aerospace fasteners market during the forecast period.

The aerospace fasteners market is segmented into material, product, application, and region. On the basis of material, the market is bifurcated into aluminum, alloy steel, titanium and others. Depending on product, it is segregated into nuts & bolts, rivets, screws and others. The applications covered in the study include military aviation, commercial aviation and civil aviation. Region wise, it is analyzed across North America (the U.S., Canada, and Mexico), Europe (Germany, UK, France, Italy, and rest of Europe), Asia-Pacific (China, Japan, South Korea, India, and rest of Asia-Pacific), and LAMEA (Latin America, the Middle East, and Africa).

Aerospace Fasteners Market
By Material

Your browser does not support the canvas element.

Titanium segment is projected to grow at a significant 6.0% CAGR

Get more information on this report : Request Sample Pages

On the basis of material, in 2020, the alloy steel segment dominated the aerospace fasteners market, in terms of revenue, whereas the titanium segment is expected to witness growth at the highest CAGR during the forecast period. As per product, in 2020, the nuts & bolts segment led the aerospace fasteners market, however, the others segment is expected to exhibit highest CAGR in the near future. By application, the civil aviation segment led the market in 2020, in terms of revenue; however, the military aviation segment is anticipated to register highest CAGR during the forecast period. Region wise, Asia-Pacific garnered the highest revenue in 2020.

Aerospace Fasteners Market
By Application

Your browser does not support the canvas element.

Military Aviation segment is expected to grow at a significant rate during the forecast period.

Get more information on this report : Request Sample Pages

Competition analysis

The major players profiled in the aerospace fasteners market include B&B Specialities Inc., Bufab Group, Howmet Aerospace, LISI Aerospace, Precision Castparts Corp., Stanley Black & Decker Inc., TFI Aerospace, The Boeing Company, TriMas Corporation and Wurth Group. Major companies in the market have adopted acquisition, agreement, joint venture, partnership and business expansion as their key developmental strategies to offer better products and services to customers in the aerospace fasteners market.

Aerospace Fasteners Market
By Region

2030
Asia-pacific 
North America
Europe
LAMEA

Asia-Pacific holds a dominant position in 2020

Get more information on this report : Request Sample Pages

Key Benefits For Stakeholders

  • The report provides an extensive analysis of the current trends, future estimations, and dynamics of the aerospace fasteners market. 
  • In-depth aerospace fasteners market analysis is conducted by estimations for the key segments between 2021 and 2030. 
  • Extensive analysis of the market is conducted by following key product positioning and monitoring of top competitors within the market framework.
  • A comprehensive analysis of four major regions is provided to determine the prevailing opportunities.
  • The market forecast analysis from 2021 to 2030 is included in the report.
  • The key market players operating in the market are profiled in this report and their strategies are analyzed thoroughly, which help to understand the competitive outlook of the market industry.

Aerospace Fasteners Market Report Highlights

Aspects Details
By Material
  • Aluminum
  • Alloy Steel
  • Titanium
  • Others
By Product
  • Nuts & Bolts
  • Rivets
  • Screws
  • Others
By Application
  • Military Aviation
  • Commercial Aviation
  • Civil Aviation
By Region
  • North America  (U.S., Canada, Mexico)
  • Europe  (Germany, France, UK, Italy, Rest of Europe)
  • Asia-Pacific  (China, Japan, South Korea, India, Rest of Asia-Pacific)
  • LAMEA  (Latin America, Middle East, Africa)
 

CHAPTER 1:INTRODUCTION

1.1.Report description
1.2.Research methodology

1.2.1.Primary research
1.2.2.Secondary research
1.2.3.Analyst tools and models

CHAPTER 2:EXECUTIVE SUMMARY

2.1.CXO perspective

CHAPTER 3:MARKET OVERVIEW

3.1.Market definition and scope
3.2.Key findings

3.2.1.Top investment pockets

3.3.Key forces shaping aerospace fasteners industry
3.4.Market dynamics

3.4.1.Drivers

3.4.1.1.Rise in air travelling
3.4.1.2.Increase in government expenditure on defense

3.4.2.Restraint

3.4.2.1.Increase in adoption of 3D printing

3.4.3.Opportunity

3.4.3.1.Growth of aerospace applications in emerging market

3.5.COVID-19 impact analysis

CHAPTER 4:AEROSPACE FASTENERS MARKET, BY MATERIAL

4.1.Market overview

4.1.1.Market size and forecast, by material

4.2.Aluminum

4.2.1.Key market trends, growth factors, and opportunities
4.2.2.Market size and forecast, by region
4.2.3.Market analysis, by country

4.3.Alloy steel

4.3.1.Key market trends, growth factors, and opportunities
4.3.2.Market size and forecast, by region
4.3.3.Market analysis, by country

4.4.Titanium

4.4.1.Key market trends, growth factors, and opportunities
4.4.2.Market size and forecast, by region
4.4.3.Market analysis, by country

4.5.Others

4.5.1.Key market trends, growth factors, and opportunities
4.5.2.Market size and forecast, by region
4.5.3.Market analysis, by country

CHAPTER 5:AEROSPACE FASTENERS MARKET, BY PRODUCT

5.1.Market overview

5.1.1.Market size and forecast, by product

5.2.Nuts & bolts

5.2.1.Key market trends, growth factors, and opportunities
5.2.2.Market size and forecast, by region
5.2.3.Market analysis, by country

5.3.Rivets

5.3.1.Key market trends, growth factors, and opportunities
5.3.2.Market size and forecast, by region
5.3.3.Market analysis, by country

5.4.Screws

5.4.1.Key market trends, growth factors, and opportunities
5.4.2.Market size and forecast, by region
5.4.3.Market analysis, by country

5.5.Others

5.5.1.Key market trends, growth factors, and opportunities
5.5.2.Market size and forecast, by region
5.5.3.Market analysis, by country

CHAPTER 6:AEROSPACE FASTENERS MARKET, BY APPLICATION

6.1.Market overview

6.1.1.Market size and forecast, by application

6.2.Military aviation

6.2.1.Key market trends, growth factors, and opportunities
6.2.2.Market size and forecast, by region
6.2.3.Market analysis, by country

6.3.Commercial aviation

6.3.1.Key market trends, growth factors, and opportunities
6.3.2.Market size and forecast, by region
6.3.3.Market analysis, by country

6.4.Civil aviation

6.4.1.Key market trends, growth factors, and opportunities
6.4.2.Market size and forecast, by region
6.4.3.Market analysis, by country

CHAPTER 7:AEROSPACE FASTENERS MARKET, BY REGION

7.1.Market overview

7.1.1.Market size and forecast, by region

7.2.North America

7.2.1.Key market trends, growth factors, and opportunities
7.2.2.Market size and forecast, by material
7.2.3.Market size and forecast, by product
7.2.4.Market size and forecast, by application
7.2.5.Market size and forecast, by country

7.2.5.1.U.S.

7.2.5.1.1.Market size and forecast, by material
7.2.5.1.2.Market size and forecast, by product
7.2.5.1.3.Market size and forecast, by application

7.2.5.2.Canada

7.2.5.2.1.Market size and forecast, by material
7.2.5.2.2.Market size and forecast, by product
7.2.5.2.3.Market size and forecast, by application

7.2.5.3.Mexico

7.2.5.3.1.Market size and forecast, by material
7.2.5.3.2.Market size and forecast, by product
7.2.5.3.3.Market size and forecast, by application

7.3.Europe

7.3.1.Key market trends, growth factors, and opportunities
7.3.2.Market size and forecast, by material
7.3.3.Market size and forecast, by product
7.3.4.Market size and forecast, by application
7.3.5.Market size and forecast, by country

7.3.5.1.Germany

7.3.5.1.1.Market size and forecast, by material
7.3.5.1.2.Market size and forecast, by product
7.3.5.1.3.Market size and forecast, by application

7.3.5.2.UK

7.3.5.2.1.Market size and forecast, by material
7.3.5.2.2.Market size and forecast, by product
7.3.5.2.3.Market size and forecast, by application

7.3.5.3.France

7.3.5.3.1.Market size and forecast, by material
7.3.5.3.2.Market size and forecast, by product
7.3.5.3.3.Market size and forecast, by application

7.3.5.4.Italy

7.3.5.4.1.Market size and forecast, by material
7.3.5.4.2.Market size and forecast, by product
7.3.5.4.3.Market size and forecast, by application

7.3.5.5.Rest of Europe

7.3.5.5.1.Market size and forecast, by material
7.3.5.5.2.Market size and forecast, by product
7.3.5.5.3.Market size and forecast, by application

7.4.Asia-Pacific

7.4.1.Key market trends, growth factors, and opportunities
7.4.2.Market size and forecast, by material
7.4.3.Market size and forecast, by product
7.4.4.Market size and forecast, by application
7.4.5.Market size and forecast, by country

7.4.5.1.China

7.4.5.1.1.Market size and forecast, by material
7.4.5.1.2.Market size and forecast, by product
7.4.5.1.3.Market size and forecast, by application

7.4.5.2.Japan

7.4.5.2.1.Market size and forecast, by material
7.4.5.2.2.Market size and forecast, by product
7.4.5.2.3.Market size and forecast, by application

7.4.5.3.South Korea

7.4.5.3.1.Market size and forecast, by material
7.4.5.3.2.Market size and forecast, by product
7.4.5.3.3.Market size and forecast, by application

7.4.5.4.India

7.4.5.4.1.Market size and forecast, by material
7.4.5.4.2.Market size and forecast, by product
7.4.5.4.3.Market size and forecast, by application

7.4.5.5.Rest of Asia-Pacific

7.4.5.5.1.Market size and forecast, by material
7.4.5.5.2.Market size and forecast, by product
7.4.5.5.3.Market size and forecast, by application

7.5.LAMEA

7.5.1.Key market trends, growth factors, and opportunities
7.5.2.Market size and forecast, by material
7.5.3.Market size and forecast, by product
7.5.4.Market size and forecast, by application
7.5.5.Market size and forecast, by country

7.5.5.1.Latin America

7.5.5.1.1.Market size and forecast, by material
7.5.5.1.2.Market size and forecast, by product
7.5.5.1.3.Market size and forecast, by application

7.5.5.2.Middle East

7.5.5.2.1.Market size and forecast, by material
7.5.5.2.2.Market size and forecast, by product
7.5.5.2.3.Market size and forecast, by application

7.5.5.3.Africa

7.5.5.3.1.Market size and forecast, by material
7.5.5.3.2.Market size and forecast, by product
7.5.5.3.3.Market size and forecast, by application

CHAPTER 8:COMPETITIVE LANDSCAPE

8.1.Introduction

8.1.1.Market player positioning

8.2.Top winning strategies

8.2.1.Top winning strategies, by year
8.2.2.Top winning strategies, by development
8.2.3.Top winning strategies, by company

8.3.Key developments

8.3.1.Acquisition
8.3.2.Agreement
8.3.3.Partnership
8.3.4.Business expansion

CHAPTER 9:COMPANY PROFILES

9.1.ADOLF WÜRTH GmbH & CO. KG

9.1.1.Company overview
9.1.2.Key executives
9.1.3.Company snapshot
9.1.4.Operating business segments
9.1.5.Product portfolio
9.1.6.R&D Expenditure
9.1.7.Business performance
9.1.8.Key strategic moves and developments

9.2.B&B SPECIALTIES, INC.

9.2.1.Company overview
9.2.2.Key executive
9.2.3.Company snapshot
9.2.4.Product portfolio

9.3.BUFAB GROUP

9.3.1.Company overview
9.3.2.Key executives
9.3.3.Company snapshot
9.3.4.Operating business segments
9.3.5.Product portfolio
9.3.6.Business performance
9.3.7.Key strategic moves and developments

9.4.HOWMET AEROSPACE

9.4.1.Company overview
9.4.2.Key executives
9.4.3.Company snapshot
9.4.4.Operating business segments
9.4.5.Product portfolio
9.4.6.R&D Expenditure
9.4.7.Business performance
9.4.8.Key strategic moves and developments

9.5.LISI

9.5.1.Company overview
9.5.2.Key executives
9.5.3.Company snapshot
9.5.4.Operating business segments
9.5.5.Product portfolio
9.5.6.R&D Expenditure
9.5.7.Business performance
9.5.8.Key strategic moves and developments

9.6.PRECISION CASTPARTS CORP.

9.6.1.Company overview
9.6.2.Key executives
9.6.3.Company snapshot
9.6.4.Operating business categories
9.6.5.Product portfolio

9.7.STANLEY BLACK & DECKER, INC.

9.7.1.Company overview
9.7.2.Key executives
9.7.3.Company snapshot
9.7.4.Operating business segments
9.7.5.Product portfolio
9.7.6.R&D Expenditure
9.7.7.Business performance
9.7.8.Key strategic moves and developments

9.8.TFI AEROSPACE

9.8.1.Company overview
9.8.2.Key executives
9.8.3.Company snapshot
9.8.4.Product portfolio

9.9.THE BOEING COMPANY

9.9.1.Company overview
9.9.2.Key executives
9.9.3.Company snapshot
9.9.4.Operating business segments
9.9.5.Product portfolio
9.9.6.R&D Expenditure
9.9.7.Business performance
9.9.8.Key strategic moves and developments

9.10.TRIMAS

9.10.1.Company overview
9.10.2.Key executives
9.10.3.Company snapshot
9.10.4.Operating business segments
9.10.5.Product portfolio
9.10.6.Business performance
9.10.7.Key strategic moves and developments

LIST OF TABLES

TABLE 01.AEROSPACE FASTENERS MARKET REVENUE, BY MATERIAL, 2020-2030 ($MILLION)
TABLE 02.AEROSPACE FASTENERS MARKET REVENUE FOR ALUMINUM, BY REGION, 2020-2030 ($MILLION)
TABLE 03.AEROSPACE FASTENERS MARKET REVENUE FOR ALLOY STEEL, BY REGION, 2020-2030 ($MILLION)
TABLE 04.AEROSPACE FASTENERS MARKET REVENUE FOR TITANIUM, BY REGION, 2020-2030 ($MILLION)
TABLE 05.AEROSPACE FASTENERS MARKET REVENUE FOR OTHERS, BY REGION, 2020-2030 ($MILLION)
TABLE 06.AEROSPACE FASTENERS MARKET REVENUE, BY PRODUCT, 2020-2030 ($MILLION)
TABLE 07.AEROSPACE FASTENERS MARKET REVENUE FOR NUTS & BOLTS, BY REGION, 2020-2030 ($MILLION)
TABLE 08.AEROSPACE FASTENERS MARKET REVENUE FOR RIVETS, BY REGION, 2020-2030 ($MILLION)
TABLE 09.AEROSPACE FASTENERS MARKET REVENUE FOR SCREWS, BY REGION, 2020-2030 ($MILLION)
TABLE 10.AEROSPACE FASTENERS MARKET REVENUE FOR OTHERS, BY REGION, 2020-2030 ($MILLION)
TABLE 11.AEROSPACE FASTENERS MARKET REVENUE, BY APPLICATION, 2020-2030 ($MILLION)
TABLE 12.AEROSPACE FASTENERS MARKET REVENUE FOR MILITARY AVIATION, BY REGION, 2020-2030 ($MILLION)
TABLE 13.AEROSPACE FASTENERS MARKET REVENUE FOR COMMERCIAL AVIATION, BY REGION, 2020-2030 ($MILLION)
TABLE 14.AEROSPACE FASTENERS MARKET REVENUE FOR CIVIL AVIATION, BY REGION, 2020-2030 ($MILLION)
TABLE 15.AEROSPACE FASTENERS MARKET, BY REGION, 2020-2030 ($MILLION)
TABLE 16.NORTH AMERICA AEROSPACE FASTENERS MARKET, BY MATERIAL, 2020-2030 ($MILLION)
TABLE 17.NORTH AMERICA AEROSPACE FASTENERS MARKET, BY PRODUCT, 2020-2030 ($MILLION)
TABLE 18.NORTH AMERICA AEROSPACE FASTENERS MARKET, BY APPLICATION, 2020-2030 ($MILLION)
TABLE 19.NORTH AMERICA AEROSPACE FASTENERS MARKET, BY COUNTRY, 2020-2030 ($MILLION)
TABLE 20.U.S. AEROSPACE FASTENERS MARKET, BY MATERIAL, 2020-2030 ($MILLION)
TABLE 21.U.S. AEROSPACE FASTENERS MARKET, BY PRODUCT, 2020-2030 ($MILLION)
TABLE 22.U.S. AEROSPACE FASTENERS MARKET, BY APPLICATION, 2020-2030 ($MILLION)
TABLE 23.CANADA AEROSPACE FASTENERS MARKET, BY MATERIAL, 2020-2030 ($MILLION)
TABLE 24.CANADA AEROSPACE FASTENERS MARKET, BY PRODUCT, 2020-2030 ($MILLION)
TABLE 25.CANADA AEROSPACE FASTENERS MARKET, BY APPLICATION, 2020-2030 ($MILLION)
TABLE 26.MEXICO AEROSPACE FASTENERS MARKET, BY MATERIAL, 2020-2030 ($MILLION)
TABLE 27.MEXICO AEROSPACE FASTENERS MARKET, BY PRODUCT, 2020-2030 ($MILLION)
TABLE 28.MEXICO AEROSPACE FASTENERS MARKET, BY APPLICATION, 2020-2030 ($MILLION)
TABLE 29.EUROPE AEROSPACE FASTENERS MARKET, BY MATERIAL, 2020-2030 ($MILLION)
TABLE 30.EUROPE AEROSPACE FASTENERS MARKET, BY PRODUCT, 2020-2030 ($MILLION)
TABLE 31.EUROPE AEROSPACE FASTENERS MARKET, BY APPLICATION, 2020-2030 ($MILLION)
TABLE 32.EUROPE AEROSPACE FASTENERS MARKET, BY COUNTRY, 2020-2030 ($MILLION)
TABLE 33.GERMANY AEROSPACE FASTENERS MARKET, BY MATERIAL, 2020-2030 ($MILLION)
TABLE 34.GERMANY AEROSPACE FASTENERS MARKET, BY PRODUCT, 2020-2030 ($MILLION)
TABLE 35.GERMANY AEROSPACE FASTENERS MARKET, BY APPLICATION, 2020-2030 ($MILLION)
TABLE 36.UK AEROSPACE FASTENERS MARKET, BY MATERIAL, 2020-2030 ($MILLION)
TABLE 37.UK AEROSPACE FASTENERS MARKET, BY PRODUCT, 2020-2030 ($MILLION)
TABLE 38.UK AEROSPACE FASTENERS MARKET, BY APPLICATION, 2020-2030 ($MILLION)
TABLE 39.FRANCE AEROSPACE FASTENERS MARKET, BY MATERIAL, 2020-2030 ($MILLION)
TABLE 40.FRANCE AEROSPACE FASTENERS MARKET, BY PRODUCT, 2020-2030 ($MILLION)
TABLE 41.FRANCE AEROSPACE FASTENERS MARKET, BY APPLICATION, 2020-2030 ($MILLION)
TABLE 42.ITALY AEROSPACE FASTENERS MARKET, BY MATERIAL, 2020-2030 ($MILLION)
TABLE 43.ITALY AEROSPACE FASTENERS MARKET, BY PRODUCT, 2020-2030 ($MILLION)
TABLE 44.ITALY AEROSPACE FASTENERS MARKET, BY APPLICATION, 2020-2030 ($MILLION)
TABLE 45.REST OF EUROPE AEROSPACE FASTENERS MARKET, BY MATERIAL, 2020-2030 ($MILLION)
TABLE 46.REST OF EUROPE AEROSPACE FASTENERS MARKET, BY PRODUCT, 2020-2030 ($MILLION)
TABLE 47.REST OF EUROPE AEROSPACE FASTENERS MARKET, BY APPLICATION, 2020-2030 ($MILLION)
TABLE 48.ASIA-PACIFIC AEROSPACE FASTENERS MARKET, BY MATERIAL, 2020-2030 ($MILLION)
TABLE 49.ASIA-PACIFIC AEROSPACE FASTENERS MARKET, BY PRODUCT, 2020-2030 ($MILLION)
TABLE 50.ASIA-PACIFIC AEROSPACE FASTENERS MARKET, BY APPLICATION, 2020-2030 ($MILLION)
TABLE 51.ASIA-PACIFIC AEROSPACE FASTENERS MARKET, BY COUNTRY, 2020-2030 ($MILLION)
TABLE 52.CHINA AEROSPACE FASTENERS MARKET, BY MATERIAL, 2020-2030 ($MILLION)
TABLE 53.CHINA AEROSPACE FASTENERS MARKET, BY PRODUCT, 2020-2030 ($MILLION)
TABLE 54.CHINA AEROSPACE FASTENERS MARKET, BY APPLICATION, 2020-2030 ($MILLION)
TABLE 55.JAPAN AEROSPACE FASTENERS MARKET, BY MATERIAL, 2020-2030 ($MILLION)
TABLE 56.JAPAN AEROSPACE FASTENERS MARKET, BY PRODUCT, 2020-2030 ($MILLION)
TABLE 57.JAPAN AEROSPACE FASTENERS MARKET, BY APPLICATION, 2020-2030 ($MILLION)
TABLE 58.SOUTH KOREA AEROSPACE FASTENERS MARKET, BY MATERIAL, 2020-2030 ($MILLION)
TABLE 59.SOUTH KOREA AEROSPACE FASTENERS MARKET, BY PRODUCT, 2020-2030 ($MILLION)
TABLE 60.SOUTH KOREA AEROSPACE FASTENERS MARKET, BY APPLICATION, 2020-2030 ($MILLION)
TABLE 61.INDIA AEROSPACE FASTENERS MARKET, BY MATERIAL, 2020-2030 ($MILLION)
TABLE 62.INDIA AEROSPACE FASTENERS MARKET, BY PRODUCT, 2020-2030 ($MILLION)
TABLE 63.INDIA AEROSPACE FASTENERS MARKET, BY APPLICATION, 2020-2030 ($MILLION)
TABLE 64.REST OF ASIA-PACIFIC AEROSPACE FASTENERS MARKET, BY MATERIAL, 2020-2030 ($MILLION)
TABLE 65.REST OF ASIA-PACIFIC AEROSPACE FASTENERS MARKET, BY PRODUCT, 2020-2030 ($MILLION)
TABLE 66.REST OF ASIA-PACIFIC AEROSPACE FASTENERS MARKET, BY APPLICATION, 2020-2030 ($MILLION)
TABLE 67.LAMEA AEROSPACE FASTENERS MARKET, BY MATERIAL, 2020-2030 ($MILLION)
TABLE 68.LAMEA AEROSPACE FASTENERS MARKET, BY PRODUCT, 2020-2030 ($MILLION)
TABLE 69.LAMEA AEROSPACE FASTENERS MARKET, BY APPLICATION, 2020-2030 ($MILLION)
TABLE 70.LAMEA AEROSPACE FASTENERS MARKET, BY COUNTRY, 2020-2030 ($MILLION)
TABLE 71.LATIN AMERICA AEROSPACE FASTENERS MARKET, BY MATERIAL, 2020-2030 ($MILLION)
TABLE 72.LATIN AMERICA AEROSPACE FASTENERS MARKET, BY PRODUCT, 2020-2030 ($MILLION)
TABLE 73.LATIN AMERICA AEROSPACE FASTENERS MARKET, BY APPLICATION, 2020-2030 ($MILLION)
TABLE 74.MIDDLE EAST AEROSPACE FASTENERS MARKET, BY MATERIAL, 2020-2030 ($MILLION)
TABLE 75.MIDDLE EAST AEROSPACE FASTENERS MARKET, BY PRODUCT, 2020-2030 ($MILLION)
TABLE 76.MIDDLE EAST AEROSPACE FASTENERS MARKET, BY APPLICATION, 2020-2030 ($MILLION)
TABLE 77.AFRICA AEROSPACE FASTENERS MARKET, BY MATERIAL, 2020-2030 ($MILLION)
TABLE 78.AFRICA AEROSPACE FASTENERS MARKET, BY PRODUCT, 2020-2030 ($MILLION)
TABLE 79.AFRICA AEROSPACE FASTENERS MARKET, BY APPLICATION, 2020-2030 ($MILLION)
TABLE 80.KEY ACQUISITION, (2019–2021)
TABLE 81.KEY AGREEMENT, (2019–2021)
TABLE 82.KEY PARTNERSHIP, (2019–2021)
TABLE 83.KEY BUSINESS EXPANSION, (2019–2021)
TABLE 84.ADOLF WÜRTH GMBH & CO. KG: KEY EXECUTIVES
TABLE 85.ADOLF WÜRTH GMBH & CO. KG: COMPANY SNAPSHOT
TABLE 86.ADOLF WÜRTH GMBH & CO. KG: OPERATING SEGMENTS
TABLE 87.ADOLF WÜRTH GMBH & CO. KG: PRODUCT PORTFOLIO
TABLE 88.B&B SPECIALTIES, INC.: KEY EXECUTIVE
TABLE 89.B&B SPECIALTIES, INC.: COMPANY SNAPSHOT
TABLE 90.B&B SPECIALTIES, INC.: PRODUCT PORTFOLIO
TABLE 91.BUFAB GROUP: KEY EXECUTIVES
TABLE 92.BUFAB GROUP: COMPANY SNAPSHOT
TABLE 93.BUFAB GROUP: OPERATING SEGMENTS
TABLE 94.BUFAB GROUP: PRODUCT PORTFOLIO
TABLE 95.HOWMET AEROSPACE: KEY EXECUTIVES
TABLE 96.HOWMET AEROSPACE: COMPANY SNAPSHOT
TABLE 97.HOWMET AEROSPACE: OPERATING SEGMENTS
TABLE 98.HOWMET AEROSPACE: PRODUCT PORTFOLIO
TABLE 99.LISI: KEY EXECUTIVES
TABLE 100.LISI: COMPANY SNAPSHOT
TABLE 101.LISI: OPERATING SEGMENTS
TABLE 102.LISI: PRODUCT PORTFOLIO
TABLE 103.PRECISION CASTPARTS CORP.: KEY EXECUTIVES
TABLE 104.PRECISION CASTPARTS CORP.: COMPANY SNAPSHOT
TABLE 105.PRECISION CASTPARTS CORP.: BUSINESS CATEGORIES
TABLE 106.PRECISION CASTPARTS CORP.: PRODUCT PORTFOLIO
TABLE 107.STANLEY BLACK & DECKER, INC.: KEY EXECUTIVES
TABLE 108.STANLEY BLACK & DECKER, INC.: COMPANY SNAPSHOT
TABLE 109.STANLEY BLACK & DECKER, INC.: OPERATING SEGMENTS
TABLE 110.STANLEY BLACK & DECKER, INC.: PRODUCT PORTFOLIO
TABLE 111.TFI AEROSPACE: KEY EXECUTIVES
TABLE 112.TFI AEROSPACE: COMPANY SNAPSHOT
TABLE 113.TFI AEROSPACE: PRODUCT PORTFOLIO
TABLE 114.THE BOEING COMPANY: KEY EXECUTIVES
TABLE 115.THE BOEING COMPANY: COMPANY SNAPSHOT
TABLE 116.THE BOEING COMPANY: OPERATING SEGMENTS
TABLE 117.THE BOEING COMPANY: PRODUCT PORTFOLIO
TABLE 118.TRIMAS: KEY EXECUTIVES
TABLE 119.TRIMAS: COMPANY SNAPSHOT
TABLE 120.TRIMAS: OPERATING SEGMENTS
TABLE 121.TRIMAS: PRODUCT PORTFOLIO

LIST OF FIGURES

FIGURE 01.KEY MARKET SEGMENTS
FIGURE 02.GLOBAL AEROSPACE FASTENERS MARKET SNAPSHOT, 2020–2030
FIGURE 03.AEROSPACE FASTENERS MARKET SNAPSHOT, BY COUNTRY, 2020–2030
FIGURE 04.GLOBAL AEROSPACE FASTENERS MARKET: KEY PLAYERS
FIGURE 05.TOP INVESTMENT POCKETS
FIGURE 06.LOW-TO-HIGH BARGAINING POWER OF SUPPLIERS
FIGURE 07.LOW-TO-HIGH THREAT OF NEW ENTRANTS
FIGURE 08.LOW-TO-MODERATE THREAT OF SUBSTITUTES
FIGURE 09.MODERATE BARGAINING POWER OF BUYERS
FIGURE 10.LOW-TO-HIGH INTENSITY OF RIVALRY
FIGURE 11.MARKET DYNAMICS
FIGURE 12.AEROSPACE FASTENERS MARKET, BY MATERIAL, 2020-2030
FIGURE 13.COMPARATIVE SHARE ANALYSIS OF AEROSPACE FASTENERS MARKET FOR ALUMINUM, BY COUNTRY,  2020 & 2030 (%)
FIGURE 14.COMPARATIVE SHARE ANALYSIS OF AEROSPACE FASTENERS MARKET FOR ALLOY STEEL, BY COUNTRY,  2020 & 2030 (%)
FIGURE 15.COMPARATIVE SHARE ANALYSIS OF AEROSPACE FASTENERS MARKET FOR TITANIUM, BY COUNTRY,  2020 & 2030 (%)
FIGURE 16.COMPARATIVE SHARE ANALYSIS OF AEROSPACE FASTENERS MARKET FOR OTHERS, BY COUNTRY,  2020 & 2030 (%)
FIGURE 17.AEROSPACE FASTENERS MARKET, BY PRODUCT, 2020-2030
FIGURE 18.COMPARATIVE SHARE ANALYSIS OF AEROSPACE FASTENERS MARKET FOR NUTS & BOLTS, BY COUNTRY,  2020 & 2030 (%)
FIGURE 19.COMPARATIVE SHARE ANALYSIS OF AEROSPACE FASTENERS MARKET FOR RIVETS, BY COUNTRY,  2020 & 2030 (%)
FIGURE 20.COMPARATIVE SHARE ANALYSIS OF AEROSPACE FASTENERS MARKET FOR SCREWS, BY COUNTRY,  2020 & 2030 (%)
FIGURE 21.COMPARATIVE SHARE ANALYSIS OF AEROSPACE FASTENERS MARKET FOR OTHERS, BY COUNTRY,  2020 & 2030 (%)
FIGURE 22.AEROSPACE FASTENERS MARKET, BY APPLICATION, 2020-2030
FIGURE 23.COMPARATIVE SHARE ANALYSIS OF AEROSPACE FASTENERS MARKET FOR MILITARY AVIATION, BY COUNTRY, 2020 & 2030 (%)
FIGURE 24.COMPARATIVE SHARE ANALYSIS OF AEROSPACE FASTENERS MARKET FOR COMMERCIAL AVIATION, BY COUNTRY, 2020 & 2030 (%)
FIGURE 25.COMPARATIVE SHARE ANALYSIS OF AEROSPACE FASTENERS MARKET FOR CIVIL AVIATION, BY COUNTRY,  2020 & 2030 (%)
FIGURE 26.AEROSPACE FASTENERS MARKET, BY REGION, 2020-2030
FIGURE 27.U.S. AEROSPACE FASTENERS MARKET REVENUE, 2020-2030 ($MILLION)
FIGURE 28.CANADA AEROSPACE FASTENERS MARKET REVENUE, 2020-2030 ($MILLION)
FIGURE 29.MEXICO AEROSPACE FASTENERS MARKET REVENUE, 2020-2030 ($MILLION)
FIGURE 30.GERMANY AEROSPACE FASTENERS MARKET REVENUE, 2020-2030 ($MILLION)
FIGURE 31.UK AEROSPACE FASTENERS MARKET REVENUE, 2020-2030 ($MILLION)
FIGURE 32.FRANCE AEROSPACE FASTENERS MARKET REVENUE, 2020-2030 ($MILLION)
FIGURE 33.ITALY AEROSPACE FASTENERS MARKET REVENUE, 2020-2030 ($MILLION)
FIGURE 34.REST OF EUROPE AEROSPACE FASTENERS MARKET REVENUE, 2020-2030 ($MILLION)
FIGURE 35.CHINA AEROSPACE FASTENERS MARKET REVENUE, 2020-2030 ($MILLION)
FIGURE 36.JAPAN AEROSPACE FASTENERS MARKET REVENUE, 2020-2030 ($MILLION)
FIGURE 37.SOUTH KOREA AEROSPACE FASTENERS MARKET REVENUE, 2020-2030 ($MILLION)
FIGURE 38.INDIA AEROSPACE FASTENERS MARKET REVENUE, 2020-2030 ($MILLION)
FIGURE 39.REST OF ASIA-PACIFIC AEROSPACE FASTENERS MARKET REVENUE, 2020-2030 ($MILLION)
FIGURE 40.LATIN AMERICA AEROSPACE FASTENERS MARKET REVENUE, 2020-2030 ($MILLION)
FIGURE 41.MIDDLE EAST AEROSPACE FASTENERS MARKET REVENUE, 2020-2030 ($MILLION)
FIGURE 42.AFRICA AEROSPACE FASTENERS MARKET REVENUE, 2020-2030 ($MILLION)
FIGURE 43.MARKET PLAYER POSITIONING
FIGURE 44.TOP WINNING STRATEGIES, BY YEAR, 2019–2021
FIGURE 45.TOP WINNING STRATEGIES, BY DEVELOPMENT, 2019–2021 (%)
FIGURE 46.TOP WINNING STRATEGIES, BY COMPANY, 2019–2021
FIGURE 47.ADOLF WÜRTH GMBH & CO. KG: R&D EXPENDITURE, 2018–2020 ($MILLION)
FIGURE 48.ADOLF WÜRTH GMBH & CO. KG: NET SALES, 2018–2020 ($MILLION)
FIGURE 49.ADOLF WÜRTH GMBH & CO. KG: REVENUE SHARE BY SEGMENT, 2020 (%)
FIGURE 50.ADOLF WÜRTH GMBH & CO. KG: REVENUE SHARE BY REGION, 2020 (%)
FIGURE 51.BUFAB GROUP: NET SALES, 2018–2020 ($MILLION)
FIGURE 52.LISI: REVENUE SHARE BY SEGMENT, 2020 (%)
FIGURE 53.BUFAB GROUP: REVENUE SHARE BY REGION, 2020 (%)
FIGURE 54.HOWMET AEROSPACE: R&D EXPENDITURE, 2018–2020 ($MILLION)
FIGURE 55.HOWMET AEROSPACE: NET SALES, 2018–2020 ($MILLION)
FIGURE 56.HOWMET AEROSPACE: REVENUE SHARE BY SEGMENT, 2020 (%)
FIGURE 57.HOWMET AEROSPACE: REVENUE SHARE BY REGION, 2020 (%)
FIGURE 58.LISI: R&D EXPENDITURE, 2018–2020 ($MILLION)
FIGURE 59.LISI: NET SALES, 2018–2020 ($MILLION)
FIGURE 60.LISI: REVENUE SHARE BY SEGMENT, 2020 (%)
FIGURE 61.STANLEY BLACK & DECKER, INC. : R&D EXPENDITURE, 2018–2020 ($MILLION)
FIGURE 62.STANLEY BLACK & DECKER, INC. : NET SALES, 2018–2020 ($MILLION)
FIGURE 63.STANLEY BLACK & DECKER, INC.: REVENUE SHARE BY SEGMENT, 2020 (%)
FIGURE 64.STANLEY BLACK & DECKER, INC. : REVENUE SHARE BY REGION, 2020 (%)
FIGURE 65.THE BOEING COMPANY: R&D EXPENDITURE, 2018–2020 ($MILLION)
FIGURE 66.THE BOEING COMPANY: NET SALES, 2018–2020 ($MILLION)
FIGURE 67.THE BOEING COMPANY: REVENUE SHARE BY SEGMENT, 2020 (%)
FIGURE 68.THE BOEING COMPANY: REVENUE SHARE BY REGION, 2020 (%)
FIGURE 69.TRIMAS: NET SALES, 2018–2020 ($MILLION)
FIGURE 70.TRIMAS: REVENUE SHARE BY SEGMENT, 2020 (%)


The aerospace fasteners market is a very fragmented market. The number of fasteners used in an aircraft is very high, however its value is very low compared to other parts. For instance, a modern Boeing 747 aircraft has over 6 million individual parts that are used in its construction. Of those parts, around 3 million are fasteners. Similarly, other aircrafts consist of 1 million to 3 million fasteners depending upon its type of built.

There is rise in air travel around the world which has led to purchase of several new civil aircrafts by the air travel operating companies. In addition, the governments are strengthening their airforce capacity by purchasing new and advanced aircrafts. This has led to rise in demand for aerospace fasteners in the market. In addition, the MROs have a major share in the demand for aerospace fasteners in the market.

Major companies in the market have adopted strategies such as acquisition, agreement, joint venture, partnership, and business expansion to offer better services to customers in the aerospace fasteners market.

PURCHASE OPTIONS

Call or Email us

U.S.-Canada Toll-free: +1-800-792-5285
Int'l : +1-503-894-6022
Europe : +44-845-528-1300
Email : help@alliedmarketresearch.com
 
FREQUENTLY ASKED QUESTIONS?

A. The aerospace fasteners market was valued at $7,423.9 million in 2020, and is expected to reach $12,808.9 million by 2030, registering a CAGR of 5.5% from 2021 to 2030.

A. The forecast period considered for the global aerospace fasteners market is 2021 to 2030, wherein, 2020 is the base year, 2021 is the estimated year, and 2030 is the forecast year.

A. To get latest version of global aerospace fasteners market report can be obtained on demand from the website.

A. The base year considered in the global aerospace fasteners market report is 2020.

A. The top companies holding the market share in the global aerospace fasteners market report include B&B Specialities Inc., Bufab Group, Howmet Aerospace, LISI Aerospace, Precision Castparts Corp., Stanley Black & Decker Inc., TFI Aerospace, The Boeing Company, TriMas Corporation and Wurth Group.

A. The top ten market players are selected based on two key attributes - competitive strength and market positioning

A. By material, the alloy steel segment dominated the global aerospace fasteners market, in terms of revenue and is expected to maintain this trend during the forecast period.

A. By application, the civil aviation segment is the highest share holder of global aerospace fasteners market.

A. The report contains an exclusive company profile section, where leading 10 companies in the market are profiled. These profiles typically cover company overview, geographical presence, market dominance (in terms of revenue and volume sales), various strategies and recent developments.

A. The market value of the global aerospace fasteners market is $7,943.6 million in 2021.

Looking for Customization?

 Customization Request

Have a Question?

 Speak with Analyst

Any Confusion?

 Inquire Before Buying

Have a glance of the Report

  Request Sample
RELATED TAGS

Purchase Full Report of
Aerospace Fasteners Market

Start reading instantly.
This Report and over 67,404+ more Reports, Available with Avenue Library. T&C*.

  • Online Only
  • $3,712
  • Online cloud access only
  • Restricted print, copy, paste & download
  • Read only
  • Free industry update
    (Within 180 days)
  • Free report update in next update cycle
    (Dec 2022 - Dec 2023)
  • Data Pack
  • $4,125
  • Restricted to one authorized user
  • One print only
  • Available in
    Excel
  • Free industry update
    (Within 180 days)
  •   Free report update in next update cycle
    (Dec 2022 - Dec 2023)
  • Single User
  • $5,769
  • Restricted to one authorized user
  • One print only
  • Available in
    PDF
  • Free industry update
    (Within 180 days)
  •   Free report update in next update cycle
    (Dec 2022 - Dec 2023)
  • Five Users
  • $6,929
  • Limited to five authorized users
  • Print upto five copies
  • Available in
    PDF
  • Free industry update
    (Within 180 days)
  •   Free report update in next update cycle
    (Dec 2022 - Dec 2023)
  • Enterprise
    License/PDF

  • $10,663
  • Unlimited
    within
    company/enterprise
  • Available in Excel & PDF
  • Free industry update
    (Within 180 days)
  •   Free report update in next update cycle
    (Dec 2022 - Dec 2023)
  • Library
    Membership

  • $999 $ 1,175
    Per User/ Per month/ Billed annually
  • Published Content
    E-access
  • Company Profiles
    E-access
  • Newly Added Content Access
  • 10 PDF
    Downloads
  • 5 Excel Data
    Pack Downloads
  • 250 Company Profiles PDF Downloads
  • Buy Now

*Taxes/Fees, if applicable will be added during checkout. All prices in USD

RELATED REPORTS
 

Why Allied Market Research?


Infallible Methodology

To ensure high-level data integrity, accurate analysis, and impeccable forecasts

Analyst Support

For complete satisfaction

Customization

On-demand customization of scope of the report to exactly meet your needs

TARGETED MARKET VIEW

Targeted market view to provide pertinent information and save time of readers

Get fresh content delivered

Get insights on topics that are crucial for your business. Stay abreast of your interest areas.

Get Industry Data Alerts

Why Allied Market Research?

Infallible Methodology

To ensure high-level data integrity, accurate analysis, and impeccable forecasts

Analyst Support

For complete satisfaction

Customization

On-demand customization of scope of the report to exactly meet your needs

TARGETED MARKET VIEW

Targeted market view to provide pertinent information and save time of readers