0
2018
Africa And Middle East Sugarcane Syrup Market

Africa and Middle East Sugarcane Syrup Market

by Territory (Malawi, Southern African Development Community (SADC) and Common Market for Eastern and Southern Africa (COMESA), West Africa, and Middle East) - Opportunity Analysis and Industry Forecast, 2017-2023

Report Code: A04280
May 2018 | Pages: 139
Tables: 59
Charts: 35
  • Formats*:

  • pdf

    Single User License, Five User
    License & Enterprise User License

  • xls

    Data Pack Excel License

  • ppt

    It comes with the additional cost
    of $2500.00 contact sales.


COVID-19

Pandemic disrupted the entire world and affected many industries.

Get detailed COVID-19 impact analysis on the Africa And Middle East Sugarcane Syrup Market

Request Now !

Africa And Middle East Sugarcane Syrup Market Overview:

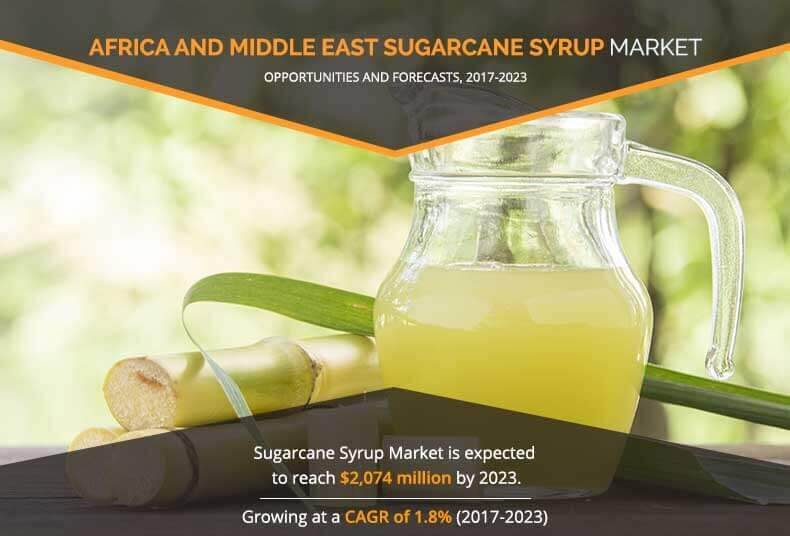
The Africa and Middle East sugarcane syrup market size is expected to be reach $2,074 million by 2023. Sugarcane syrup is a thick viscous, amber to golden colored syrup, which possesses a sweet flavor. The manufacturing of sugarcane syrup consists of two different sets of operations. In the first of these, the sugarcane juice is extracted from the sugarcane stalks, partially purified, and then followed by boiling to syrup. The second step consists of purifying the syrup with lime and baking soda, followed by continuous evaporation till the syrup with desired consistency is formed. Once the syrup reaches the desired consistency, it is allowed to cool before packaging. In case of commercial products, preservatives are added before packaging.

Sugarcane syrup made from sugarcane is widely used as a natural sweetener and flavoring agent by food industries for a variety of food products. It is widely used in the preparation of various bakery products such as waffles, cakes, pancakes, bread rolls, and French toast, as it helps retain moisture and prolong freshness, thus increasing their shelf life. In addition, it is used for flavoring a wide range of food products such as hot cereal, ice cream, sausages, fruit juices, corn fritters, baked beans, fresh donuts, and baked apples. Moreover, using sugarcane syrup in the preparation of bakery products is one of the traditional bakery practices. This is anticipated to increase the demand for sugarcane syrup in the market. Health benefits associated with sugarcane syrup has increased its consumption and usage among households, thereby driving the growth of Africa and Middle East sugarcane syrup market.

However, rise in health issues and increase in concerns among consumers towards weight gain, high cholesterol, obesity, and diabetes have led to the preference in consumption of food and beverages consisting of low calories and low-intensity sweeteners, which is expected to hamper the market growth. Moreover, availability of alternatives such as natural as well as artificial sweeteners hampers the growth of the sugarcane syrup market. On the contrary, changes in taste preferences, increase in health consciousness, and desire to live a healthy life are anticipated to provide lucrative opportunities for market growth.

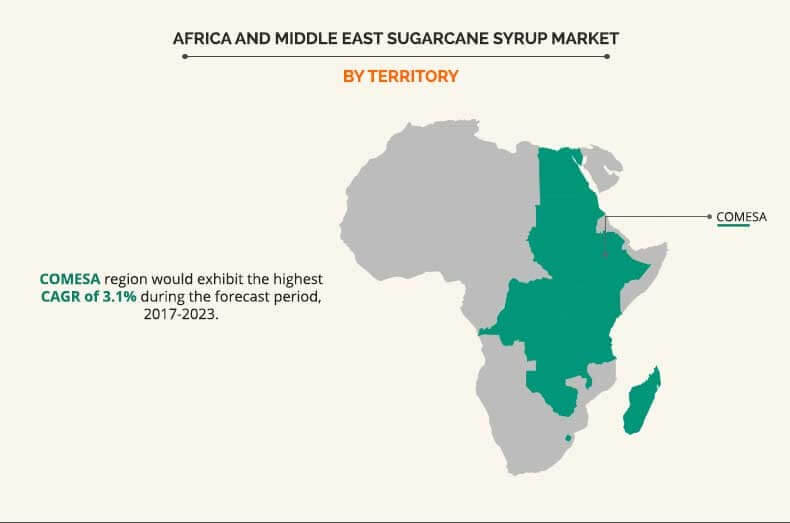
On the basis of territory, the report segments the Africa and Middle East sugarcane syrup industry into Malawi, Southern African Development Community (SADC) and Common Market for Eastern and Southern Africa (COMESA), West Africa, and Middle East. SADC is anticipated to hold the major share in this market in 2017. Moreover, Malawi is expected to witness high growth during the forecast period.

Key players profiled in the report include ILLOVO SUGAR (PTY) LTD, Super Syrups, Tongaat Hulett, Atlanta Sugar SA (Pty) Ltd., Sunshine Sugar, FROZY EGYPT, Kenana Sugar Company, White Nile Sugar Company (WNSC) Co. Ltd., GM Sugar Uganda Limited, and Kinyara Sugar Works Ltd.

Key Benefits

  • The report provides an extensive analysis of the current & emerging market trends and opportunities in the Africa and Middle East sugarcane syrup industry.
  • The report provides detailed qualitative and quantitative analysis of current trends and future estimations that assists to evaluate the prevailing market opportunities.
  • Comprehensive analysis of factors that drive and restrict the growth of the market is provided.
  • Extensive analysis of the market is conducted by following key product positioning and monitoring the top competitors within the market framework.
  • The report provides extensive qualitative insights on the potential and niche segments or regions exhibiting favorable growth.

Africa and Middle East Sugarcane Syrup Market Report Highlights

Aspects Details
By Territory
  • Malawi
  • Southern African Development Community (SADC)
  • Common Market for Eastern and Southern Africa (COMESA)
  • West Africa
  • Middle East
Key Market Players Royal Swaziland Sugar Corporation, Sunshine Sugar, Super Syrups, Kinyara Sugar Works Ltd, RCL Foods Limited, Superdoll Trailer Manufacture Co. Ltd. (Kagera Sugar Limited), Mumias Sugar Company Limited, Associated British Foods plc (Illovo Sugar (Pty) Ltd), Kenana Sugar Company, White Nile Sugar Company Co. Ltd, Sango Bay Estates Limited, BKB Ltd. (Atlanta Sugar SA (Pty) Ltd), Star Africa Corporation Limited, Gledhow Sugar Company (Pty) Limited U, Umfolozi Sugar Mill (Pty) Ltd, Alteo Limited, Tongaat Hulett Limited, The Mehta Group (Sugar Corporation of Uganda Limited), GM Sugar Uganda Limited, Nzoia Sugar Company Limited
 

CHAPTER 1: INTRODUCTION

1.1. REPORT DESCRIPTION
1.2. KEY MARKET BENEFITS FOR STAKEHOLDERS
1.3. KEY MARKET SEGMENTS
1.4. RESEARCH METHODOLOGY

1.4.1. Secondary research
1.4.2. Primary research
1.4.3. Analyst tools and models

CHAPTER 2: EXECUTIVE SUMMARY

2.1. Market snapshot
2.2. CXO perspective

CHAPTER 3: MARKET OVERVIEW

3.1. Introduction
3.2. KEY FINDINGS

3.2.1. Top impacting factors
3.2.2. Top investment pockets

3.3. MARKET DYNAMICS

3.3.1. Drivers

3.3.1.1. High production potential of sugarcane
3.3.1.2. Increase in consumption among food & beverages industry and households
3.3.1.3. Health benefits associated with sugarcane syrup

3.3.2. Restraints

3.3.2.1. Increase in awareness about health concerns
3.3.2.2. Growth in demand for alternate sugar substitutes

3.3.3. Opportunities

3.3.3.1. Growth in demand for organic cane syrup
3.3.3.2. Productivity improvement opportunity

3.4. Porter’s Five Forces Analysis

3.4.1. Bargaining power of suppliers
3.4.2. Bargaining power of buyers
3.4.3. Threat of substitution
3.4.4. Threat of new entrants
3.4.5. Competitive rivalry

3.5. Manufacturing process analysis
3.6. Value chain analysis

CHAPTER 4: SUGARCANE SYRUP MARKET, BY TERRITORY, 2016-2023 (KILOTONS, $MILLION)

4.1. Introduction
4.2. Market size and forecast
4.3. Malawi

4.3.1. Key market trends, growth factors, and opportunities
4.3.2. Market size and forecast

4.4. Southern Africa Development Community (SADC)

4.4.1. Key market trends, growth factors, and opportunities
4.4.2. Market size and forecast

4.5. Common Market for Eastern and Southern Africa (COMESA)

4.5.1. Key market trends, growth factors, and opportunities
4.5.2. Market size and forecast

4.6. West Africa

4.6.1. Key market trends, growth factors, and opportunities
4.6.2. Market size and forecast

4.7. Middle East

4.7.1. Key market trends, growth factors, and opportunities
4.7.2. Market size and forecast

CHAPTER 5: COMPANY PROFILES

5.1. Alteo Limited

5.1.1. Company overview
5.1.2. Company snapshot
5.1.3. Operating business segments
5.1.4. Product portfolio
5.1.5. Business performance

5.2. Associated British Foods plc (Illovo Sugar (Pty) Ltd)

5.2.1. Company overview
5.2.2. Company snapshot
5.2.3. Operating business segments
5.2.4. Product portfolio
5.2.5. Business performance

5.3. BKB Ltd. (Atlanta Sugar SA (Pty) Ltd)

5.3.1. Company overview
5.3.2. Company snapshot
5.3.3. Operating business segments
5.3.4. Product portfolio
5.3.5. Business performance

5.4. Gledhow Sugar Company (Pty) Limited U

5.4.1. Company overview
5.4.2. Company snapshot
5.4.3. Product portfolio

5.5. GM Sugar Uganda Limited

5.5.1. Company overview
5.5.2. Company snapshot
5.5.3. Product portfolio

5.6. Kenana Sugar Company

5.6.1. Company overview
5.6.2. Company snapshot
5.6.3. Product portfolio

5.7. Kinyara Sugar Works Ltd

5.7.1. Company overview
5.7.2. Company snapshot
5.7.3. Product portfolio

5.8. Mumias Sugar Company Limited

5.8.1. Company overview
5.8.2. Company snapshot
5.8.3. Operating business segments
5.8.4. Product portfolio
5.8.5. Business performance

5.9. Nzoia Sugar Company Limited

5.9.1. Company overview
5.9.2. Company snapshot
5.9.3. Operating business segments
5.9.4. Product portfolio

5.10. RCL Foods Limited

5.10.1. Company overview
5.10.2. Company snapshot
5.10.3. Operating business segments
5.10.4. Product portfolio
5.10.5. Business performance

5.11. Royal Swaziland Sugar Corporation

5.11.1. Company overview
5.11.2. Company snapshot
5.11.3. Operating business segments
5.11.4. Product portfolio
5.11.5. Business performance

5.12. Sango Bay Estates Limited

5.12.1. Company overview
5.12.2. Company snapshot
5.12.3. Product portfolio

5.13. Star Africa Corporation Limited

5.13.1. Company overview
5.13.2. Company snapshot
5.13.3. Product portfolio

5.14. Sunshine Sugar

5.14.1. Company overview
5.14.2. Company snapshot
5.14.3. Product portfolio

5.15. Super Syrups

5.15.1. Company overview
5.15.2. Company snapshot
5.15.3. Product portfolio

5.16. Superdoll Trailer Manufacture Co. Ltd. (Kagera Sugar Limited)

5.16.1. Company overview
5.16.2. Company snapshot
5.16.3. Product portfolio

5.17. The Mehta Group (Sugar Corporation of Uganda Limited)

5.17.1. Company overview
5.17.2. Company snapshot
5.17.3. Operating business segments
5.17.4. Product portfolio

5.18. Tongaat Hulett Limited

5.18.1. Company overview
5.18.2. Company snapshot
5.18.3. Operating business segments
5.18.4. Product portfolio
5.18.5. Business performance
5.18.6. Key strategic moves and developments

5.19. Umfolozi Sugar Mill (Pty) Ltd

5.19.1. Company overview
5.19.2. Company snapshot
5.19.3. Product portfolio

5.20. White Nile Sugar Company Co. Ltd

5.20.1. Company overview
5.20.2. Company snapshot
5.20.3. Product portfolio

CHAPTER 6: REGULATORY ANALYSIS FOR SUGARCANE SYRUP

6.1. Introduction
6.2. Key regulations governing trade of sugar

6.2.1. Malawi
6.2.2. Other regions

CHAPTER 7: PRODUCT QUALITY REQUIREMENT FOR SUGARCANE SYRUP

7.1. Introduction
7.2. Product quality requirements for sugarcane syrup

7.2.1. Sugarcane syrup
7.2.2. Molasses

7.2.2.1. Light molasses
7.2.2.2. Dark molasses
7.2.2.3. Blackstrap
7.2.2.4. Unsulfured and sulfured

7.2.3. Invert syrup
7.2.4. Golden syrup

CHAPTER 8: PRICE TREND ANALYSIS & PRICING STRUCTURE

8.1. Introduction
8.2. Price trend analysis for sugarcane syrup

8.2.1. Suppliers
8.2.2. Customers

8.3. Pricing structure for sugarcane syrup

CHAPTER 9: MARKETING STRATEGY

9.1. Marketing strategy by industry players
9.2. Marketing and promotional channels for Ethco and Presscane Limited

CHAPTER 10: VOICE OF CUSTOMERS
CHAPTER 11: VOICE OF INDUSTRY PLAYERS
CHAPTER 12: RECOMMENDATIONS AND CONCLUSIONS

LIST OF TABLES

TABLE 01. SUGARCANE SYRUP MARKET VOLUME, BY REGION, 2016-2023 (KILOTON)
TABLE 02. SUGARCANE SYRUP MARKET VALUE, BY REGION, 2016-2023 ($MILLION)
TABLE 03. ALTEO: COMPANY SNAPSHOT
TABLE 04. ALTEO: OPERATING SEGMENTS
TABLE 05. ALTEO: PRODUCT PORTFOLIO
TABLE 06. ABF: COMPANY SNAPSHOT
TABLE 07. ABF: OPERATING SEGMENTS
TABLE 08. ABF: PRODUCT PORTFOLIO
TABLE 09. BKB: COMPANY SNAPSHOT
TABLE 10. BKB: OPERATING SEGMENTS
TABLE 11. BKB: PRODUCT PORTFOLIO
TABLE 12. GLEDHOW: COMPANY SNAPSHOT
TABLE 13. GLEDHOW: PRODUCT PORTFOLIO
TABLE 14. GM SUGAR: COMPANY SNAPSHOT
TABLE 15. GM SUGAR: PRODUCT PORTFOLIO
TABLE 16. KSC: COMPANY SNAPSHOT
TABLE 17. KSC: PRODUCT PORTFOLIO
TABLE 18. KINYARA SUGAR: COMPANY SNAPSHOT
TABLE 19. KINYARA SUGAR: PRODUCT PORTFOLIO
TABLE 20. MSC: COMPANY SNAPSHOT
TABLE 21. MSC: OPERATING SEGMENTS
TABLE 22. MSC: PRODUCT PORTFOLIO
TABLE 23. NSC: COMPANY SNAPSHOT
TABLE 24. NSC: OPERATING SEGMENTS
TABLE 25. NSC: PRODUCT PORTFOLIO
TABLE 26. RCL FOODS: COMPANY SNAPSHOT
TABLE 27. RCL FOODS: OPERATING SEGMENTS
TABLE 28. RCL FOODS: PRODUCT PORTFOLIO
TABLE 29. RSSC: COMPANY SNAPSHOT
TABLE 30. RSSC: OPERATING SEGMENTS
TABLE 31. RSSC: PRODUCT PORTFOLIO
TABLE 32. SBEL: COMPANY SNAPSHOT
TABLE 33. SBEL: PRODUCT PORTFOLIO
TABLE 34. STARAFRICA: COMPANY SNAPSHOT
TABLE 35. STARAFRICA: PRODUCT PORTFOLIO
TABLE 36. SUNSHINE SUGAR: COMPANY SNAPSHOT
TABLE 37. SUNSHINE SUGAR: PRODUCT PORTFOLIO
TABLE 38. SUPER SYRUPS: COMPANY SNAPSHOT
TABLE 39. SUPER SYRUPS: PRODUCT PORTFOLIO
TABLE 40. SUPERDOLL: COMPANY SNAPSHOT
TABLE 41. SUPERDOLL: PRODUCT PORTFOLIO
TABLE 42. MEHTA GROUP: COMPANY SNAPSHOT
TABLE 43. MEHTA GROUP: OPERATING SEGMENTS
TABLE 44. MEHTA GROUP: PRODUCT PORTFOLIO
TABLE 45. TONGAAT HULETT: COMPANY SNAPSHOT
TABLE 46. TONGAAT HULETT: OPERATING SEGMENTS
TABLE 47. TONGAAT HULETT: PRODUCT PORTFOLIO
TABLE 48. USM: COMPANY SNAPSHOT
TABLE 49. USM: PRODUCT PORTFOLIO
TABLE 50. WNSC: COMPANY SNAPSHOT
TABLE 51. WNSC: PRODUCT PORTFOLIO
TABLE 52. REGULATORY ANALYSIS OF SUGAR IN MALAWI
TABLE 53. REGULATORY ANALYSIS OF SUGAR IN OTHER REGIONS
TABLE 54. SUGARCANE SYRUP: COMPOSITION
TABLE 55. SUGARCANE SYRUP: PRODUCT SPECIFICATIONS
TABLE 56. SUGARCANE MOLASSES: PRODUCT SPECIFICATIONS
TABLE 57. BLACKSTRAP MOLASSES: PRODUCT SPECIFICATIONS
TABLE 58. INVERT SYRUP/GOLDEN SYRUP: COMPOSITION
TABLE 59. INVERT SYRUP/GOLDEN SYRUP: PRODUCT SPECIFICATIONS

LIST OF FIGURES

FIGURE 01. EXECUTIVE SUMMARY SNAPSHOT
FIGURE 02. TOP IMPACTING FACTORS
FIGURE 03. TOP INVESTMENT POCKETS
FIGURE 04. SUGARCANE SYRUP MARKET: MARKET DYNAMICS
FIGURE 05. HIGH BARGAINING POWER OF SUPPLIERS
FIGURE 06. HIGH BARGAINING POWER OF BUYERS
FIGURE 07. HIGH THREAT OF SUBSTITUTION
FIGURE 08. LOW THREAT OF NEW ENTRANTS
FIGURE 09. MODERATE COMPETITIVE RIVALRY
FIGURE 10. MANUFACTURING PROCESS
FIGURE 11. VALUE CHAIN ANALYSIS
FIGURE 12. MALAWI SUGARCANE SYRUP MARKET VALUE ($MILLION) AND VOLUME (KILOTON), 2016-2023
FIGURE 13. SADC SUGARCANE SYRUP MARKET VALUE ($MILLION) AND VOLUME (KILOTON), 2016-2023
FIGURE 14. COMESA SUGARCANE SYRUP MARKET VALUE ($MILLION) AND VOLUME (KILOTON), 2016-2023
FIGURE 15. WEST AFRICA SUGARCANE SYRUP MARKET VALUE ($MILLION) AND VOLUME (KILOTON), 2016-2023
FIGURE 16. MIDDLE EAST SUGARCANE SYRUP MARKET VALUE ($MILLION) AND VOLUME (KILOTON), 2016-2023
FIGURE 17. ALTEO: NET SALES, 2015-2017 ($MILLION)
FIGURE 18. ALTEO: REVENUE SHARE BY SEGMENT, 2017 (%)
FIGURE 19. ALTEO: REVENUE SHARE BY GEOGRAPHY, 2017 (%)
FIGURE 20. ABF: NET SALES, 2015-2017 ($MILLION)
FIGURE 21. ABF: REVENUE SHARE BY SEGMENT, 2017 (%)
FIGURE 22. ABF: REVENUE SHARE BY GEOGRAPHY, 2017 (%)
FIGURE 23. BKB: NET SALES, 2015-2017 ($MILLION)
FIGURE 24. MSC: NET SALES, 2015-2017 ($MILLION)
FIGURE 25. MSC: REVENUE SHARE BY SEGMENT, 2017 (%)
FIGURE 26. RCL FOODS: NET SALES, 2015-2017 ($MILLION)
FIGURE 27. RCL FOODS: REVENUE SHARE BY SEGMENT, 2017 (%)
FIGURE 28. RSSC: NET SALES, 2015-2017 ($MILLION)
FIGURE 29. RSSC: REVENUE SHARE BY SEGMENT, 2017 (%)
FIGURE 30. TONGAAT HULETT: NET SALES, 2015-2017 ($MILLION)
FIGURE 31. TONGAAT HULETT: REVENUE SHARE BY SEGMENT, 2017 (%)
FIGURE 32. TONGAAT HULETT: REVENUE SHARE BY GEOGRAPHY, 2017 (%)
FIGURE 33. SUGARCANE SYRUP PRICE ANALYSIS, 2016-2023 ($/KG)
FIGURE 34. SUGARCANE SYRUP PRICE ANALYSIS, 2016-2023 ($/KG)
FIGURE 35. SUGARCANE SYRUP PRICE STRUCTURE, 2017 (%)


In Africa and Middle East, sugarcane is the most cost-effective source of sugar. Sugarcane syrup is obtained by successive evaporation of sugarcane juice. Expansion of global urban population, increase in demand for on-the-go food products, and surge in purchasing power of consumers fuel the demand for various confectionery products. Despite increase in health consciousness among consumers, the demand for premium, indulgent foods particularly bakery & confectionery products is on a rise. Ease of processing and cost reduction of production operations have changed the preferences of bakery food manufacturers, and they opt to use sugarcane syrups instead of refined or powdered sugar, thereby fueling the demand for sugarcane syrup.

 The sugarcane syrup industry possesses high growth potential in the developing regions such as China and India, owing to improvement in lifestyle, changes in taste preferences, and dietary habits. Improved living style of consumers further fosters the adoption of health drinks, thus boosting the market growth. The beverages industry is taking efforts to address the rapid changes in demands of consumers. Collaborations and acquisitions are the key strategies followed by the companies to gain a stronger foothold in the market, as in-house capacity building would be difficult for some of the novice players in the market.

PURCHASE OPTIONS

Call or Email us

U.S.-Canada Toll-free: +1-800-792-5285
Int'l : +1-503-894-6022
Europe : +44-845-528-1300
Email : help@alliedmarketresearch.com

Looking for Customization?

 Customization Request

Have a Question?

 Speak with Analyst

Any Confusion?

 Inquire Before Buying

Have a glance of the Report

  Request Sample

Purchase Full Report of
Africa And Middle East Sugarcane Syrup Market

Start reading instantly.
This Report and over 67,068+ more Reports, Available with Avenue Library. T&C*.

  • Online Only
  • $2,850
  • Online cloud access only
  • Restricted print, copy, paste & download
  • Read only
  • Free industry update
    (Within 180 days)
  • Free report update in next update cycle
    (May 2019 - May 2020)
  • Data Pack
  • $2,670
  • Restricted to one authorized user
  • One print only
  • Available in
    Excel
  • Free industry update
    (Within 180 days)
  •   Free report update in next update cycle
    (May 2019 - May 2020)
  • Single User
  • $3,930
  • Restricted to one authorized user
  • One print only
  • Available in
    PDF
  • Free industry update
    (Within 180 days)
  •   Free report update in next update cycle
    (May 2019 - May 2020)
  • Five Users
  • $4,740
  • Limited to five authorized users
  • Print upto five copies
  • Available in
    PDF
  • Free industry update
    (Within 180 days)
  •   Free report update in next update cycle
    (May 2019 - May 2020)
  • Enterprise
    License/PDF

  • $5,830
  • Unlimited
    within
    company/enterprise
  • Available in Excel & PDF
  • Free industry update
    (Within 180 days)
  •   Free report update in next update cycle
    (May 2019 - May 2020)
  • Library
    Membership

  • $999 $ 1,175
    Per User/ Per month/ Billed annually
  • Published Content
    E-access
  • Company Profiles
    E-access
  • Newly Added Content Access
  • 10 PDF
    Downloads
  • 5 Excel Data
    Pack Downloads
  • 250 Company Profiles PDF Downloads
  • Buy Now

*Taxes/Fees, if applicable will be added during checkout. All prices in USD

RELATED REPORTS
 

Why Allied Market Research?


Infallible Methodology

To ensure high-level data integrity, accurate analysis, and impeccable forecasts

Analyst Support

For complete satisfaction

Customization

On-demand customization of scope of the report to exactly meet your needs

TARGETED MARKET VIEW

Targeted market view to provide pertinent information and save time of readers

Get fresh content delivered

Get insights on topics that are crucial for your business. Stay abreast of your interest areas.

Get Industry Data Alerts

Why Allied Market Research?

Infallible Methodology

To ensure high-level data integrity, accurate analysis, and impeccable forecasts

Analyst Support

For complete satisfaction

Customization

On-demand customization of scope of the report to exactly meet your needs

TARGETED MARKET VIEW

Targeted market view to provide pertinent information and save time of readers