
Air Quality Control Systems Market Research, 2032
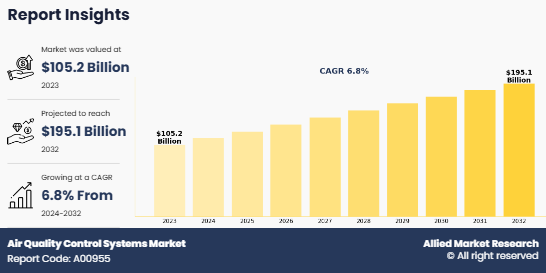
The global air quality control systems market size was valued at $105.2 billion in 2023, and is projected to reach $195.1 billion by 2032, growing at a CAGR of 6.8% from 2024 to 2032.Air quality control systems are designed to reduce harmful pollutants from both indoor and ambient air. The pollutants are let out by manufacturing industries such as power generation plants, automotive, mining, medical, and pharmaceutical among many others. Thus, the air quality control systems (AQCS) market overview includes controlling and handling air, gases, and contaminants to provide cleaner air discharge. These systems incorporate technologies such as air filtration equipment, pollutant removal mechanisms, and emission monitoring tools to ensure compliance with environmental regulations, improve public health, and minimize the negative impacts of air pollution on the environment.
Air quality control systems include the use of air filters, scrubbers, electrostatic precipitators, and other products for maintaining the quality of air. Governments worldwide are implementing strict regulations to control air pollution and improve air quality. Compliance with standards such as the Clean Air Act and equivalent policies in other regions drives the demand for air quality control systems across industries. Rapid industrial growth and urban expansion, especially in developing economies, have increased air pollution levels. This has necessitated the adoption of air quality control technologies in sectors like power generation, manufacturing, and mining. Increasing public awareness of the adverse health effects of air pollution, such as respiratory and cardiovascular diseases, is boosting the demand for air quality solutions in both indoor and outdoor environments. such factors will drive the air quality control systems market
The development of advanced air quality control technologies, such as high-efficiency particulate air (HEPA) filters, IoT-enabled systems, and real-time monitoring devices, has enhanced the efficiency and effectiveness of these systems, driving air quality control systems market. Rising global efforts to combat climate change have led to a focus on reducing industrial emissions, further driving the demand for air quality control systems. Developing countries in Asia-Pacific, Africa, and Latin America present significant growth opportunities due to increasing industrial activity, urbanization, and rising awareness of air quality concerns.
With the growing focus on health and wellness, there is an increasing demand for indoor air quality systems in residential, commercial, and healthcare sectors, offering a lucrative air quality control systems market opportunity. Government programs and financial incentives aimed at reducing pollution and promoting cleaner technologies create opportunities for manufacturers to expand their air quality control systems market reach. The global transition toward renewable energy and sustainable industrial practices is expected to create new opportunities for air quality control systems tailored to green energy production and eco-friendly industries.
Market Dynamics
Growth in awareness about the effects of air pollution on health among the population boosts the popularity of air quality control systems. The major air quality control systems market players are trying to improve their product portfolios to eliminate the fine dust, bacteria, and other harmful elements from not only the commercial and residential indoor spaces but also improve the overall air quality in the outdoor atmospheres. These factors are propelling the growth of the market. Furthermore, rise in demand for air filtration systems from the growing medical and pharmaceutical industries is also driving the demand for global air quality control systems.
Furthermore, the global decline in air quality, driven by increasing industrialization and urbanization, has emerged as a significant concern. Hence, economies such as China, India, and others are focusing on air pollution control, thereby, driving the overall market. On the contrary, high initial investments and operating costs of the systems are expected to restrain the market. Moreover, the power generation industries are eliminating the use of coal power plants, which are the majority users of air filtration systems to prevent the release of fly ash. Thus, decline in number of coal power plants is hindering the growth of the air quality control systems market during forecast period.
However, technological advancements by manufacturers have increased the demand for air quality control systems. For example, S.A. Hamon offers a range of advanced fabric filter technologies, including high-pressure pulse jet fabric filters, reactor fabric filters, medium-pressure pulse jet fabric filters, and low-pressure high-volume (LPHV) fabric filters. These LPHV filters are designed to operate without a compressor, making them suitable for large-scale utilities. Moreover, governments have formulated stringent laws for maintaining the air quality standards. This can create numerous opportunities for the air quality control systems market growth during the forecast period.
Segmental Overview
The market is segmented based on product type, technology, end-user, and region. Depending on product type, the market is divided into indoors, and ambient.

The indoor market is driven by the increasing awareness of the impact of indoor air pollution on health and well-being. Factors such as rising urbanization, changes in lifestyle, and growing concerns regarding respiratory diseases have contributed to the demand for effective air quality control solutions indoors.
Based on technology, the market is divided into flue gas desulphurization, NOx control systems, mercury control systems, fabric filters, scrubbers. The flue gas desulphurization (FGD) segment held a dominant position in the air quality control systems market in 2023 due to its critical role in reducing sulfur dioxide (SO2) emissions from power plants and industrial facilities.

The growing demand for cleaner air and the tightening of environmental regulations are key factors contributing to the dominance of this segment. FGD systems help mitigate the harmful effects of SO2, which is a major contributor to acid rain and air pollution.
By end user, the market is divided into residential and commercial, industrial. The industrial segment dominated the air quality control systems market in 2023, accounting for more than half of the air quality control systems market in terms of revenue.

By Region:
Based on region, the market is analyzed across North America, Europe, Asia-Pacific, and LAMEA. Asia-Pacific is anticipated to dominate the global market during the forecast period. The Asia-Pacific region dominated the air quality control systems market in 2023, accounting for the largest market share in terms of revenue.

This can be attributed to rapid industrialization, urbanization, and increasing pollution levels in countries such as China, India, and Japan. The growing industrial activity in these countries, coupled with stringent government regulations on air quality, has led to the widespread adoption of air quality control systems. Additionally, the region's expanding power generation and manufacturing sectors are significant contributors to the demand for such systems. Such factor will propel the market during the forecast period.
Asia-Pacific dominated the air quality control systems market share in 2023 and is anticipated to grow with the highest CAGR during the forecast period. Increase in government spending on infrastructure and construction projects is expected to contribute toward the growth of air quality control systems market in Asia-Pacific during the forecast period. Asia-Pacific region is expected to grow at a significant CAGR throughout the forecast period. This growth will be driven by continued urbanization, increased industrial emissions, and heightened environmental concerns. Furthermore, government initiatives aimed at improving air quality, such as stricter environmental regulations and investments in clean technologies, will bolster market growth. As the region prioritizes sustainability and environmental health, the demand for advanced air quality control systems is expected to rise, further cementing Asia-Pacific's dominant position in the global air quality control systems market.
Competition Analysis
Competitive analysis and profiles of the major players air quality control systems market outlook such as Mitsubishi Hitachi Power Systems, Ltd (MHPS), Donaldson Company, Inc., Babcock & Wilcox Enterprises, Inc., ELEX AG, GEA Group Aktiengesellschaft, HAMON Group, Thermax Ltd., GE Power, Daikin Industries Ltd., and MANN+HUMMEL Intern. GmbH & Co. KG are provided in this report. The key strategies adopted by these players from 2023 to 2032 were product launch, acquisition, business expansion, and product developments.
Key Benefits for Stakeholders
- The report provides an extensive analysis of the current and emerging air quality control systems market trends and dynamics.
- In-depth air quality control systems market analysis is conducted by constructing market estimations for the key market segments between 2023 and 2032.
- Extensive analysis is conducted by following key product positioning and monitoring of the top competitors within the air quality control systems industry framework.
- A comprehensive analysis of all the regions is provided to determine the prevailing air quality control systems market opportunity.
- The air quality control systems market forecast analysis from 2024 to 2032 is included in the report.
- The key players within the air quality control systems market are profiled in this report and their strategies are analyzed thoroughly, which helps to understand the competitive outlook of the air quality control systems industry.
Air Quality Control Systems Market Report Highlights
| Aspects | Details |
| Market Size By 2032 | USD 195.1 billion |
| Growth Rate | CAGR of 6.8% |
| Forecast period | 2023 - 2032 |
| Report Pages | 185 |
| By Product type |
|
| By Technology |
|
| By End User |
|
| By Region |
|
| Key Market Players | GE Power, Babcock & Wilcox Enterprises, Inc., Mitsubishi Hitachi Power Systems, Ltd (MHPS), Donaldson Company, Inc., MANN+HUMMEL Intern. GmbH & Co. KG, Daikin Industries Ltd., GEA Group Aktiengesellschaft, ELEX AG, Hamon Group S.A., Thermax Ltd. |
Babcock & Wilcox Enterprises, Inc., Daikin Industries Ltd., Donaldson Company, Inc., ELEX AG, GE Power, GEA Group Aktiengesellschaft, Hamon Group S.A., MANN+HUMMEL Intern. GmbH & Co. KG, Mitsubishi Hitachi Power Systems, Ltd (MHPS), and Thermax Ltd.
The global air quality control systems market was valued at $105,210.3 million in 2023
Asia-Pacific is the largest regional market for air quality control systems.
Residential, commercial, industrial application of air quality control systems market
Factors such as rising urbanization, changes in lifestyle, and growing concerns regarding respiratory diseases have contributed to the demand for effective air quality control solutions.
Loading Table Of Content...
Loading Research Methodology...

