
Alcohol E-Commerce Market Summary
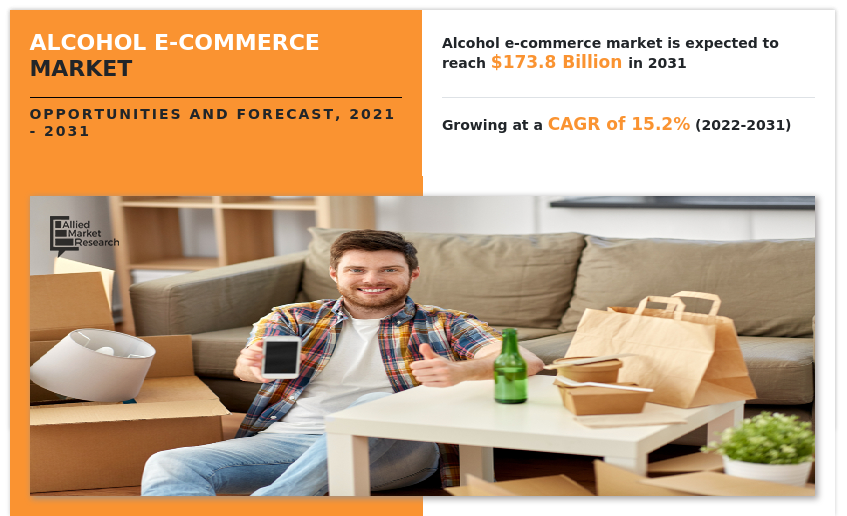
The global alcohol e-commerce market size was valued at $42.3 billion in 2021, and is projected to reach $173.8 billion by 2031, growing at a CAGR of 15.2% from 2022 to 2031.
Key Market Trends and Insights
Region wise, North America generated the highest revenue in 2021.
The global alcohol e-commerce market share was dominated by the beers segment in 2021 and is expected to maintain its dominance in the upcoming years
The distribution channel segment is expected to witness the highest growth during the forecast
Market Size & Forecast
- 2021 Market Size: USD 42.3 Billion
- 2031 Projected Market Size: USD 173.8 Billion
- Compound Annual Growth Rate (CAGR) (2022-2031): 15.2%
- North America: Generated the highest revenue in 2021
Market Dynamics
E-commerce refers to the buying and selling of goods online. Therefore, alcohol e-commerce refers to the sale of beer, wine, and liquor on the internet. Just like any other consumer packaged goods, buyers can purchase alcohol online, provided they meet the age limit and other legal requirements. Companies are selling liquor, beer, wine, and other alcoholic beverages online to expand their customer base. Personal license is obtained by the company to get permission for managing and selling alcohol and personal license names the business premises as a spot or area where packaging and dispatching of alcohol can take place legally.
The alcoholic liquor market is growing at a slow rate but the presence of the liquor market on e-commerce has created a new experience for the consumers. The increase in consumption of alcohol, the surge in e-commerce, direct-to-consumer sales, presence of beverage industry on online platforms, expanding business model, third-party platforms and applications, ease of transaction and payment methods, the safety of the product, availability of information about the product such as alcohol content and aging, availability of rare and specialty liquors, increase in online grocery sales, availability of variants to the consumer, increased disposable income, the surge in urbanization and packaging innovation are the key drivers which lead the growth of the global market. However, government regulations and limitations, lack in the adoption of technical innovations, less customer engagement, the high price of the products, availability of liquor stores, supply chain hurdles, slow growth of the e-commerce liquor, taxes on alcoholic beverages, license, and documentation hurdles hinder the alcohol e-commerce market growth.
As the living standards are increasing globally, the aspiration of consumers to consume premium quality luxury products is also expected to grow. The consumption of these products is often associated with occasions such as celebrations lives consumers or on any events. Furthermore, product dependency of these products at marriages, parties, and social gatherings is anticipated to drive the alcohol e-commerce market in the coming years. Moreover, the premium luxurious product market experienced considerable growth across most regions in 2021, driven primarily by robust consumption.
Segments Overview
The global alcohol e-commerce market is segmented into alcohol type, price point, distribution channel, and region. On the basis of alcohol type, the market is classified into wines/champagne, spirits, beers and others. By price point, it is bifurcated into economy, mid-range and luxury. As per distribution channel, it is categorized into Online Grocery, online alcohol marketplace, licensed specialty retailers, and direct-to-consumer wine online. Region wise, it is analyzed across North America (the U.S., Canada, and Mexico), Europe (Germany, UK, France, Italy, Spain, Russia, and the rest of Europe), Asia-Pacific (China, Japan, India, Australia, South Korea, Malaysia, Indonesia and the rest of Asia-Pacific), and LAMEA (Brazil, Argentina, South Africa, Nigeria, United Arab Emirates, and the rest of LAMEA).

Based on alcohol type, The beer segment is likely to gain a significant potential in future. As the number of alcohol consuming consumers is increasing continuously, the demand for various flavors is also increasing. Consumers are always seeking for new flavors in beers to explore their taste for beers. Numerous manufacturers are offering online sales of strong and flavorful beer across the globe. Moreover, the flavors such as honey-flavored, tart & funky, sour, fruit & spicy, malty & sweet flavors has attracted large number of customer base. Furthermore, the continuous innovation in the ingredient, flavor and packaging of beer has increasingly appealed to the customer worldwide.

Based on price point, economy segment held the major share in the market and is likely to reamin same throughout the alcohol e-commerce market forecast period. The economy section has relatively little cost, feasible, and consumed by a large population as it is less expensive and offers a feeling of having wine at low price. Moreover, it also has a wide range of collection as most of the people look for good product at feasible price. People with limited income are the major consumers of this segment. It aims at people with low budget to gain and achieve the required target.

Based on distribution channel, increase in alcohol sales is being driven by on-premise closures, changing shopper behavior, channel shifting, and possibly an increase in alcohol consumption, with grocers benefiting more than retailers like Walmart and convenience stores. Two-thirds of the increase in grocery sales is due to increased spending per trip, which is driven by two factors: premiumization, or shoppers purchasing higher-priced beverages Second, they are purchasing larger packs. Restaurants and bars have had to drastically reduce indoor service, causing customers to purchase more alcohol at their local grocery stores.

By region, North America has the highest market share in 2021. Consumption of alcoholic beverages including wine, spirits, and beer in North America is expected to increase, owing to demographic growth of young-adult population and rich economy. This, in turn, increases potential growth of the alcohol e-commerce market in this region. Customers in North America have high disposable income and better standard of living. The e-commerce penetration of alcohol in the U.S witnessed a boost by 10 times in just three month in 2020 after the lockdown. The direct -to-consumer sales of alcohol has risen by 70-75% in 2020 in the U.S. Moreover, big retailers such as Walmart increased the number of locations they delivered alcohol in U.S. from 200 in 2019 to 1500 by the end of 2021.
Competition Analysis
The major players analyzed for global alcohol e-commerce market are Bright Cellars, Costco Wholesale Corporation, Drizly, Evino, Flaviar, Naked Wines, RserveBar, Total Wines & More, Uber Technologies Inc, Vivino, and Vintage Wine Estates.
Key Benefits For Stakeholders
- This report provides a quantitative analysis of the market segments, current trends, estimations, and dynamics of the alcohol e-commerce market analysis from 2021 to 2031 to identify the prevailing alcohol e-commerce market opportunities.
- The market research is offered along with information related to key drivers, restraints, and opportunities.
- Porter's five forces analysis highlights the potency of buyers and suppliers to enable stakeholders make profit-oriented business decisions and strengthen their supplier-buyer network.
- In-depth analysis of the alcohol e-commerce market segmentation assists to determine the prevailing market opportunities.
- Major countries in each region are mapped according to their revenue contribution to the global alcohol e-commerce industry.
- Market player positioning facilitates benchmarking and provides a clear understanding of the present position of the market players.
- The report includes the analysis of the regional as well as global alcohol e-commerce market trends, key players, market segments, application areas, and market growth strategies.
Alcohol E-Commerce Market Report Highlights
| Aspects | Details |
| By Alcohol type |
|
| By Price Point |
|
| By Distribution Channel |
|
| By Region |
|
| Key Market Players | Winc Inc, Drizly, Naked Wines plc, ReserveBar, Vivino, Total Wine and More, Evino, Costco Wholesale Corporation, Bright Cellars, Vintage Wine Estates, Uber Technologies Inc, Flaviar |
Analyst Review
According to the insights of CXOs of leading companies, rise in demand for different flavor of wine and increase in wineries across the western countries are among the major factors that boost the market growth. A huge consumption of alcohol products has been noted during the past years, which is expected to continue during the forecast period. In addition, consumer attractiveness toward different flavors of wines and beers along with its significant quality and reasonable pricing drives the market growth..
In addition, increase in working young population and growth in disposable income have stimulated the market growth. Furthermore, there is an increasing trend of consuming light beer, owing to its low alcohol, and calorie content and health consciousness. Craft beer, a handcrafted beer that is infused with native flavors, is widely preferred by consumers via online across the European countries. Consumers have increasingly opted for premium beers, which are expensive and have refined flavors to maintain their social status.
Manufacturers are focused toward providing innovative and attractive product offerings, in terms of packaging, flavors, and style of products, to gain a higher share in the alcohol e-commerce market.
The global Alcohol E-Commerce Market Size was valued at $42.3 billion in 2021, and is projected to reach $173.8 billion by 2031
The global Alcohol E-Commerce market is projected to grow at a compound annual growth rate of 15.2% from 2022 to 2031 $173.8 billion by 2031
The major players analyzed for global alcohol e-commerce industry are Bright Cellars, Costco Wholesale Corporation, Drizly, Evino, Flaviar, Naked Wines, RserveBar, Total Wines & More, Uber Technologies Inc, Vivino, and Vintage Wine Estates.
By region, North America has the highest alcohol e-commerce market share in 2021.
Rise in alcohol consumption and thriving e-commerce activities across the globe. High online presence of beverages sector and ease of online transaction and payment procedures as well as seamless online operations. Availability of alcohol in different flavors and packaging innovation.
Loading Table Of Content...

