
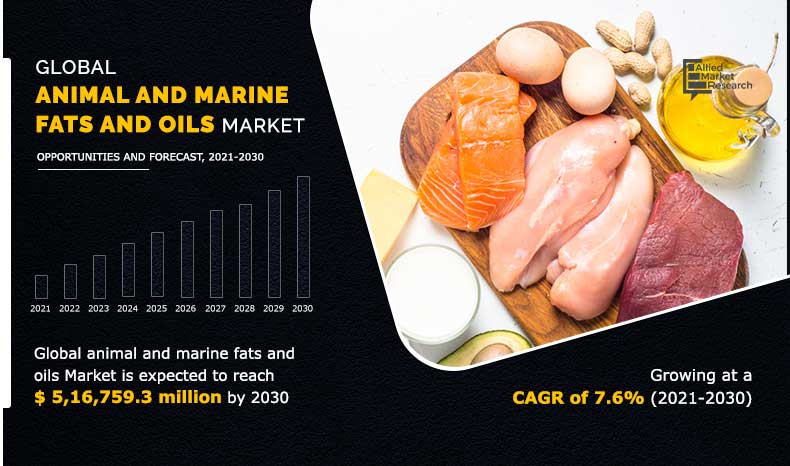
The global animal and marine fats and oils market size was valued at $2,22,335.0 million in 2020, and is estimated to reach $5,16,759.3 million by 2030, registering a CAGR of 7.6% from 2021 to 2030.
Animal and marine oils and fats are water-insoluble, hydrophobic substances of animal origin. In addition, animal oils consist predominantly of glyceryl esters of fatty acids, so-called triglycerides. The fatty acids composition of animal oils and fats varies and with that of the physical properties. Oils are liquid at room temperature, whereas fats are solid. Fats and oils predominantly are triesters (triacylglycerols and triglycerides) of glycerol and aliphatic fatty acids containing up to 22 carbon atoms. Animal fats are commonly consumed in semisolid form as milk, butter, lard, schmaltz, and dripping, or as filler in factory-produced meat, pet food, and fast food products.
Furthermore, increase in demand for animal fat in F&B industry acts as a key driving force of the market. They aid in the enhancement of food flavor and texture. As a result, many food processors and bakers choose fats such as tallow. Moreover, animal fats include high levels of oleic acid, which has been linked to variety of health benefits. In addition, oils and fats are critical raw materials for the production of oleochemicals such as free fatty acids, methyl esters, fatty alcohols, and amines as well as glycerol as a by-product. Consumers in rapidly growing regions, such as Asia-Pacific, are preferring lard over butter in baked goods, which is boosting demand for animal fats.
By Source
Marine segment is expected to grow at highest CAGR of 11.6% during the forecast period
COVID-19 impact on animal and marine fats and oils
The recent COVID-19 outbreak impacted the growth of the animal and marine fats and oils market industry. Increase in reported cases has caused a global lockdown and restricted supply chains. Consumer discretionary spending has decreased, and businesses have noticed a behavioral shift toward safer and more durable products. Furthermore, through engagement campaigns, manufacturers are strengthening their e-commerce channel and increasing consumer engagement on their websites.
In addition, raw material supply from domestic and international suppliers is critical for food and beverage manufacturers. Manufacturers were forced to halt production due to a lack of raw materials, as many governments restricted the movement of goods across borders and within countries. Restriction on the trade of nonessential goods as well as the fear of contamination through manufacturing facilities contribute to the decline of animal and marine fats and oils sales.
By Product Type
Lard segment is expected to grow at highest CAGR of 10.5% during the forecast period.
Moreover, the coronavirus outbreak had a negative impact on the global market for animal and marine fats and oils. These products are available to consumers all over the world via specialty stores and e-commerce platforms. Manufacturing and R&D in the market were halted during the coronavirus pandemic.
The uncertain COVID-19 outbreaks had a significant impact on consumption patterns, affecting the revenues of the related companies. Disruptions in the supply chain of animal and marine fats and oils further had an impact on the animal feed and oleochemical industries.
By Form
Liquid segment is expected to grow at highest CAGR of 5.0% during the forecast period.
According to the animal and marine fats and oils market analysis, the market is segmented into source, product type, form, application, and region. On the basis of source, the market is categorized into animal and marine. Depending on the product type, it is fragmented into tallow, grease, lard, poultry fat and others. As per form, it is divided into liquid and solid.
According to application, the animal and marine fats and oils market is fragmented into biodiesel, animal feed, oleochemical, food industry and others. Region wise, the market is analyzed across North America (the U.S., Canada, and Mexico), Europe (the UK, France, the Netherlands, Germany, Turkey, and the rest of Europe), Asia-Pacific (China, Japan, India, South Korea, Australia, and the rest of Asia-Pacific), and LAMEA (Brazil, South Africa, the UAE, and the rest of LAMEA). As per the animal and marine fats and oils market forecast, the Asia-Pacific is expected to witness a significant growth rate due to the growing penetration of food services and restaurant chains coupled with increasing demand for food and rising disposable income.
By Application
Biodiesel segment is expected to grow at highest CAGR of 9.7% during the forecast period.
The major players operating in the global animal and marine fats and oils market are Ajinomoto Co., Inc., Australian Tallow Producers, Baker Commodities Inc., Cargill, Colyer Fehr Tallow Pty Ltd., Darling industries, Darling Ingredients, Inc., IFFCO, Jacob Stern & Sons Tallow, SARIA SE & Co. KG, Tallow Products Pty Ltd., Ten Kate Vetten BV, and York Foods Pty Ltd. These key market players are constantly engaged in various developmental strategies such as mergers, acquisitions, and joint ventures in order to gain animal and marine fats and oils market share.
By Regions
Asia-Pacific is expected to grow at highest CAGR of 9.5% during the forecast period.
Key Benefits For Stakeholders
- The report provides an extensive analysis of the current and emerging animal and marine fats and oils market trends and opportunities in the market.
- The report provides detailed qualitative and quantitative analysis of current trends and future estimations that help evaluate prevailing market opportunities.
- A comprehensive analysis of the factors that drive and restrict the animal and marine fats and oils market growth is provided.
- An extensive analysis of the market is conducted by following key product positioning and monitoring the top competitors within the market framework.
- The report provides extensive qualitative insights on the potential segments or regions exhibiting favorable growth.
Key Market Segments
By Source
- Animal
- Marine
By Product Type
- Tallow
- Grease
- Lard
- Poultry Fat
- Others
By Form
- Liquid
- Solid
By Application
- Biodiesel
- Animal Feed
- Oleochemical
- Food Industry
- Others
By Region
- North America
- U.S.
- Canada
- Mexico
- Europe
- Germany
- Belgium
- France
- UK
- Italy
- Spain
- Rest of Europe
- Asia-Pacific
- China
- Japan
- India
- South Korea
- Australia
- New Zealand
- Rest of Asia-Pacific
- LAMEA
- Brazil
- South Africa
- Saudi Arabia
- Rest of LAMEA
Animal and Marine Fats and Oils Market Report Highlights
| Aspects | Details |
| By Source |
|
| By Product Type |
|
| By Form |
|
| By Application |
|
| By Region |
|
| Key Market Players | Ajinomoto Co. Inc., York Foods Pty Ltd., Australian Tallow Producers, .CARGILL, INCORPORATED, Darling Ingredients, Inc, Tallow Products Pty Ltd., Ten Kate Vetten BV, Jacob Stern & Sons Inc, Saria SE & Co. KG, Baker Commodities Inc. |
Analyst Review
According to the insights of CXOs of leading companies, animals & marine fats & oils market has witnessed consistent growth in past few years. Moreover, increase in demand for animal fats in F&B industry is one of the key driving factors. .
The lard obtained by melting animals and tallow obtained from raw fat of other animal species are examples of processed animal fats. Animal fats are primarily used in the production of margarine, shortening, and compound fat. In addition, they are found in many processed foods. Animal fats are used in the manufacturing of soaps, fatty acids, lubricants, and feedstuffs.
The demand from countries, particularly India, China, Malaysia, and Indonesia, drives the market. The demand for animal and marine fats and oils is being driven by the respective food sectors of these countries, which are being supported by improvement in living standards and population growth. The growing emphasis on biofuels, such as biodiesel made from animal oils and fats, is driving demand for animal and marine fats and oils.
However, health concerns associated with fats and oils are limiting the growth of the global market; for instance, over consumption of these fats and oils increases the risk of thrombosis.
The key players in the market for animal and marine fats and oils have been expanding into new markets through acquisitions, new product development, agreements, and certifications. New requirements to label trans-fatty acid levels in foods are putting pressure on manufacturers to use alternative methods for producing hydrogenated oils, thus increasing demand for oils with high trans-fat levels.
The global animal and marine fats and oils market size was valued at $2,22,335.0 million in 2020, and is estimated to reach $5,16,759.3 million by 2030
The global Animal and Marine Fats and Oils market is projected to grow at a compound annual growth rate of 7.6% from 2021 to 2030 $5,16,759.3 million by 2030
Jacob Stern & Sons Inc, Ten Kate Vetten BV, .CARGILL, INCORPORATED, Baker Commodities Inc., York Foods Pty Ltd., Ajinomoto Co. Inc., Saria SE & Co. KG, Darling Ingredients, Inc, Tallow Products Pty Ltd., Australian Tallow Producers
Asia-Pacific is expected to grow at highest CAGR
Rise in demand for animal fats in the food & beverage industry and surge in demand from downstream sectors have boosted the growth of the global animal and marine fats and oils market.
Loading Table Of Content...

