0
2022
Animal Therapeutics And Diagnostics Market

Animal Therapeutics and Diagnostics Market

by Product Type (Animal Diagnostics Products, Animal Therapeutics Products), by Animal Type (Companion Animals, Cattle, Pigs, Poultry, Sheep): Global Opportunity Analysis and Industry Forecast, 2020-2030

✷  Report Code: A01619
Mar 2022 | Pages: 188
Tables: 112
Charts: 52
  • Formats*:

  • pdf

    Single User License, Five User
    License & Enterprise User License

  • xls

    Data Pack Excel License

  • ppt

    It comes with the additional cost
    of $2500.00 contact sales.


Animal Therapeutics And Diagnostics Market Statictics - 2030

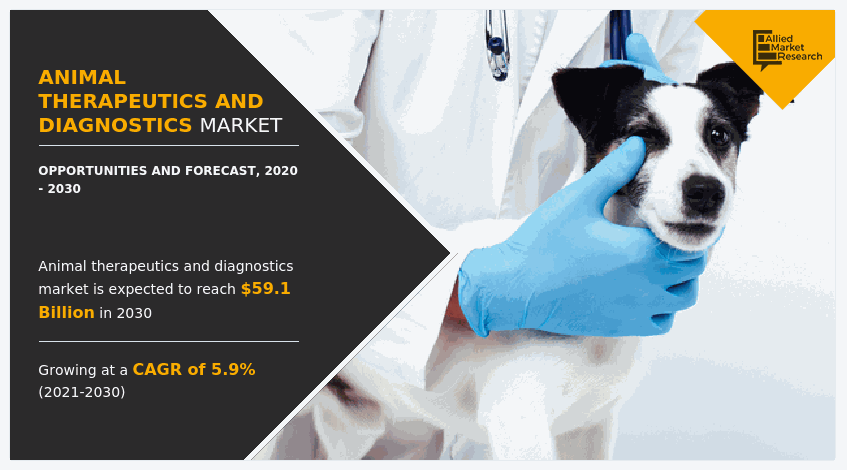
The global animal therapeutics and diagnostics market size was valued at $33,462.50 million in 2020, and is projected to reach $59,082.10 million by 2030, growing at a CAGR of 5.9% from 2021 to 2030. Diagnostic devices help in the identification of disease-causing agents. Animal diagnostics includes a wide range of devices and consumables for diagnosing the disease, which is critical, given the public's reliant on animals. Meat, food, protein, milk, and a variety of other commercial items, such as leather, are all derived from animals. Animal therapies assist in the treatment of diseases, which require the use of medications that cure the illness depending on their mechanism of action. Veterinary diagnostic instruments include laryngoscopes; ophthalmoscopes; ear, nose & throat (ENT) equipment; and polymerase chain reaction (PCR) analyzer. Sedatives, antibiotics, painkillers, and tranquilizers are examples of animal therapeutic agents. With rise in prevalence of new illnesses, constant advancement in animal therapies and diagnostic devices is necessary.
One of the key drivers driver of the global animal therapeutics market is surge in demand for animal-derived food items such as meat. It is critical to ensure high-quality and cost-effective animal protein production for these products to be fit for human consumption. Furthermore, surge in incidence of chronic illnesses such as bovine spongiform encephalopathy as well as increase in knowledge of other zoonotic diseases boost the need for animal therapies and diagnostics among pet and cow owners. With considerable increase in the disposable income, pet owners do not hesitate to spend a little more than usual on the welfare of their pets. This has led to the anticipation that the companion animal healthcare expenses will display considerable growth in future. This increment can enhance the growth of animal diagnostics industry.
Animal Therapeutics and Diagnostics Market

Furthermore, the industry growth is driven by increase in veterinarians in developed nations as well as rise in expenditure on animal health & pet insurance. Furthermore, increase in popularity of companion animals notably contributes toward the growth of the global animal diagnostics industry. Moreover, the health related services provided to pet owners open a number of opportunities for the expansion of animal diagnostics market. Further, exploring benefits of nanoparticles in the veterinary diagnostics and therapeutic products and combination of nanotechnology with molecular diagnostics can help improve the accuracy of treatment and diagnosis of animal diseases.
Animal Therapeutics and Diagnostics Market

Major increase in the growth of companion animal ownership is observed, lack of awareness regarding proper medication and diagnosis still exists. Appropriate knowledge with respect to veterinary medicines and their effect on human health is still limited among the people. Most of the people do not know the positive effects of veterinary medicines on farm animals in Europe including companion animals. There is a vast knowledge gap amongst the companion animals regarding importance of therapeutic products in prevention of transmission of diseases to humans. Such factor will negatively impact the animal diagnostics market.

The COVID 19 outbreak has affected the growth of the animal therapeutics and diagnostics industry owing to the lockdown measure in the countries and delay in production and manufacturing of animal therapeutics and diagnostics products which are utilized for animal treatment and diagnosis.

There is immense progress in the management of animal health via therapeutics and diagnostics. Individual research organizations that work to ensure good health of animals is a part of such progress. Utilization of nuclear medicine for veterinary diagnostics has increased in recent years. Nuclear medicine is a field of diagnostic imaging via radiopharmaceuticals. Examination of veterinary patients such as dogs, cats, horses, and exotic animals incorporate diagnostic techniques, which include scintigraphy and hybrid imaging techniques (Single Photon Emission Computed Tomography [SPECT]) used for small animal diagnostics. These advanced diagnostic techniques observe high sensitivity and specificity, which can be incorporated in the diagnosis of oncological, neurological, endocrine, inflammation, or infection, cardiac, orthopedic, and hereditary diseases. such factor will propel the animal health diagnostics market.

Increase in the disposable income has resulted in the growth of demand for a variety of food products among people. Considerable growth in the population every year has increased the demand for appropriate food supply especially in the developing countries. Consumption of animal protein in the form of meat, eggs, milk, and other dairy products has increased. In 2019, animal protein accounted for 10.6% of the source of calories and recorded to be the second major source of calories in the developing countries. To suffice these demands, adequate rise in number of animals becomes essential with respect to poultry and cattle. This drives the animal therapeutics market.

According to the reports prepared by North American Pet Health Insurance Association (NAPHIA), the pet health insurance recorded a maximum growth in 2019 with the total number of pets insured reaching approximately 1.4 million. An increase in the pet insurance by 12.8% in gross written premiums as compared to 2018 was observed. Prime pet insurance companies operate in North America. Increase in participation of the pet owners in pet insurance has enhanced the growth of animal diagnostics industry.

The novel coronavirus has rapidly spread across various countries and regions, causing an enormous impact on lives of people and the overall community. It began as a human health condition and has now become a significant threat to global trade, economy, and finance. The COVID-19 pandemic has halted production of many products in the animal therapeutics and diagnostics business, owing the lockdowns. Furthermore, the number of COVID-19 cases are expected to reduce in the future as the vaccine for COVID-19 is introduced in the market. This has led to the reopening of animal therapeutics and diagnostics companies at their full-scale capacities. This is expected to help the animal health diagnostics market recover by the start of 2022. After COVID-19 infection cases begin to decline, equipment & machinery producers must focus on protecting their staff, operations, and supply networks to respond to urgent emergencies and establish new methods of working.
Animal Therapeutics and Diagnostics Market

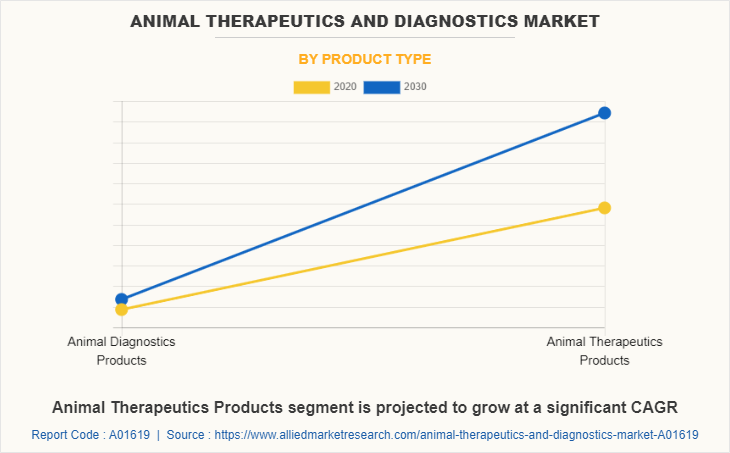
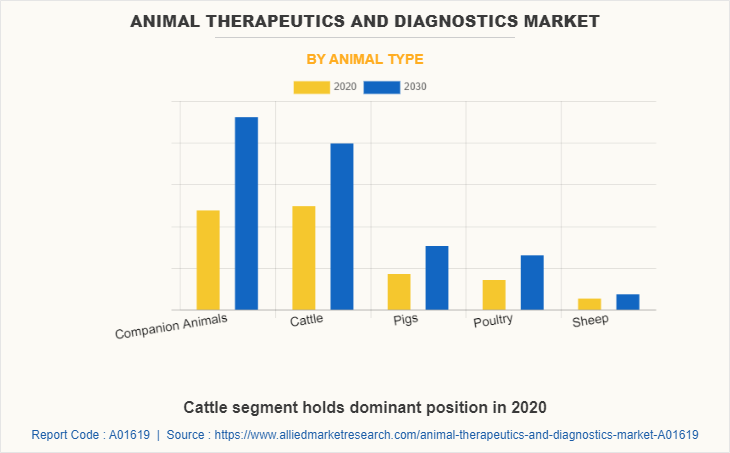
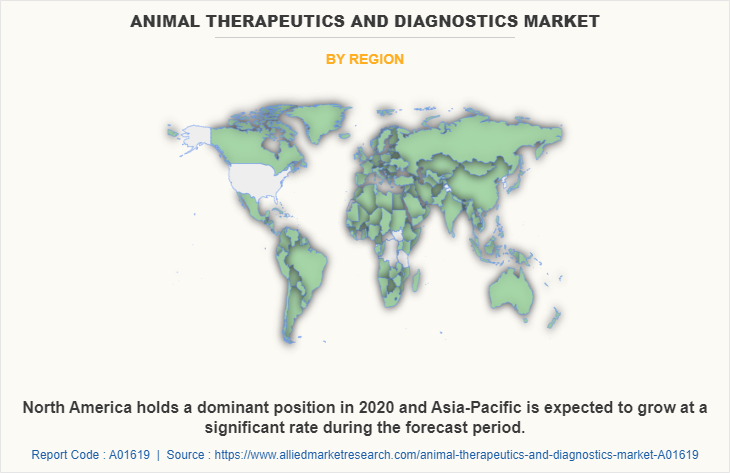
The animal therapeutics and diagnostics market is segmented on the basis of product type, animal type industry, and region. Depending on product type, the market is classified into to animal diagnostics products and animal therapeutics products. By animal type, it is classified as companion animals, cattle, pigs, poultry and sheep. Region wise, the global animal therapeutics and diagnostics market analysis is conducted across North America (the U.S., Canada, and Mexico), Europe (the UK, France, Germany, Italy, and rest of Europe), Asia-Pacific (China, Japan, India, South Korea, and rest of Asia-Pacific), and LAMEA (Latin America, the Middle East, and Africa).

Competition Analysis

The key players operating in the global animal therapeutics and diagnostics market are Zoetis Inc., Elanco Animal Health Incorporated, Boehringer Ingelheim International GmbH, Virbac, Idexx Laboratories Inc., Ceva Sante Animale, Sanofi S.A., Heska Corporation, Thermo Fisher Scientific Inc., and Randox Laboratories Ltd.


Key Benefits For Stakeholders

  • The report provides an extensive analysis of the current and emerging animal therapeutics and diagnostics market trends and dynamics. 
  • In-depth animal therapeutics and diagnostics market analysis is conducted by constructing market estimations for key market segments between 2021 and 2030.
  • The global animal therapeutics and diagnostics market share analysis from 2020 to 2030 is included in the report.
  • Extensive analysis of the animal therapeutics and diagnostics market size is conducted by following key product positioning and monitoring of top competitors within the market framework.
  • A comprehensive analysis of all the regions is provided to determine the prevailing opportunities.
  • The global animal therapeutics and diagnostics market forecast analysis from 2021 to 2030 is included in the report.
  • The key players which contributed to the animal therapeutics and diagnostics market growth are profiled in this report and their strategies are analyzed thoroughly, which help understand the competitive outlook of the animal therapeutics and diagnostics industry.

Animal Therapeutics and Diagnostics Market Report Highlights

Aspects Details
By Product Type
  • Animal Diagnostics Products
  • Animal Therapeutics Products
By Animal Type
  • Companion Animals
  • Cattle
  • Pigs
  • Poultry
  • Sheep
By Region
  • North America  (U.S., Canada, Mexico)
  • Europe  (Germany, France, U.K., Italy, Rest of Europe)
  • Asia-Pacific  (China, India, Japan, South Korea, Rest of Asia-Pacific)
  • LAMEA  (Latin America, Middle East, Africa)
Key Market Players Ceva Sante Animale, Bayer AG, Zoetis Inc., Boehringer, Virbac S.A., Ingelheim GmbH, Eli Lilly and Company, Sanofi S.A., Merck and Co., Nutreco N.V.
 
  • CHAPTER 1:INTRODUCTION

    • 1.1.Report description

    • 1.2.Key market segments

    • 1.3.Key benefits to the stakeholders

    • 1.4.Research Methodology

      • 1.4.1.Secondary research

      • 1.4.2.Primary research

      • 1.4.3.Analyst tools and models

  • CHAPTER 2:EXECUTIVE SUMMARY

    • 2.1.Key findings of the study

    • 2.2.CXO Perspective

  • CHAPTER 3:MARKET OVERVIEW

    • 3.1.Market definition and scope

    • 3.2.Key findings

      • 3.2.1.Top investment pockets

    • 3.3.Porter’s five forces analysis

    • 3.4.Top player positioning

    • 3.5.Market dynamics

      • 3.5.1.Drivers

      • 3.5.2.Restraints

      • 3.5.3.Opportunities

    • 3.6.COVID-19 Impact Analysis on the market

  • CHAPTER 4: ANIMAL THERAPEUTICS AND DIAGNOSTICS MARKET, BY PRODUCT TYPE

    • 4.1 Overview

      • 4.1.1 Market size and forecast

    • 4.2 Animal Diagnostics Products

      • 4.2.1 Key market trends, growth factors and opportunities

      • 4.2.2 Market size and forecast, by region

      • 4.2.3 Market analysis by country

    • 4.3 Animal Therapeutics Products

      • 4.3.1 Key market trends, growth factors and opportunities

      • 4.3.2 Market size and forecast, by region

      • 4.3.3 Market analysis by country

  • CHAPTER 5: ANIMAL THERAPEUTICS AND DIAGNOSTICS MARKET, BY ANIMAL TYPE

    • 5.1 Overview

      • 5.1.1 Market size and forecast

    • 5.2 Companion Animals

      • 5.2.1 Key market trends, growth factors and opportunities

      • 5.2.2 Market size and forecast, by region

      • 5.2.3 Market analysis by country

    • 5.3 Cattle

      • 5.3.1 Key market trends, growth factors and opportunities

      • 5.3.2 Market size and forecast, by region

      • 5.3.3 Market analysis by country

    • 5.4 Pigs

      • 5.4.1 Key market trends, growth factors and opportunities

      • 5.4.2 Market size and forecast, by region

      • 5.4.3 Market analysis by country

    • 5.5 Poultry

      • 5.5.1 Key market trends, growth factors and opportunities

      • 5.5.2 Market size and forecast, by region

      • 5.5.3 Market analysis by country

    • 5.6 Sheep

      • 5.6.1 Key market trends, growth factors and opportunities

      • 5.6.2 Market size and forecast, by region

      • 5.6.3 Market analysis by country

  • CHAPTER 6: ANIMAL THERAPEUTICS AND DIAGNOSTICS MARKET, BY REGION

    • 6.1 Overview

      • 6.1.1 Market size and forecast

    • 6.2 North America

      • 6.2.1 Key trends and opportunities

      • 6.2.2 North America Market size and forecast, by Product Type

      • 6.2.3 North America Market size and forecast, by Animal Type

      • 6.2.4 North America Market size and forecast, by country

        • 6.2.4.1 U.S.
          • 6.2.4.1.1 Market size and forecast, by Product Type
          • 6.2.4.1.2 Market size and forecast, by Animal Type
        • 6.2.4.2 Canada
          • 6.2.4.2.1 Market size and forecast, by Product Type
          • 6.2.4.2.2 Market size and forecast, by Animal Type
        • 6.2.4.3 Mexico
          • 6.2.4.3.1 Market size and forecast, by Product Type
          • 6.2.4.3.2 Market size and forecast, by Animal Type
    • 6.3 Europe

      • 6.3.1 Key trends and opportunities

      • 6.3.2 Europe Market size and forecast, by Product Type

      • 6.3.3 Europe Market size and forecast, by Animal Type

      • 6.3.4 Europe Market size and forecast, by country

        • 6.3.4.1 Germany
          • 6.3.4.1.1 Market size and forecast, by Product Type
          • 6.3.4.1.2 Market size and forecast, by Animal Type
        • 6.3.4.2 France
          • 6.3.4.2.1 Market size and forecast, by Product Type
          • 6.3.4.2.2 Market size and forecast, by Animal Type
        • 6.3.4.3 U.K.
          • 6.3.4.3.1 Market size and forecast, by Product Type
          • 6.3.4.3.2 Market size and forecast, by Animal Type
        • 6.3.4.4 Italy
          • 6.3.4.4.1 Market size and forecast, by Product Type
          • 6.3.4.4.2 Market size and forecast, by Animal Type
        • 6.3.4.5 Rest of Europe
          • 6.3.4.5.1 Market size and forecast, by Product Type
          • 6.3.4.5.2 Market size and forecast, by Animal Type
    • 6.4 Asia-Pacific

      • 6.4.1 Key trends and opportunities

      • 6.4.2 Asia-Pacific Market size and forecast, by Product Type

      • 6.4.3 Asia-Pacific Market size and forecast, by Animal Type

      • 6.4.4 Asia-Pacific Market size and forecast, by country

        • 6.4.4.1 China
          • 6.4.4.1.1 Market size and forecast, by Product Type
          • 6.4.4.1.2 Market size and forecast, by Animal Type
        • 6.4.4.2 India
          • 6.4.4.2.1 Market size and forecast, by Product Type
          • 6.4.4.2.2 Market size and forecast, by Animal Type
        • 6.4.4.3 Japan
          • 6.4.4.3.1 Market size and forecast, by Product Type
          • 6.4.4.3.2 Market size and forecast, by Animal Type
        • 6.4.4.4 South Korea
          • 6.4.4.4.1 Market size and forecast, by Product Type
          • 6.4.4.4.2 Market size and forecast, by Animal Type
        • 6.4.4.5 Rest of Asia-Pacific
          • 6.4.4.5.1 Market size and forecast, by Product Type
          • 6.4.4.5.2 Market size and forecast, by Animal Type
    • 6.5 LAMEA

      • 6.5.1 Key trends and opportunities

      • 6.5.2 LAMEA Market size and forecast, by Product Type

      • 6.5.3 LAMEA Market size and forecast, by Animal Type

      • 6.5.4 LAMEA Market size and forecast, by country

        • 6.5.4.1 Latin America
          • 6.5.4.1.1 Market size and forecast, by Product Type
          • 6.5.4.1.2 Market size and forecast, by Animal Type
        • 6.5.4.2 Middle East
          • 6.5.4.2.1 Market size and forecast, by Product Type
          • 6.5.4.2.2 Market size and forecast, by Animal Type
        • 6.5.4.3 Africa
          • 6.5.4.3.1 Market size and forecast, by Product Type
          • 6.5.4.3.2 Market size and forecast, by Animal Type
  • CHAPTER 7: COMPANY LANDSCAPE

    • 7.1. Introduction

    • 7.2. Top winning strategies

    • 7.3. Product Mapping of Top 10 Player

    • 7.4. Competitive Dashboard

    • 7.5. Competitive Heatmap

    • 7.6. Key developments

  • CHAPTER 8: COMPANY PROFILES

    • 8.1 Bayer AG

      • 8.1.1 Company overview

      • 8.1.2 Company snapshot

      • 8.1.3 Operating business segments

      • 8.1.4 Product portfolio

      • 8.1.5 Business performance

      • 8.1.6 Key strategic moves and developments

    • 8.2 Eli Lilly and Company

      • 8.2.1 Company overview

      • 8.2.2 Company snapshot

      • 8.2.3 Operating business segments

      • 8.2.4 Product portfolio

      • 8.2.5 Business performance

      • 8.2.6 Key strategic moves and developments

    • 8.3 Boehringer

      • 8.3.1 Company overview

      • 8.3.2 Company snapshot

      • 8.3.3 Operating business segments

      • 8.3.4 Product portfolio

      • 8.3.5 Business performance

      • 8.3.6 Key strategic moves and developments

    • 8.4 Ingelheim GmbH

      • 8.4.1 Company overview

      • 8.4.2 Company snapshot

      • 8.4.3 Operating business segments

      • 8.4.4 Product portfolio

      • 8.4.5 Business performance

      • 8.4.6 Key strategic moves and developments

    • 8.5 Merck and Co.

      • 8.5.1 Company overview

      • 8.5.2 Company snapshot

      • 8.5.3 Operating business segments

      • 8.5.4 Product portfolio

      • 8.5.5 Business performance

      • 8.5.6 Key strategic moves and developments

    • 8.6 Zoetis Inc.

      • 8.6.1 Company overview

      • 8.6.2 Company snapshot

      • 8.6.3 Operating business segments

      • 8.6.4 Product portfolio

      • 8.6.5 Business performance

      • 8.6.6 Key strategic moves and developments

    • 8.7 Ceva Sante Animale

      • 8.7.1 Company overview

      • 8.7.2 Company snapshot

      • 8.7.3 Operating business segments

      • 8.7.4 Product portfolio

      • 8.7.5 Business performance

      • 8.7.6 Key strategic moves and developments

    • 8.8 Sanofi S.A.

      • 8.8.1 Company overview

      • 8.8.2 Company snapshot

      • 8.8.3 Operating business segments

      • 8.8.4 Product portfolio

      • 8.8.5 Business performance

      • 8.8.6 Key strategic moves and developments

    • 8.9 Nutreco N.V.

      • 8.9.1 Company overview

      • 8.9.2 Company snapshot

      • 8.9.3 Operating business segments

      • 8.9.4 Product portfolio

      • 8.9.5 Business performance

      • 8.9.6 Key strategic moves and developments

    • 8.10 Virbac S.A.

      • 8.10.1 Company overview

      • 8.10.2 Company snapshot

      • 8.10.3 Operating business segments

      • 8.10.4 Product portfolio

      • 8.10.5 Business performance

      • 8.10.6 Key strategic moves and developments

  • LIST OF TABLES

  • TABLE 1. GLOBAL ANIMAL THERAPEUTICS AND DIAGNOSTICS MARKET, BY PRODUCT TYPE, 2020-2030,($MILLION)
    TABLE 2. ANIMAL THERAPEUTICS AND DIAGNOSTICS MARKET REVENUE, FOR ANIMAL DIAGNOSTICS PRODUCTS, BY REGION , 2020-2030,($MILLION)
    TABLE 3. ANIMAL THERAPEUTICS AND DIAGNOSTICS MARKET ANIMAL DIAGNOSTICS PRODUCTS BY COUNTRY, 2020-2030,($MILLION)
    TABLE 4. ANIMAL THERAPEUTICS AND DIAGNOSTICS MARKET REVENUE, FOR ANIMAL THERAPEUTICS PRODUCTS, BY REGION , 2020-2030,($MILLION)
    TABLE 5. ANIMAL THERAPEUTICS AND DIAGNOSTICS MARKET ANIMAL THERAPEUTICS PRODUCTS BY COUNTRY, 2020-2030,($MILLION)
    TABLE 6. GLOBAL ANIMAL THERAPEUTICS AND DIAGNOSTICS MARKET, BY ANIMAL TYPE, 2020-2030,($MILLION)
    TABLE 7. ANIMAL THERAPEUTICS AND DIAGNOSTICS MARKET REVENUE, FOR COMPANION ANIMALS, BY REGION , 2020-2030,($MILLION)
    TABLE 8. ANIMAL THERAPEUTICS AND DIAGNOSTICS MARKET COMPANION ANIMALS BY COUNTRY, 2020-2030,($MILLION)
    TABLE 9. ANIMAL THERAPEUTICS AND DIAGNOSTICS MARKET REVENUE, FOR CATTLE, BY REGION , 2020-2030,($MILLION)
    TABLE 10. ANIMAL THERAPEUTICS AND DIAGNOSTICS MARKET CATTLE BY COUNTRY, 2020-2030,($MILLION)
    TABLE 11. ANIMAL THERAPEUTICS AND DIAGNOSTICS MARKET REVENUE, FOR PIGS, BY REGION , 2020-2030,($MILLION)
    TABLE 12. ANIMAL THERAPEUTICS AND DIAGNOSTICS MARKET PIGS BY COUNTRY, 2020-2030,($MILLION)
    TABLE 13. ANIMAL THERAPEUTICS AND DIAGNOSTICS MARKET REVENUE, FOR POULTRY, BY REGION , 2020-2030,($MILLION)
    TABLE 14. ANIMAL THERAPEUTICS AND DIAGNOSTICS MARKET POULTRY BY COUNTRY, 2020-2030,($MILLION)
    TABLE 15. ANIMAL THERAPEUTICS AND DIAGNOSTICS MARKET REVENUE, FOR SHEEP, BY REGION , 2020-2030,($MILLION)
    TABLE 16. ANIMAL THERAPEUTICS AND DIAGNOSTICS MARKET SHEEP BY COUNTRY, 2020-2030,($MILLION)
    TABLE 17. ANIMAL THERAPEUTICS AND DIAGNOSTICS MARKET, BY REGION, 2020-2030,($MILLION)
    TABLE 18. NORTH AMERICA ANIMAL THERAPEUTICS AND DIAGNOSTICS MARKET, BY PRODUCT TYPE, 2020-2030,($MILLION)
    TABLE 19. NORTH AMERICA ANIMAL THERAPEUTICS AND DIAGNOSTICS MARKET, BY ANIMAL TYPE, 2020-2030,($MILLION)
    TABLE 20. NORTH AMERICA ANIMAL THERAPEUTICS AND DIAGNOSTICS MARKET, BY COUNTRY, 2020-2030,($MILLION)
    TABLE 21. U.S. ANIMAL THERAPEUTICS AND DIAGNOSTICS MARKET BY PRODUCT TYPE 2020-2030,($MILLION)
    TABLE 22. U.S. ANIMAL THERAPEUTICS AND DIAGNOSTICS MARKET BY ANIMAL TYPE 2020-2030,($MILLION)
    TABLE 23. CANADA ANIMAL THERAPEUTICS AND DIAGNOSTICS MARKET BY PRODUCT TYPE 2020-2030,($MILLION)
    TABLE 24. CANADA ANIMAL THERAPEUTICS AND DIAGNOSTICS MARKET BY ANIMAL TYPE 2020-2030,($MILLION)
    TABLE 25. MEXICO ANIMAL THERAPEUTICS AND DIAGNOSTICS MARKET BY PRODUCT TYPE 2020-2030,($MILLION)
    TABLE 26. MEXICO ANIMAL THERAPEUTICS AND DIAGNOSTICS MARKET BY ANIMAL TYPE 2020-2030,($MILLION)
    TABLE 27. EUROPE ANIMAL THERAPEUTICS AND DIAGNOSTICS MARKET, BY PRODUCT TYPE, 2020-2030,($MILLION)
    TABLE 28. EUROPE ANIMAL THERAPEUTICS AND DIAGNOSTICS MARKET, BY ANIMAL TYPE, 2020-2030,($MILLION)
    TABLE 29. EUROPE ANIMAL THERAPEUTICS AND DIAGNOSTICS MARKET, BY COUNTRY, 2020-2030,($MILLION)
    TABLE 30. GERMANY ANIMAL THERAPEUTICS AND DIAGNOSTICS MARKET BY PRODUCT TYPE 2020-2030,($MILLION)
    TABLE 31. GERMANY ANIMAL THERAPEUTICS AND DIAGNOSTICS MARKET BY ANIMAL TYPE 2020-2030,($MILLION)
    TABLE 32. FRANCE ANIMAL THERAPEUTICS AND DIAGNOSTICS MARKET BY PRODUCT TYPE 2020-2030,($MILLION)
    TABLE 33. FRANCE ANIMAL THERAPEUTICS AND DIAGNOSTICS MARKET BY ANIMAL TYPE 2020-2030,($MILLION)
    TABLE 34. U.K. ANIMAL THERAPEUTICS AND DIAGNOSTICS MARKET BY PRODUCT TYPE 2020-2030,($MILLION)
    TABLE 35. U.K. ANIMAL THERAPEUTICS AND DIAGNOSTICS MARKET BY ANIMAL TYPE 2020-2030,($MILLION)
    TABLE 36. ITALY ANIMAL THERAPEUTICS AND DIAGNOSTICS MARKET BY PRODUCT TYPE 2020-2030,($MILLION)
    TABLE 37. ITALY ANIMAL THERAPEUTICS AND DIAGNOSTICS MARKET BY ANIMAL TYPE 2020-2030,($MILLION)
    TABLE 38. REST OF EUROPE ANIMAL THERAPEUTICS AND DIAGNOSTICS MARKET BY PRODUCT TYPE 2020-2030,($MILLION)
    TABLE 39. REST OF EUROPE ANIMAL THERAPEUTICS AND DIAGNOSTICS MARKET BY ANIMAL TYPE 2020-2030,($MILLION)
    TABLE 40. ASIA-PACIFIC ANIMAL THERAPEUTICS AND DIAGNOSTICS MARKET, BY PRODUCT TYPE, 2020-2030,($MILLION)
    TABLE 41. ASIA-PACIFIC ANIMAL THERAPEUTICS AND DIAGNOSTICS MARKET, BY ANIMAL TYPE, 2020-2030,($MILLION)
    TABLE 42. ASIA-PACIFIC ANIMAL THERAPEUTICS AND DIAGNOSTICS MARKET, BY COUNTRY, 2020-2030,($MILLION)
    TABLE 43. CHINA ANIMAL THERAPEUTICS AND DIAGNOSTICS MARKET BY PRODUCT TYPE 2020-2030,($MILLION)
    TABLE 44. CHINA ANIMAL THERAPEUTICS AND DIAGNOSTICS MARKET BY ANIMAL TYPE 2020-2030,($MILLION)
    TABLE 45. INDIA ANIMAL THERAPEUTICS AND DIAGNOSTICS MARKET BY PRODUCT TYPE 2020-2030,($MILLION)
    TABLE 46. INDIA ANIMAL THERAPEUTICS AND DIAGNOSTICS MARKET BY ANIMAL TYPE 2020-2030,($MILLION)
    TABLE 47. JAPAN ANIMAL THERAPEUTICS AND DIAGNOSTICS MARKET BY PRODUCT TYPE 2020-2030,($MILLION)
    TABLE 48. JAPAN ANIMAL THERAPEUTICS AND DIAGNOSTICS MARKET BY ANIMAL TYPE 2020-2030,($MILLION)
    TABLE 49. SOUTH KOREA ANIMAL THERAPEUTICS AND DIAGNOSTICS MARKET BY PRODUCT TYPE 2020-2030,($MILLION)
    TABLE 50. SOUTH KOREA ANIMAL THERAPEUTICS AND DIAGNOSTICS MARKET BY ANIMAL TYPE 2020-2030,($MILLION)
    TABLE 51. REST OF ASIA-PACIFIC ANIMAL THERAPEUTICS AND DIAGNOSTICS MARKET BY PRODUCT TYPE 2020-2030,($MILLION)
    TABLE 52. REST OF ASIA-PACIFIC ANIMAL THERAPEUTICS AND DIAGNOSTICS MARKET BY ANIMAL TYPE 2020-2030,($MILLION)
    TABLE 53. LAMEA ANIMAL THERAPEUTICS AND DIAGNOSTICS MARKET, BY PRODUCT TYPE, 2020-2030,($MILLION)
    TABLE 54. LAMEA ANIMAL THERAPEUTICS AND DIAGNOSTICS MARKET, BY ANIMAL TYPE, 2020-2030,($MILLION)
    TABLE 55. LAMEA ANIMAL THERAPEUTICS AND DIAGNOSTICS MARKET, BY COUNTRY, 2020-2030,($MILLION)
    TABLE 56. LATIN AMERICA ANIMAL THERAPEUTICS AND DIAGNOSTICS MARKET BY PRODUCT TYPE 2020-2030,($MILLION)
    TABLE 57. LATIN AMERICA ANIMAL THERAPEUTICS AND DIAGNOSTICS MARKET BY ANIMAL TYPE 2020-2030,($MILLION)
    TABLE 58. MIDDLE EAST ANIMAL THERAPEUTICS AND DIAGNOSTICS MARKET BY PRODUCT TYPE 2020-2030,($MILLION)
    TABLE 59. MIDDLE EAST ANIMAL THERAPEUTICS AND DIAGNOSTICS MARKET BY ANIMAL TYPE 2020-2030,($MILLION)
    TABLE 60. AFRICA ANIMAL THERAPEUTICS AND DIAGNOSTICS MARKET BY PRODUCT TYPE 2020-2030,($MILLION)
    TABLE 61. AFRICA ANIMAL THERAPEUTICS AND DIAGNOSTICS MARKET BY ANIMAL TYPE 2020-2030,($MILLION)
    TABLE 62.BAYER AG: COMPANY SNAPSHOT
    TABLE 63.BAYER AG: OPERATING SEGMENTS
    TABLE 64.BAYER AG: PRODUCT PORTFOLIO
    TABLE 65.BAYER AG: NET SALES,
    TABLE 66.BAYER AG: KEY STRATERGIES
    TABLE 67.ELI LILLY AND COMPANY: COMPANY SNAPSHOT
    TABLE 68.ELI LILLY AND COMPANY: OPERATING SEGMENTS
    TABLE 69.ELI LILLY AND COMPANY: PRODUCT PORTFOLIO
    TABLE 70.ELI LILLY AND COMPANY: NET SALES,
    TABLE 71.ELI LILLY AND COMPANY: KEY STRATERGIES
    TABLE 72.BOEHRINGER: COMPANY SNAPSHOT
    TABLE 73.BOEHRINGER: OPERATING SEGMENTS
    TABLE 74.BOEHRINGER: PRODUCT PORTFOLIO
    TABLE 75.BOEHRINGER: NET SALES,
    TABLE 76.BOEHRINGER: KEY STRATERGIES
    TABLE 77.INGELHEIM GMBH: COMPANY SNAPSHOT
    TABLE 78.INGELHEIM GMBH: OPERATING SEGMENTS
    TABLE 79.INGELHEIM GMBH: PRODUCT PORTFOLIO
    TABLE 80.INGELHEIM GMBH: NET SALES,
    TABLE 81.INGELHEIM GMBH: KEY STRATERGIES
    TABLE 82.MERCK AND CO.: COMPANY SNAPSHOT
    TABLE 83.MERCK AND CO.: OPERATING SEGMENTS
    TABLE 84.MERCK AND CO.: PRODUCT PORTFOLIO
    TABLE 85.MERCK AND CO.: NET SALES,
    TABLE 86.MERCK AND CO.: KEY STRATERGIES
    TABLE 87.ZOETIS INC.: COMPANY SNAPSHOT
    TABLE 88.ZOETIS INC.: OPERATING SEGMENTS
    TABLE 89.ZOETIS INC.: PRODUCT PORTFOLIO
    TABLE 90.ZOETIS INC.: NET SALES,
    TABLE 91.ZOETIS INC.: KEY STRATERGIES
    TABLE 92.CEVA SANTE ANIMALE: COMPANY SNAPSHOT
    TABLE 93.CEVA SANTE ANIMALE: OPERATING SEGMENTS
    TABLE 94.CEVA SANTE ANIMALE: PRODUCT PORTFOLIO
    TABLE 95.CEVA SANTE ANIMALE: NET SALES,
    TABLE 96.CEVA SANTE ANIMALE: KEY STRATERGIES
    TABLE 97.SANOFI S.A.: COMPANY SNAPSHOT
    TABLE 98.SANOFI S.A.: OPERATING SEGMENTS
    TABLE 99.SANOFI S.A.: PRODUCT PORTFOLIO
    TABLE 100.SANOFI S.A.: NET SALES,
    TABLE 101.SANOFI S.A.: KEY STRATERGIES
    TABLE 102.NUTRECO N.V.: COMPANY SNAPSHOT
    TABLE 103.NUTRECO N.V.: OPERATING SEGMENTS
    TABLE 104.NUTRECO N.V.: PRODUCT PORTFOLIO
    TABLE 105.NUTRECO N.V.: NET SALES,
    TABLE 106.NUTRECO N.V.: KEY STRATERGIES
    TABLE 107.VIRBAC S.A.: COMPANY SNAPSHOT
    TABLE 108.VIRBAC S.A.: OPERATING SEGMENTS
    TABLE 109.VIRBAC S.A.: PRODUCT PORTFOLIO
    TABLE 110.VIRBAC S.A.: NET SALES,
    TABLE 111.VIRBAC S.A.: KEY STRATERGIES
  • LIST OF FIGURES

  • FIGURE 1.ANIMAL THERAPEUTICS AND DIAGNOSTICS MARKET SEGMENTATION
    FIGURE 2.ANIMAL THERAPEUTICS AND DIAGNOSTICS MARKET,2020-2030
    FIGURE 3.ANIMAL THERAPEUTICS AND DIAGNOSTICS MARKET,2020-2030
    FIGURE 4. TOP INVESTMENT POCKETS, BY REGION
    FIGURE 5.PORTER FIVE-1
    FIGURE 6.PORTER FIVE-2
    FIGURE 7.PORTER FIVE-3
    FIGURE 8.PORTER FIVE-4
    FIGURE 9.PORTER FIVE-5
    FIGURE 10.TOP PLAYER POSITIONING
    FIGURE 11.ANIMAL THERAPEUTICS AND DIAGNOSTICS MARKET:DRIVERS, RESTRAINTS AND OPPORTUNITIES
    FIGURE 11.ANIMAL THERAPEUTICS AND DIAGNOSTICS MARKET,BY PRODUCT TYPE,2020(%)
    FIGURE 12.COMPARATIVE SHARE ANALYSIS OF ANIMAL DIAGNOSTICS PRODUCTS ANIMAL THERAPEUTICS AND DIAGNOSTICS MARKET,2020-2030(%)
    FIGURE 13.COMPARATIVE SHARE ANALYSIS OF ANIMAL THERAPEUTICS PRODUCTS ANIMAL THERAPEUTICS AND DIAGNOSTICS MARKET,2020-2030(%)
    FIGURE 14.ANIMAL THERAPEUTICS AND DIAGNOSTICS MARKET,BY ANIMAL TYPE,2020(%)
    FIGURE 15.COMPARATIVE SHARE ANALYSIS OF COMPANION ANIMALS ANIMAL THERAPEUTICS AND DIAGNOSTICS MARKET,2020-2030(%)
    FIGURE 16.COMPARATIVE SHARE ANALYSIS OF CATTLE ANIMAL THERAPEUTICS AND DIAGNOSTICS MARKET,2020-2030(%)
    FIGURE 17.COMPARATIVE SHARE ANALYSIS OF PIGS ANIMAL THERAPEUTICS AND DIAGNOSTICS MARKET,2020-2030(%)
    FIGURE 18.COMPARATIVE SHARE ANALYSIS OF POULTRY ANIMAL THERAPEUTICS AND DIAGNOSTICS MARKET,2020-2030(%)
    FIGURE 19.COMPARATIVE SHARE ANALYSIS OF SHEEP ANIMAL THERAPEUTICS AND DIAGNOSTICS MARKET,2020-2030(%)
    FIGURE 20.ANIMAL THERAPEUTICS AND DIAGNOSTICS MARKET BY REGION,2020
    FIGURE 21.U.S. ANIMAL THERAPEUTICS AND DIAGNOSTICS MARKET,2020-2030($MILLION)
    FIGURE 22.CANADA ANIMAL THERAPEUTICS AND DIAGNOSTICS MARKET,2020-2030($MILLION)
    FIGURE 23.MEXICO ANIMAL THERAPEUTICS AND DIAGNOSTICS MARKET,2020-2030($MILLION)
    FIGURE 24.GERMANY ANIMAL THERAPEUTICS AND DIAGNOSTICS MARKET,2020-2030($MILLION)
    FIGURE 25.FRANCE ANIMAL THERAPEUTICS AND DIAGNOSTICS MARKET,2020-2030($MILLION)
    FIGURE 26.U.K. ANIMAL THERAPEUTICS AND DIAGNOSTICS MARKET,2020-2030($MILLION)
    FIGURE 27.ITALY ANIMAL THERAPEUTICS AND DIAGNOSTICS MARKET,2020-2030($MILLION)
    FIGURE 28.REST OF EUROPE ANIMAL THERAPEUTICS AND DIAGNOSTICS MARKET,2020-2030($MILLION)
    FIGURE 29.CHINA ANIMAL THERAPEUTICS AND DIAGNOSTICS MARKET,2020-2030($MILLION)
    FIGURE 30.INDIA ANIMAL THERAPEUTICS AND DIAGNOSTICS MARKET,2020-2030($MILLION)
    FIGURE 31.JAPAN ANIMAL THERAPEUTICS AND DIAGNOSTICS MARKET,2020-2030($MILLION)
    FIGURE 32.SOUTH KOREA ANIMAL THERAPEUTICS AND DIAGNOSTICS MARKET,2020-2030($MILLION)
    FIGURE 33.REST OF ASIA-PACIFIC ANIMAL THERAPEUTICS AND DIAGNOSTICS MARKET,2020-2030($MILLION)
    FIGURE 34.LATIN AMERICA ANIMAL THERAPEUTICS AND DIAGNOSTICS MARKET,2020-2030($MILLION)
    FIGURE 35.MIDDLE EAST ANIMAL THERAPEUTICS AND DIAGNOSTICS MARKET,2020-2030($MILLION)
    FIGURE 36.AFRICA ANIMAL THERAPEUTICS AND DIAGNOSTICS MARKET,2020-2030($MILLION)
    FIGURE 37. TOP WINNING STRATEGIES, BY YEAR
    FIGURE 38. TOP WINNING STRATEGIES, BY DEVELOPMENT
    FIGURE 39. TOP WINNING STRATEGIES, BY COMPANY
    FIGURE 40.PRODUCT MAPPING OF TOP 10 PLAYERS
    FIGURE 41.COMPETITIVE DASHBOARD
    FIGURE 42.COMPETITIVE HEATMAP OF TOP 10 KEY PLAYERS
    FIGURE 43.BAYER AG.: NET SALES ,($MILLION)
    FIGURE 44.ELI LILLY AND COMPANY.: NET SALES ,($MILLION)
    FIGURE 45.BOEHRINGER.: NET SALES ,($MILLION)
    FIGURE 46.INGELHEIM GMBH.: NET SALES ,($MILLION)
    FIGURE 47.MERCK AND CO..: NET SALES ,($MILLION)
    FIGURE 48.ZOETIS INC..: NET SALES ,($MILLION)
    FIGURE 49.CEVA SANTE ANIMALE.: NET SALES ,($MILLION)
    FIGURE 50.SANOFI S.A..: NET SALES ,($MILLION)
    FIGURE 51.NUTRECO N.V..: NET SALES ,($MILLION)
    FIGURE 52.VIRBAC S.A..: NET SALES ,($MILLION)


The current trend of point-of-care diagnostics and anti-parasitic medicines and antibiotics is driving the ’expansion of the animal therapeutics and diagnostics marker. The market is focusing on the requirement for animal-derived food items such as meat & milk and the necessity of companion animal for purpose of protecting environment. Furthermore, developed countries consume more animal-based food (rather than plant-based meals) and spend more on pets due to their higher purchasing power. As a result, the market is expected to witness notable growth in developed countries. In addition, as the purchasing power improves in emerging nations, there will be a greater need for animal-based foods, which is likely to boost the growth of the animal therapies industry.

Various key players are implementing strategic moves such as collaboration and partnership to strengthen its market position and expand their product portfolio. For instance, in January 2022, a pharmaceuticals company, Boehringer Ingelheim collaborated with MabGenesis, a Japan-based biopharmaceutical startup. This collaboration aims to develop innovative and advanced therapeutic antibodies in canine using the MabGenesis’ platform technologies.

PURCHASE OPTIONS

Call or Email us

U.S.-Canada Toll-free: +1-800-792-5285
Int'l : +1-503-894-6022
Europe : +44-845-528-1300
Email : help@alliedmarketresearch.com
 
FREQUENTLY ASKED QUESTIONS?

A. The animal therapeutics and diagnostics market size was valued at $33,462.5 million in 2020.

A. Based on product type, the animal therapeutics products hold the maximum market share of the animal therapeutics and diagnostics market in 2020.

A. The animal therapeutics and diagnostics market is projected to reach $59,082.1 million by 2030.

A. Rising demand for animal deprived food products and rising concern to prevent zoonotic diseases are the key trends in the animal therapeutics and diagnostics market.

A. The product launch is key growth strategy of animal therapeutics and diagnostics industry players.

A. The company profile has been selected on factors such as geographical presence, market dominance (in terms of revenue and volume sales), various strategies and recent developments.

Looking for Customization?

 Customization Request

Have a Question?

 Speak with Analyst

Any Confusion?

 Inquire Before Buying

Have a glance of the Report

  Request Sample
RELATED TAGS

Purchase Full Report of
Animal Therapeutics And Diagnostics Market

Start reading instantly.
This Report and over 66,905+ more Reports, Available with Avenue Library. T&C*.

  • Online Only
  • $3,456
  • Online cloud access only
  • Restricted print, copy, paste & download
  • Read only
  • Free industry update
    (Within 180 days)
  • Free report update in next update cycle
    (Mar 2023 - Mar 2024)
  • Data Pack
  • $3,840
  • Restricted to one authorized user
  • One print only
  • Available in
    Excel
  • Free industry update
    (Within 180 days)
  •   Free report update in next update cycle
    (Mar 2023 - Mar 2024)
  • Single User
  • $5,769
  • Restricted to one authorized user
  • One print only
  • Available in
    PDF
  • Free industry update
    (Within 180 days)
  •   Free report update in next update cycle
    (Mar 2023 - Mar 2024)
  • Five Users
  • $6,450
  • Limited to five authorized users
  • Print upto five copies
  • Available in
    PDF
  • Free industry update
    (Within 180 days)
  •   Free report update in next update cycle
    (Mar 2023 - Mar 2024)
  • Enterprise
    License/PDF

  • $10,995
  • Unlimited
    within
    company/enterprise
  • Available in Excel & PDF
  • Free industry update
    (Within 180 days)
  •   Free report update in next update cycle
    (Mar 2023 - Mar 2024)
  • Library
    Membership

  • $999 $ 1,175
    Per User/ Per month/ Billed annually
  • Published Content
    E-access
  • Company Profiles
    E-access
  • Newly Added Content Access
  • 10 PDF
    Downloads
  • 5 Excel Data
    Pack Downloads
  • 250 Company Profiles PDF Downloads
  • Buy Now

*Taxes/Fees, if applicable will be added during checkout. All prices in USD

RELATED REPORTS
 

Why Allied Market Research?


Infallible Methodology

To ensure high-level data integrity, accurate analysis, and impeccable forecasts

Analyst Support

For complete satisfaction

Customization

On-demand customization of scope of the report to exactly meet your needs

TARGETED MARKET VIEW

Targeted market view to provide pertinent information and save time of readers

Get fresh content delivered

Get insights on topics that are crucial for your business. Stay abreast of your interest areas.

Get Industry Data Alerts

Why Allied Market Research?

Infallible Methodology

To ensure high-level data integrity, accurate analysis, and impeccable forecasts

Analyst Support

For complete satisfaction

Customization

On-demand customization of scope of the report to exactly meet your needs

TARGETED MARKET VIEW

Targeted market view to provide pertinent information and save time of readers