Report Code: A04704 | Oct 2018 | Pages: 250 | ||
Tables: 99 | Charts: 19 |
|
Pandemic disrupted the entire world and affected many industries.
Get detailed COVID-19 impact analysis on the Asia-pacific Condiments Market
Request Now !Asia-Pacific Condiments Market Overview :
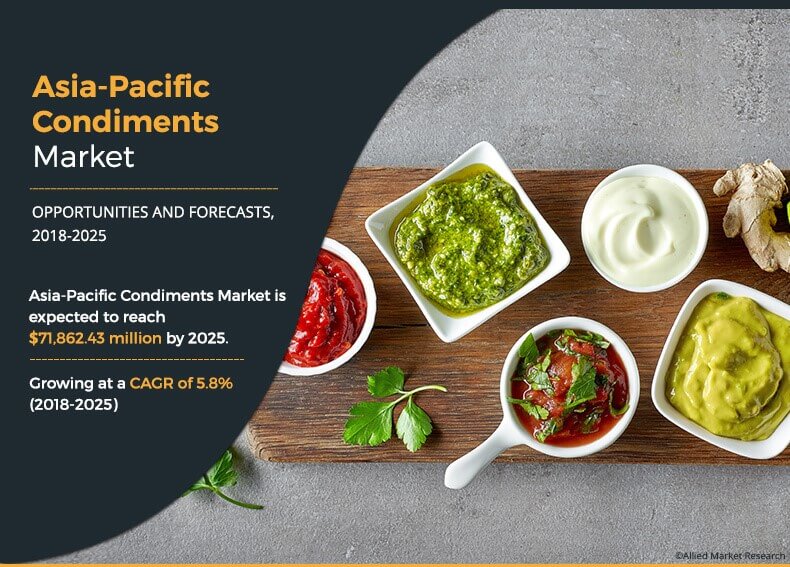
The Asia-Pacific condiments market size was $45,762.75 million in 2017 and is projected to reach $71,862.43 million by 2025, growing at a CAGR of 5.8% from 2018 to 2025. Rapid economic growth and increase in per capita income in Asia-Pacific leads to significant changes in food production. There is a change in the food consumption patterns, owing to increased foreign travel and cross cultural interaction. The marinades segment constitutes a major portion of the Asia-Pacific condiments market, owing to the popularity of meat in Asian countries such as China, Japan, and India. This is anticipated to boost the demand for the Asia-Pacific condiments market, thereby, driving the Asia-Pacific condiments market growth. In addition, rise in demand for the meat & seafood segment further drives the growth of the Asia-Pacific condiments market.
Â
The leading players in the Asia-Pacific condiments market have focused on product launch as their key strategy to gain a significant share in the condiment market. The key players profiled in the report include Kraft-Heinz, Inc., Nestl, Yeo Hiap Seng Ltd, Three Threes Condiments Pty Limited, Hormel Foods Corporation, NutriAsia, Unilever, Kikkoman Corporation, McCormick & Company, Inc., and Del Monte Foods, Inc.
Â
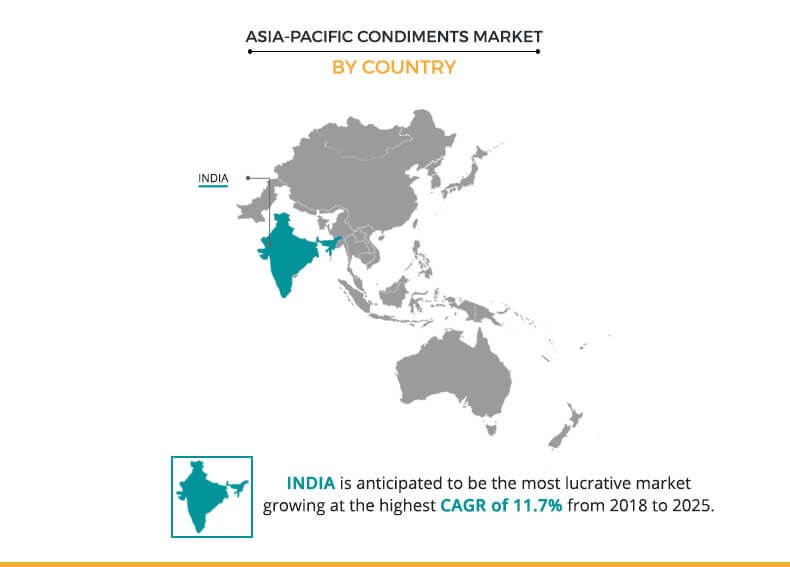
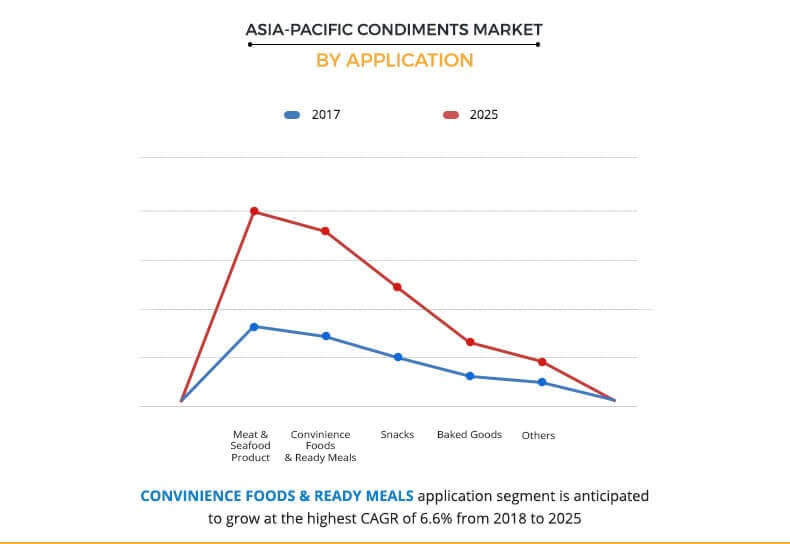
In 2017, Japan accounted for the highest market share in the Asia-Pacific condiments market and is projected to witness high revenue growth from 2018 to 2025, owing to growth in affluence and rise in fast food outlets as well as high consumption of meat in the region. In 2017, the total consumption of poultry meat in Japan was 2,044.05 kilotons compared to 2,020.20 kilotons in 2016. The meat consumption was dominant, which drives the sales of condiments in the market. India is also anticipated to be a lucrative market for condiments owing to highest growth rate in the Asia-Pacific condiments market. This growth is attributed to the rise in consumption of the convenience food and meat & seafood products in the country. People tend to adopt convenient food options, such as fast foods and ready to eat meals, owing to changes in lifestyle of people owing to busy lifestyle and rise in disposable income. This change in consumption pattern is expected to drive the growth of condiments in Asia-Pacific. Fast food, which is the majorly consumed by consumers contains condiments such as sauce.
Â
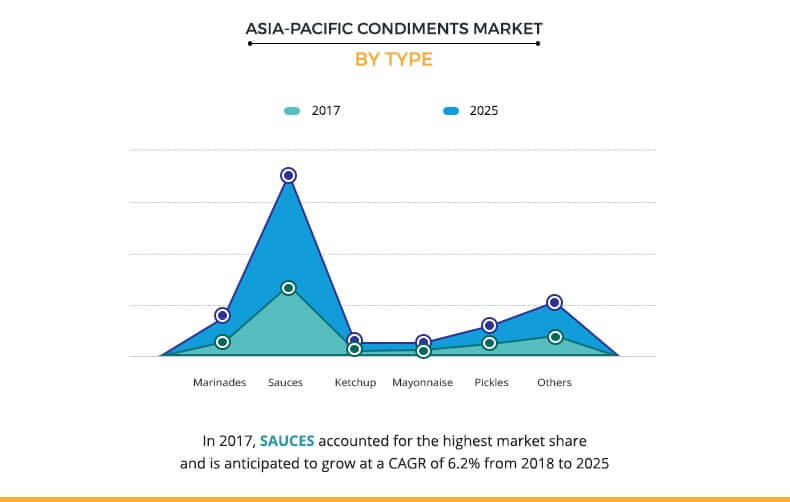
In 2017, the sauce segment accounted for the highest market share in the Asia-Pacific condiments market in terms of value as well as volume as it is the most common condiment consumed in the quick service restaurants and homes in most countries in this region. Sauce is one of the important components in many cuisines cooked across the world. Some of the most common dishes in which sauces are added include Noodles, Shushi, Dumplings, Onigiri, Ramen, and more. Sauce is also popularly used in pizzas, burgers, chicken wings, burritos, and more. A rise in the number of fast food outlets and quick service restaurants throughout the world has increased the demand for sauces, driving the sauces segment in Asia-Pacific condiment market.
Â
In 2017, meat & seafood was the prominent segment that accounted for the highest share in the Asia-Pacific condiments market. The meat & seafood segment is expected to grow at a 5.3% CAGR during the forecast period, owing to increase in demand for convenient food and meat products as well as rise in the number fast food outlets in the Asia-Pacific region. Popular Asian dishes such as Dumplings, Asian style (BBQ) Barbeque Chicken, Khao Suey, Chilly Chicken, Prawn Tempura, and Shushi requires condiments to enhance characteristics such as taste, color, and aroma; hence, driving the sales of condiments.
Key Benefits for Asia-Pacific Condiments Market :
This report provides a quantitative analysis of the current trends, estimations, and dynamics of the Asia-Pacific condiments market from 2018 to 2025 to identify the prevailing market opportunities.
Porters Five Forces analysis highlights the potency of buyers and suppliers to enable stakeholders to make profit-oriented business decisions and strengthen their supplierbuyer network.
In-depth analysis of the market segmentation assists in determining the prevailing market opportunities.
Major countries in Asia-Pacific are mapped according to their revenue contribution to the condiments industry.
Asia-Pacific Condiments Key Market Segments :
By Type
Marinade
Sauce
Ketchup
Mayonnaise
Pickle
Others
By Application
Meat & Seafood Product
Convenience Food & Ready Meal
Snack
Baked Goods
Others
By Form
Liquid
Paste
Dry
By Country
China
India
Australia
Japan
Indonesia
Thailand
Singapore
Malaysia
Vietnam
Rest of Asia-Pacific
Asia-Pacific Condiments Market Report Highlights
Aspects | Details |
---|---|
By Type |
|
By Application |
|
By Form |
|
By Country |
|
Key Market Players | Three Threes Condiments Pty Limited, McCormick & Company, Inc., Nestl, Yeo Hiap Seng Ltd, Hormel Foods Corporation, Kraft-Heinz, Inc, Unilever, Del Monte Foods, Inc., NutriAsia, Kikkoman Corporation |
CHAPTER 1: INTRODUCTION
1.1. Report description
1.2. Key market segments
1.3. Research methodology
1.3.1. Primary Research
1.3.2. Secondary research
1.3.3. Analyst tools and models
CHAPTER 2: EXECUTIVE SUMMARY
2.1. Key finding of the study
2.2. CXO perspective
CHAPTER 3: MARKET LANDSCAPE
3.1. Market definition and scope
3.2. Key findings
3.2.1. Top investment pockets
3.3. Porters five force analysis
3.3.1. Bargaining power of suppliers
3.3.2. Bargaining power of buyers
3.3.3. Threat of new entrants
3.3.4. Threat of substitutes
3.3.5. Intensity of competitive rivalry
3.4. Market dynamics
3.4.1. Drivers
3.4.1.1. Increase in cross-cultural interaction due to globalization
3.4.1.2. Rise in disposable income
3.4.1.3. Increase in fast-food outlets
3.4.1.4. Growth of retail network in emerging economies
3.4.2. Restraint
3.4.2.1. Fluctuations in the cost of raw materials
3.4.3. Opportunity
3.4.3.1. Product innovation and improvements in quality of product
CHAPTER 4: ASIA-PACIFIC CONDIMENTS MARKET, BY TYPE
4.1. Overview
4.1.1. Market size and forecast
4.1.2. Market volume and forecast
4.1.3. Marinades
4.1.3.1. Market analysis, by country
4.1.4. Sauces
4.1.4.1. Market analysis, by country
4.1.5. Ketchup
4.1.5.1. Market analysis, by country
4.1.6. Mayonnaise
4.1.6.1. Market analysis, by country
4.1.7. Pickle
4.1.7.1. Market analysis, by country
4.1.8. Others
4.1.8.1. Market analysis, by country
CHAPTER 5: ASIA-PACIFIC CONDIMENTS MARKET BY APPLICATION
5.1. Overview
5.1.1. Market size and forecast
5.1.2. Market volume and forecast
5.2. Meat & seafood products
5.2.1. Key market trends, growth factors and opportunities
5.2.2. Market value analysis, by country
5.2.3. Market volume analysis, by country
5.3. Convenience food & ready meals
5.3.1. Key market trends, growth factors and opportunities
5.3.2. Market value analysis, by country
5.3.3. Market volume analysis, by country
5.4. Snacks
5.4.1. Key market trends, growth factors and opportunities
5.4.2. Market value analysis, by country
5.4.3. Market volume analysis, by country
5.5. Baked goods
5.5.1. Key market trends, growth factors and opportunities
5.5.2. Market value analysis, by country
5.5.3. Market volume analysis, by country
5.6. Others
5.6.1. Key market trends, growth factors and opportunities
5.6.2. Market value analysis, by country
5.6.3. Market volume analysis, by country
CHAPTER 6: ASIA-PACIFIC CONDIMENTS MARKET BY FORM
6.1. Overview
6.1.1. Market value analysis
6.1.2. Market volume analysis
6.2. Liquid
6.2.1. Key market trends, growth factors and opportunities
6.2.2. Market analysis by country
6.3. Paste
6.3.1. Key market trends, growth factors and opportunities
6.3.2. Market analysis by country
6.4. Dry
6.4.1. Key market trends, growth factors and opportunities
6.4.2. Market analysis by country
CHAPTER 7: ASIA-PACIFIC CONDIMENTS MARKET BY COUNTRY
7.1. Overview
7.1.1. Market size and forecast
7.1.2. Market volume and forecast
7.2. China
7.2.1. Key market trends, growth factors and opportunities
7.2.2. Market size and forecast by type
7.2.3. Market volume and forecast by type
7.2.4. Market size and forecast by application
7.2.5. Market volume and forecast by application
7.2.6. Market size and forecast by form
7.2.7. Market volume and forecast by form
7.3. India
7.3.1. Key market trends, growth factors and opportunities
7.3.2. Market size and forecast by type
7.3.3. Market volume and forecast by type
7.3.4. Market size and forecast by application
7.3.5. Market volume and forecast by application
7.3.6. Market size and forecast by form
7.3.7. Market volume and forecast by form
7.4. Australia
7.4.1. Key market trends, growth factors and opportunities
7.4.2. Market size and forecast by type
7.4.3. Market volume and forecast by type
7.4.4. Market size and forecast by application
7.4.5. Market volume and forecast by application
7.4.6. Market size and forecast by form
7.4.7. Market volume and forecast by form
7.5. Japan
7.5.1. Key market trends, growth factors and opportunities
7.5.2. Market size and forecast by type
7.5.3. Market volume and forecast by type
7.5.4. Market size and forecast by application
7.5.5. Market volume and forecast by application
7.5.6. Market size and forecast by form
7.5.7. Market volume and forecast by form
7.6. Indonesia
7.6.1. Key market trends, growth factors and opportunities
7.6.2. Market size and forecast by type
7.6.3. Market volume and forecast by type
7.6.4. Market size and forecast by application
7.6.5. Market volume and forecast by application
7.6.6. Market size and forecast by form
7.6.7. Market volume and forecast by form
7.7. Thailand
7.7.1. Key market trends, growth factors and opportunities
7.7.2. Market size and forecast by type
7.7.3. Market volume and forecast by type
7.7.4. Market size and forecast by application
7.7.5. Market volume and forecast by application
7.7.6. Market size and forecast by form
7.7.7. Market volume and forecast by form
7.8. Singapore
7.8.1. Key market trends, growth factors and opportunities
7.8.2. Market size and forecast by type
7.8.3. Market volume and forecast by type
7.8.4. Market size and forecast by application
7.8.5. Market volume and forecast by application
7.8.6. Market size and forecast by form
7.8.7. Market volume and forecast by form
7.9. Malaysia
7.9.1. Key market trends, growth factors and opportunities
7.9.2. Market size and forecast by type
7.9.3. Market volume and forecast by type
7.9.4. Market size and forecast by application
7.9.5. Market volume and forecast by application
7.9.6. Market size and forecast by form
7.9.7. Market volume and forecast by form
7.10. Vietnam
7.10.1. Key market trends, growth factors and opportunities
7.10.2. Market size and forecast by type
7.10.3. Market volume and forecast by type
7.10.4. Market size and forecast by application
7.10.5. Market volume and forecast by application
7.10.6. Market size and forecast by form
7.10.7. Market volume and forecast by form
7.11. Rest of Asia-Pacific
7.11.1. Key market trends, growth factors and opportunities
7.11.2. Market size and forecast by type
7.11.3. Market volume and forecast by type
7.11.4. Market size and forecast by application
7.11.5. Market volume and forecast by application
7.11.6. Market size and forecast by form
7.11.7. Market volume and forecast by form
LIST OF TABLES
TABLE 01. ASIA-PACIFIC CONDIMENTS MARKET VALUE, 20172025 ($MILLION)
TABLE 02. ASIA-PACIFIC CONDIMENTS MARKET VOLUME, 20172025 (KILOTON)
TABLE 03. ASIA-PACIFIC MARINADES MARKET VALUE, BY TYPE, 20172025 ($MILLION)
TABLE 04. ASIA-PACIFIC MARINADES MARKET VOLUME, BY TYPE, 20172025 (KILOTON)
TABLE 05. ASIA-PACIFIC SAUCES MARKET VALUE, BY TYPE, 20172025 ($MILLION)
TABLE 06. ASIA-PACIFIC SAUCES MARKET VOLUME, BY TYPE, 20172025 (KILOTON)
TABLE 07. ASIA-PACIFIC KETCHUP MARKET VALUE, BY TYPE, 20172025 ($MILLION)
TABLE 08. ASIA-PACIFIC KETCHUP MARKET VOLUME, BY TYPE, 20172025 (KILOTON)
TABLE 09. ASIA-PACIFIC MAYONNAISE MARKET VALUE, BY TYPE, 20172025 ($MILLION)
TABLE 10. ASIA-PACIFIC MAYONNAISE MARKET VOLUME, BY TYPE, 20172025 (KILOTON)
TABLE 11. ASIA-PACIFIC PICKLES MARKET VALUE, BY TYPE, 20172025 ($MILLION)
TABLE 12. ASIA-PACIFIC PICKLES MARKET VOLUME, BY TYPE, 20172025 (KILOTON)
TABLE 13. ASIA-PACIFIC OTHER CONDIMENTS MARKET VALUE, BY TYPE, 20172025 ($MILLION)
TABLE 14. ASIA-PACIFIC OTHER CONDIMENTS MARKET VOLUME, BY TYPE, 20172025 (KILOTON)
TABLE 15. ASIA-PACIFIC CONDIMENTS MARKET VALUE, BY APPLICATION, 2017-2025, ($MILLION)
TABLE 16. ASIA-PACIFIC CONDIMENTS MARKET VOLUME, BY APPLICATION, 2017-2025, (KILOTON)
TABLE 17. ASIA-PACIFIC BEEF AND VEAL MEAT CONSUMPTION IN THOUSAND TONNES, 2015-2017
TABLE 18. ASIA-PACIFIC PORK MEAT CONSUMPTION IN THOUSAND TONNES, 2015-2017
TABLE 19. ASIA-PACIFIC POULTRY MEAT CONSUMPTION IN THOUSAND TONNES, 2015-2017
TABLE 20. ASIA-PACIFIC CONDIMENTS MARKET VALUE FOR MEAT & SEA FOOD PRODUCT, BY COUNTRY, 2017-2025, ($MILLION)
TABLE 21. ASIA-PACIFIC CONDIMENTS MARKET VOLUME FOR MEAT & SEA FOOD PRODUCT, BY COUNTRY, 2017-2025, (KILOTON)
TABLE 22. ASIA-PACIFIC CONDIMENTS MARKET VALUE FOR CONVENIENCE FOOD & READY MEALS, BY COUNTRY, 2017-2025, ($MILLION)
TABLE 23. ASIA-PACIFIC CONDIMENTS MARKET VOLUME FOR CONVENIENCE FOOD & READY MEALS, BY COUNTRY, 2017-2025, (KILOTON)
TABLE 24. ASIA-PACIFIC CONDIMENTS MARKET VALUE FOR SNACKS, BY COUNTRY, 2017-2025, ($MILLION)
TABLE 25. ASIA-PACIFIC CONDIMENTS MARKET VOLUME FOR SNACKS, BY COUNTRY, 2017-2025, (KILOTON)
TABLE 26. ASIA-PACIFIC CONDIMENTS MARKET VALUE FOR BACKED GOODS, BY COUNTRY, 2017-2025, ($MILLION)
TABLE 27. ASIA-PACIFIC CONDIMENTS MARKET VOLUME FOR BAKED GOODS, BY COUNTRY, 2017-2025, (KILOTON)
TABLE 28. ASIA-PACIFIC CONDIMENTS MARKET VALUE FOR OTHERS, BY COUNTRY, 2017-2025, ($MILLION)
TABLE 29. ASIA-PACIFIC CONDIMENTS MARKET VOLUME FOR OTHERS, BY COUNTRY, 2017-2025, (KILOTON)
TABLE 30. ASIA-PACIFIC CONDIMENTS MARKET VALUE, BY FORM, 2017-2025, ($MILLION)
TABLE 31. ASIA-PACIFIC CONDIMENTS MARKET VOLUME, BY FORM, 2017-2025, (KILOTON)
TABLE 32. ASIA-PACIFIC LIQUID CONDIMENTS MARKET VALUE, BY COUNTRY, 2017-2025, ($MILLION)
TABLE 33. ASIA-PACIFIC LIQUID CONDIMENTS MARKET VOLUME, BY COUNTRY, 2017-2025, (KILOTON)
TABLE 34. ASIA-PACIFIC PASTE CONDIMENTS MARKET VALUE, BY COUNTRY, 2017-2025, ($MILLION)
TABLE 35. ASIA-PACIFIC PASTE CONDIMENTS MARKET VOLUME, BY COUNTRY, 2017-2025, (KILOTON)
TABLE 36. ASIA-PACIFIC DRY CONDIMENTS MARKET VALUE, BY COUNTRY, 2017-2025, ($MILLION)
TABLE 37. ASIA-PACIFIC DRY CONDIMENTS MARKET VOLUME, BY COUNTRY, 2017-2025, (KILOTON)
TABLE 38. ASIA-PACIFIC CONDIMENTS MARKET VALUE, BY COUNTRY, 2017-2025 ($MILLION)
TABLE 39. ASIA-PACIFIC CONDIMENTS MARKET VOLUME, BY COUNTRY, 2017-2025 (KILOTON)
TABLE 40. CHINA CONDIMENTS MARKET VALUE, BY TYPE, 2017-2025 ($MILLION)
TABLE 41. CHINA CONDIMENTS MARKET VOLUME, BY TYPE, 2017-2025 (KILOTON)
TABLE 42. CHINA CONDIMENTS MARKET VALUE, BY APPLICATION, 2017-2025 ($MILLION)
TABLE 43. CHINA CONDIMENTS MARKET VOLUME, BY APPLICATION, 2017-2025 (KILOTON)
TABLE 44. CHINA CONDIMENTS MARKET VALUE, BY FORM, 2017-2025 ($MILLION)
TABLE 45. CHINA CONDIMENTS MARKET VOLUME, BY FORM, 2017-2025 (KILOTON)
TABLE 46. INDIA CONDIMENTS MARKET VALUE, BY TYPE, 2017-2025 ($MILLION)
TABLE 47. INDIA CONDIMENTS MARKET VOLUME, BY TYPE, 2017-2025 (KILOTON)
TABLE 48. INDIA CONDIMENTS MARKET VALUE, BY APPLICATION, 2017-2025 ($MILLION)
TABLE 49. INDIA CONDIMENTS MARKET VOLUME, BY APPLICATION, 2017-2025 (KILOTON)
TABLE 50. INDIA CONDIMENTS MARKET VALUE, BY FORM, 2017-2025 ($MILLION)
TABLE 51. INDIA CONDIMENTS MARKET VOLUME, BY FORM, 2017-2025 (KILOTON)
TABLE 52. AUSTRALIA CONDIMENTS MARKET VALUE, BY TYPE, 2017-2025 ($MILLION)
TABLE 53. AUSTRALIA CONDIMENTS MARKET VOLUME, BY TYPE, 2017-2025 (KILOTON)
TABLE 54. AUSTRALIA CONDIMENTS MARKET VALUE, BY APPLICATION, 2017-2025 ($MILLION)
TABLE 55. AUSTRALIA CONDIMENTS MARKET VOLUME, BY APPLICATION, 2017-2025 (KILOTON)
TABLE 56. AUSTRALIA CONDIMENTS MARKET VALUE, BY FORM, 2017-2025 ($MILLION)
TABLE 57. AUSTRALIA CONDIMENTS MARKET VOLUME, BY FORM, 2017-2025 (KILOTON)
TABLE 58. JAPAN CONDIMENTS MARKET VALUE, BY TYPE, 2017-2025 ($MILLION)
TABLE 59. JAPAN CONDIMENTS MARKET VOLUME, BY TYPE, 2017-2025 (KILOTON)
TABLE 60. JAPAN CONDIMENTS MARKET VALUE, BY APPLICATION, 2017-2025 ($MILLION)
TABLE 61. JAPAN CONDIMENTS MARKET VOLUME, BY APPLICATION, 2017-2025 (KILOTON)
TABLE 62. JAPAN CONDIMENTS MARKET VALUE, BY FORM, 2017-2025 ($MILLION)
TABLE 63. JAPAN CONDIMENTS MARKET VOLUME, BY FORM, 2017-2025 (KILOTON)
TABLE 64. INDONESIA CONDIMENTS MARKET VALUE, BY TYPE, 2017-2025 ($MILLION)
TABLE 65. INDONESIA CONDIMENTS MARKET VOLUME, BY TYPE, 2017-2025 (KILOTON)
TABLE 66. INDONESIA CONDIMENTS MARKET VALUE, BY APPLICATION, 2017-2025 ($MILLION)
TABLE 67. INDONESIA CONDIMENTS MARKET VOLUME, BY APPLICATION, 2017-2025 (KILOTON)
TABLE 68. INDONESIA CONDIMENTS MARKET VALUE, BY FORM, 2017-2025 ($MILLION)
TABLE 69. INDONESIA CONDIMENTS MARKET VOLUME, BY FORM, 2017-2025 (KILOTON)
TABLE 70. THAILAND CONDIMENTS MARKET VALUE, BY TYPE, 2017-2025 ($MILLION)
TABLE 71. THAILAND CONDIMENTS MARKET VOLUME, BY TYPE, 2017-2025 (KILOTON)
TABLE 72. THAILAND CONDIMENTS MARKET VALUE, BY APPLICATION, 2017-2025 ($MILLION)
TABLE 73. THAILAND CONDIMENTS MARKET VOLUME, BY APPLICATION, 2017-2025 (KILOTON)
TABLE 74. THAILAND CONDIMENTS MARKET VALUE, BY FORM, 2017-2025 ($MILLION)
TABLE 75. THAILAND CONDIMENTS MARKET VOLUME, BY FORM, 2017-2025 (KILOTON)
TABLE 76. SINGAPORE CONDIMENTS MARKET VALUE, BY TYPE, 2017-2025 ($MILLION)
TABLE 77. SINGAPORE CONDIMENTS MARKET VOLUME, BY TYPE, 2017-2025 (KILOTON)
TABLE 78. SINGAPORE CONDIMENTS MARKET VALUE, BY APPLICATION, 2017-2025 ($MILLION)
TABLE 79. SINGAPORE CONDIMENTS MARKET VOLUME, BY APPLICATION, 2017-2025 (KILOTON)
TABLE 80. SINGAPORE CONDIMENTS MARKET VALUE, BY FORM, 2017-2025 ($MILLION)
TABLE 81. SINGAPORE CONDIMENTS MARKET VOLUME, BY FORM, 2017-2025 (KILOTON)
TABLE 82. MALAYSIA CONDIMENTS MARKET VALUE, BY TYPE, 2017-2025 ($MILLION)
TABLE 83. MALAYSIA CONDIMENTS MARKET VOLUME, BY TYPE, 2017-2025 (KILOTON)
TABLE 84. MALAYSIA CONDIMENTS MARKET VALUE, BY APPLICATION, 2017-2025 ($MILLION)
TABLE 85. MALAYSIA CONDIMENTS MARKET VOLUME, BY APPLICATION, 2017-2025 (KILOTON)
TABLE 86. MALAYSIA CONDIMENTS MARKET VALUE, BY FORM, 2017-2025 ($MILLION)
TABLE 87. MALAYSIA CONDIMENTS MARKET VOLUME, BY FORM, 2017-2025 (KILOTON)
TABLE 88. VIETNAM CONDIMENTS MARKET VALUE, BY TYPE, 2017-2025 ($MILLION)
TABLE 89. VIETNAM CONDIMENTS MARKET VOLUME, BY TYPE, 2017-2025 (KILOTON)
TABLE 90. VIETNAM CONDIMENTS MARKET VALUE, BY APPLICATION, 2017-2025 ($MILLION)
TABLE 91. VIETNAM CONDIMENTS MARKET VOLUME, BY APPLICATION, 2017-2025 (KILOTON)
TABLE 92. VIETNAM CONDIMENTS MARKET VALUE, BY FORM, 2017-2025 ($MILLION)
TABLE 93. VIETNAM CONDIMENTS MARKET VOLUME, BY FORM, 2017-2025 (KILOTON)
TABLE 94. REST OF ASIA-PACIFIC CONDIMENTS MARKET VALUE, BY TYPE, 2017-2025 ($MILLION)
TABLE 95. REST OF ASIA-PACIFIC CONDIMENTS MARKET VOLUME, BY TYPE, 2017-2025 (KILOTON)
TABLE 96. REST OF ASIA-PACIFIC CONDIMENTS MARKET VALUE, BY APPLICATION, 2017-2025 ($MILLION)
TABLE 97. REST OF ASIA-PACIFIC CONDIMENTS MARKET VOLUME, BY APPLICATION, 2017-2025 (KILOTON)
TABLE 98. REST OF ASIA-PACIFIC CONDIMENTS MARKET VALUE, BY FORM, 2017-2025 ($MILLION)
TABLE 99. REST OF ASIA-PACIFIC CONDIMENTS MARKET VOLUME, BY FORM, 2017-2025 (KILOTON)
LIST OF FIGURES
FIGURE 01. KEY MARKET SEGMENTS
FIGURE 02. TOP INVESTMENT POCKET IN CONDIMENTS MARKET, BY COUNTRY, 2017
FIGURE 03. LOW BARGAINING POWER OF SUPPLIERS
FIGURE 04. MODERATE BARGAINING POWER OF BUYERS
FIGURE 05. LOW THREAT OF NEW ENTRANTS
FIGURE 06. MODERATE THREAT OF SUBSTITUTES
FIGURE 07. HIGH INTENSITY OF COMPETITIVE RIVALRY
FIGURE 08. ASIA-PACIFIC CONDIMENTS MARKET SHARE, BY APPLICATION, 2017-2025 (%)
FIGURE 09. ASIA-PACIFIC CONDIMENTS MARKET SHARE, BY FORM, 2017-2025 (%)
FIGURE 10. CHINA CONDIMENTS MARKET, 2018-2025 ($MILLION)
FIGURE 11. INDIA CONDIMENTS MARKET, 2018-2025 ($MILLION)
FIGURE 12. AUSTRALIA CONDIMENTS MARKET, 2018-2025 ($MILLION)
FIGURE 13. JAPAN CONDIMENTS MARKET, 2018-2025 ($MILLION)
FIGURE 14. INDONESIA CONDIMENTS MARKET, 2018-2025 ($MILLION)
FIGURE 15. THAILAND CONDIMENTS MARKET, 2018-2025 ($MILLION)
FIGURE 16. SINGAPORE CONDIMENTS MARKET, 2018-2025 ($MILLION)
FIGURE 17. MALAYSIA CONDIMENTS MARKET, 2018-2025 ($MILLION)
FIGURE 18. VIETNAM CONDIMENTS MARKET, 2018-2025 ($MILLION)
FIGURE 19. REST OF ASIA-PACIFIC CONDIMENTS MARKET, 2018-2025 ($MILLION)
Condiment is supplemental food used to impart certain flavor, color, and aroma to dishes. Some condiments such as ketchup, mayonnaise, and pickle are served with dishes, whereas some condiments such as pasta sauce, tomato paste, and bouillon are used as ingredients while cooking.
Sauces have been gaining popularity in the Asia-Pacific region as they are served with certain meals such as pizza, noodles, and meat & sea foods as taste enhancers. They are also an important component in many cuisines cooked across the world. Consumers with busy lifestyles look for quick and easy meal solutions that are wholesome. This factor of easy availability coupled with the increase in number of fast food outlets has increased the demand for fast food and ready to eat meals, which in turn supports the growth of the condiments market as condiments are an important part of these meals. Moreover, factors, such as increased income level paired with demand for a more diversified diet, have encouraged consumers to spend more on meat and seafood products. This boosts the sales of the condiments in the Asia-Pacific region. However, fluctuation in cost of raw materials is expected to hamper the growth of the Asia-Pacific condiments market during the forecast period.
Start reading instantly.
This Report and over 67,068+ more Reports, Available with Avenue Library. T&C*.
Enterprise
License/PDF
Library
Membership
*Taxes/Fees, if applicable will be added during checkout. All prices in USD
To ensure high-level data integrity, accurate analysis, and impeccable forecasts
For complete satisfaction
On-demand customization of scope of the report to exactly meet your needs
Targeted market view to provide pertinent information and save time of readers
Get insights on topics that are crucial for your business. Stay abreast of your interest areas.
Get Industry Data AlertsTo ensure high-level data integrity, accurate analysis, and impeccable forecasts
For complete satisfaction
On-demand customization of scope of the report to exactly meet your needs
Targeted market view to provide pertinent information and save time of readers