0
2022
Automotive Automatic Tire Inflation System (atis) Market

Automotive Automatic Tire Inflation System (ATIS) Market

by Product Type (Central Tire Inflation, Continuous Tire Inflation), by Application (Light Duty Vehicle, Heavy Duty Vehicles), by Sales Channel (OEM, Aftermarket): Global Opportunity Analysis and Industry Forecast, 2020-2030

Report Code: A12681
Apr 2022 | Pages: 211
Tables: 131
Charts: 63
  • Formats*:

  • pdf

    Single User License, Five User
    License & Enterprise User License

  • xls

    Data Pack Excel License

  • ppt

    It comes with the additional cost
    of $2500.00 contact sales.


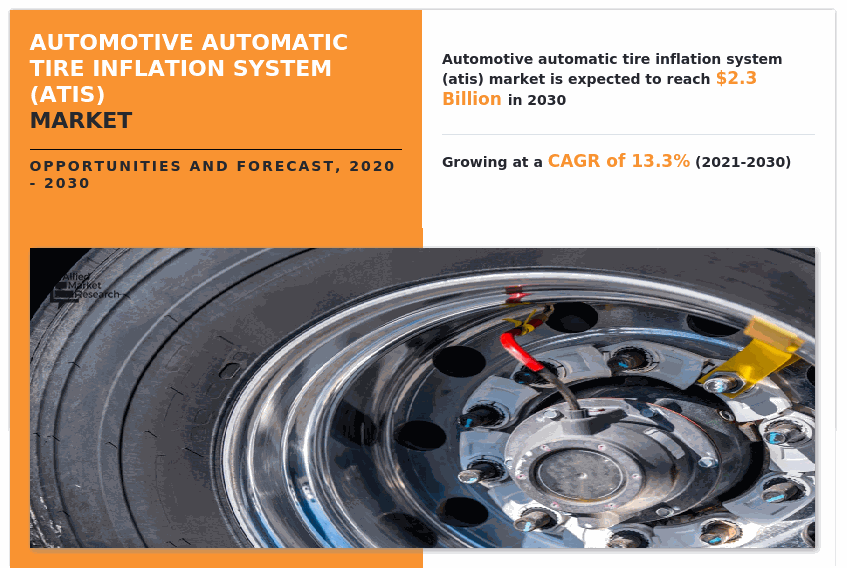
The global automotive automatic tire inflation system (atis) market was valued at $658.10 million in 2020, and is projected to reach $2,262.9 miliion by 2030, growing at a CAGR of 13.3% from 2021 to 2030.

Automatic tire inflation system is a specially designed safety system, which is used to monitor tire air pressure and inflate the tire in case of low air pressure and simultaneously release excess air pressure from the vehicle tire while the vehicle is in motion. The system uses vehicle’s compressed air tanks or draws air from the surrounding using a self-contained pump to inflate or deflate the tire of the vehicle. It is essential for optimum vehicle performance on road. Automatic tire inflation system consists of a series of components such as numerous sensors and related electronics that increase safety and improve efficiency through optimized tire pressure. Moreover, with the advancement in technology followed by the introduction of advanced vehicles equipped with numerous safety features, the demand for automatic tire inflation system has increased, which eventually boosts the automotive ATIS market.
The COVID-19 crisis creates uncertainty in every market, including the automotive sector. The closure of assembly plants and large-scale manufacturing interruptions has led to the decline in global demand for automobiles, indirectly affecting the automotive automatic tire inflation system (ATIS) market. Governments across different regions announced total lockdown and the temporary shutdown of industries, leading to the border closures that restricted the movement of transportation services. The COVID-19 health crisis forced the automotive industry to look for alternate sources and prioritize import substitution with their production activities & supply chain. However, the overall service activities of market players have registered a steady and favorable recovery in the subsequent months with the normalization of trade regulations and vehicle production, which is expected to boost the automatic tire inflation system market in post-2020. As per the current scenario, the overall world is getting back on track slowly; with the new restriction and policies. Thus, the resumption of operations by various automakers in several parts of the world is expected to boost the growth of the automatic tire inflation system market from 2021 onwards. This will positively impact the market during the forecast period.

Automotive Automatic Tire Inflation System Market, Automotive ATIS Market

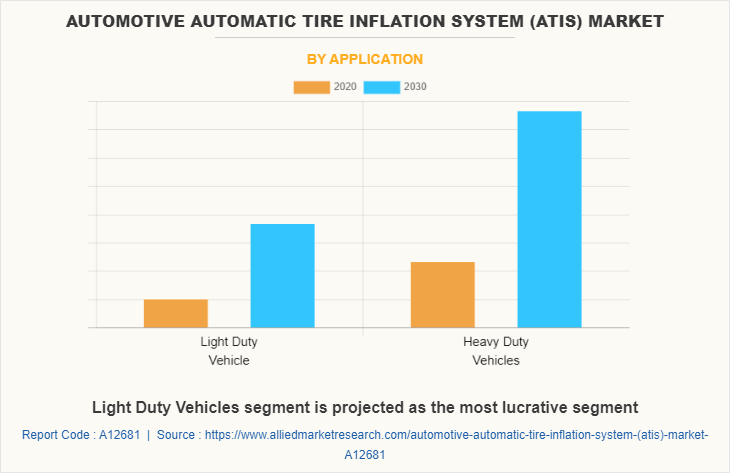
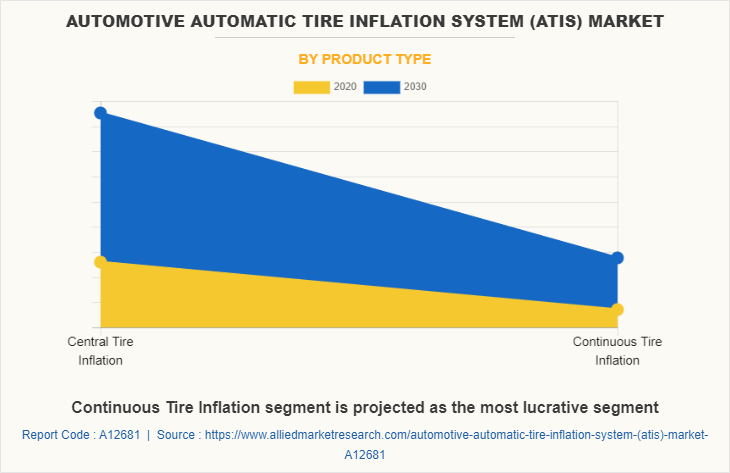
The growth of the global automotive automatic tire inflation system market is driven by factors such as increase in demand for all-terrain & military vehicles, surge in demand for incorporation of safety features in vehicles, and rise in demand for comfort while driving. However, high implementation cost & configuration complexity and nitrogen tires substituting compressed air tires hamper the growth of the market across the globe. On the contrary, technological advancements related to vehicles and integration of automatic tire inflation system with telematics are anticipated to offer remunerative opportunities for the growth of the global automotive automatic tire inflation system market. The global automotive automatic tire inflation system market is segmented into product type, application, sales channel, and region. Depending on product type, the market is categorized into central tire inflation and continuous tire inflation.

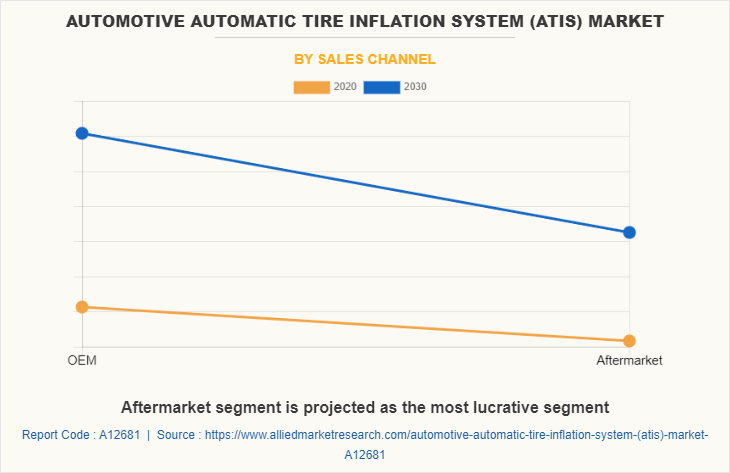
On the basis of application, it is bifurcated into light-duty vehicles and heavy-duty vehicles. By sales channel, it is fragmented into original equipment manufacturers (OEMs) and aftermarket. Region wise, the market is analyzed across North America, Europe, Asia-Pacific and LAMEA.

The key players profiled in the automotive automatic tire inflation system market report include Aperia Technology Inc., Bigfoot Equipment LTD, Dana Limited, FTL/IDEX (subsidiary of IDEX Corporation), Hendrickson USA, LLC, Meritor, Inc., Parker Hannifin Corp, SAF-HOLLAND SE, the Goodyear Tire & Rubber Company, and ti.systems GmbH.
Automotive Automatic Tire Inflation System (ATIS) Market

Increase in demand for all-terrain and military vehicles

Utility all-terrain vehicles are versatile and find their application across a multiple sectors, including military, agricultural, construction, and forestry. As the military, agriculture, construction activities are increasing significantly, the demand for these vehicles is expected to escalate significantly, thus creating a positive impact on the growth of the automotive automatic tire inflation system market. Moreover, the need for advanced system such as telematics, tubeless tires, and self-inflator tires increased considerably, owing to surge in demand for off-highway vehicles across different countries, which is anticipated to open new avenues for the growth of the market across the globe.

In addition, key players operating in the industry have developed and introduced their automatic tire inflator system to be used in vehicles, which acts as a key growth driver of the automotive ATIS market. For instance, in October 2019, Aperia Technology Inc. upgraded its industry-first tire analytics platform Halo Connect, which offers new features such as precise vehicle location and service insights along with tracking tire tread depth and tire replacement time period to further simplify fleet tire maintenance decisions.

Furthermore, surge in demand for all-terrain vehicles in agriculture and military & defense applications across Asia-Pacific and North America is expected to foster the market growth, thus enabling key players to develop and introduce automatic tire inflator system to be used in different vehicles. 
Automotive Automatic Tire Inflation System (ATIS) Market

Incorporation of safety features in vehicles

Safety features such as engine performance analysis, tire pressure monitoring system, electronic stability control, airbags, and telematics-based features are in high demand due to increase in number of road accidents worldwide. Vehicles installed with safety features offered by advanced driver assistance system (ADAS) can detect and classify certain objects on the road and alert driver according to the road conditions as well as the condition of the vehicle. In addition, these systems ensure the safety and security of the vehicle as well as passengers on-board by creating an advanced alert related to the vehicle condition. Moreover, prominent players operating in the industry have developed advanced vehicle safety features, which include numerous subcomponents such as sensors and microcontrollers, which are intended to provide real-time information of the vehicle, thus ensuring safety of the vehicle. Moreover, increased government norms for inclusion of numerous safety features in vehicles creates a wider scope, thus supplementing the growth of the market across the globe.

High implementation cost & configuration complexity

Continuous technological advancements have necessitated the upgradation of system & software of automobiles required to keep them compatible with external environment. The cost of all components such as sensor, radio frequency, and fuzzy logics along with the assembly required in smart vehicles is significantly high. Numerous components & sensors are assembled in a single dielectric plate according to the compatibility, which incur high cost. In addition, this bulky system takes higher implementation cost, as it needs to be connected with wireless devices installed in vehicles for its proper operation. Therefore, high configuration complexity coupled with higher initial implantation cost limits the installation of automatic tire inflator system in vehicles, thus restraining the growth of the automotive ATIS market.
Automotive Automatic Tire Inflation System (ATIS) Market

Integration of automatic tire inflation system with telematics

Telematics include advanced tracking devices and sensors installed in vehicles which send, receive, and store telemetry data of vehicular operations. It works on own onboard diagnostics systems (ODBI). ODBI decreases vehicle’s fuel consumption, improves safety, and reduces the possibility of cost manipulation by vehicle drivers due to the presence of on-board telematics system in vehicles. Owing to such benefits offered by telematics, automotive automatic tire inflation system is gaining high traction in the market, as it improves the performance of vehicle as well as ensures safety of the vehicle, thereby creating a positive impact on the growth of the market.

Moreover, the integration of ATIS with telematics makes air tire inflation system more reliable and advanced, as the system can perform automatically. Moreover, increase in concern over road safety and stringent regulations imposed by governments globally pertaining to the integration of automatic tire inflation systems in new vehicles is projected to open new avenues for the expansion of the automotive automatic tire inflation system market in the near future.
Automotive Automatic Tire Inflation System (ATIS) Market

Key Benefits For Stakeholders

  • This study presents the analytical depiction of the global automotive automatic tire inflation system (ATIS) market analysis along with the current trends and future estimations to depict imminent investment pockets.
  • The overall market opportunity is determined by understanding profitable trends to gain a stronger foothold.
  • The report presents detailed impact analysis information related to the key drivers, restraints, and market opportunities.
  • The current market is quantitatively analyzed from 2021 to 2030 to benchmark financial competency.
  • Porter’s five forces analysis illustrates the potency of the buyers and suppliers in the industry.

Automotive Automatic Tire Inflation System (ATIS) Market Report Highlights

Aspects Details
By Application
  • Light Duty Vehicle
  • Heavy Duty Vehicles
By Sales Channel
  • OEM
  • Aftermarket
By Product Type
  • Central Tire Inflation
  • Continuous Tire Inflation
By Region
  • North America  (U.S, Canada, Mexico)
  • Europe  (Germany, France, Italy, U.K., Rest of Europe)
  • Asia-Pacific  (China, India, Japan, South Korea, Rest of Asia-Pacific)
  • LAMEA  (Latin America, Middle East, Africa)
Key Market Players Hendrickson USA, FTL IDEX, Aperia Technology Inc, Parker Hannifin Corporation, SAF HOLLAND SE, Dana Limited, ti systems GmbH, Meritor Inc, Goodyear Tire & Rubber Co., Bigfoot Equipment LTD
 
  • CHAPTER 1:INTRODUCTION

    • 1.1.Report description

    • 1.2.Key market segments

    • 1.3.Key benefits to the stakeholders

    • 1.4.Research Methodology

      • 1.4.1.Secondary research

      • 1.4.2.Primary research

      • 1.4.3.Analyst tools and models

  • CHAPTER 2:EXECUTIVE SUMMARY

    • 2.1.Key findings of the study

    • 2.2.CXO Perspective

  • CHAPTER 3:MARKET OVERVIEW

    • 3.1.Market definition and scope

    • 3.2.Key findings

      • 3.2.1.Top investment pockets

    • 3.3.Porter’s five forces analysis

    • 3.4.Top player positioning

    • 3.5.Market dynamics

      • 3.5.1.Drivers

      • 3.5.2.Restraints

      • 3.5.3.Opportunities

    • 3.6.COVID-19 Impact Analysis on the market

  • CHAPTER 4: AUTOMOTIVE AUTOMATIC TIRE INFLATION SYSTEM (ATIS) MARKET, BY PRODUCT TYPE

    • 4.1 Overview

      • 4.1.1 Market size and forecast

    • 4.2 Central Tire Inflation

      • 4.2.1 Key market trends, growth factors and opportunities

      • 4.2.2 Market size and forecast, by region

      • 4.2.3 Market analysis by country

    • 4.3 Continuous Tire Inflation

      • 4.3.1 Key market trends, growth factors and opportunities

      • 4.3.2 Market size and forecast, by region

      • 4.3.3 Market analysis by country

  • CHAPTER 5: AUTOMOTIVE AUTOMATIC TIRE INFLATION SYSTEM (ATIS) MARKET, BY APPLICATION

    • 5.1 Overview

      • 5.1.1 Market size and forecast

    • 5.2 Light Duty Vehicle

      • 5.2.1 Key market trends, growth factors and opportunities

      • 5.2.2 Market size and forecast, by region

      • 5.2.3 Market analysis by country

    • 5.3 Heavy Duty Vehicles

      • 5.3.1 Key market trends, growth factors and opportunities

      • 5.3.2 Market size and forecast, by region

      • 5.3.3 Market analysis by country

  • CHAPTER 6: AUTOMOTIVE AUTOMATIC TIRE INFLATION SYSTEM (ATIS) MARKET, BY SALES CHANNEL

    • 6.1 Overview

      • 6.1.1 Market size and forecast

    • 6.2 OEM

      • 6.2.1 Key market trends, growth factors and opportunities

      • 6.2.2 Market size and forecast, by region

      • 6.2.3 Market analysis by country

    • 6.3 Aftermarket

      • 6.3.1 Key market trends, growth factors and opportunities

      • 6.3.2 Market size and forecast, by region

      • 6.3.3 Market analysis by country

  • CHAPTER 7: AUTOMOTIVE AUTOMATIC TIRE INFLATION SYSTEM (ATIS) MARKET, BY REGION

    • 7.1 Overview

      • 7.1.1 Market size and forecast

    • 7.2 North America

      • 7.2.1 Key trends and opportunities

      • 7.2.2 North America Market size and forecast, by Product Type

      • 7.2.3 North America Market size and forecast, by Application

      • 7.2.4 North America Market size and forecast, by Sales Channel

      • 7.2.5 North America Market size and forecast, by country

        • 7.2.5.1 U.S
          • 7.2.5.1.1 Market size and forecast, by Product Type
          • 7.2.5.1.2 Market size and forecast, by Application
          • 7.2.5.1.3 Market size and forecast, by Sales Channel
        • 7.2.5.2 Canada
          • 7.2.5.2.1 Market size and forecast, by Product Type
          • 7.2.5.2.2 Market size and forecast, by Application
          • 7.2.5.2.3 Market size and forecast, by Sales Channel
        • 7.2.5.3 Mexico
          • 7.2.5.3.1 Market size and forecast, by Product Type
          • 7.2.5.3.2 Market size and forecast, by Application
          • 7.2.5.3.3 Market size and forecast, by Sales Channel
    • 7.3 Europe

      • 7.3.1 Key trends and opportunities

      • 7.3.2 Europe Market size and forecast, by Product Type

      • 7.3.3 Europe Market size and forecast, by Application

      • 7.3.4 Europe Market size and forecast, by Sales Channel

      • 7.3.5 Europe Market size and forecast, by country

        • 7.3.5.1 Germany
          • 7.3.5.1.1 Market size and forecast, by Product Type
          • 7.3.5.1.2 Market size and forecast, by Application
          • 7.3.5.1.3 Market size and forecast, by Sales Channel
        • 7.3.5.2 France
          • 7.3.5.2.1 Market size and forecast, by Product Type
          • 7.3.5.2.2 Market size and forecast, by Application
          • 7.3.5.2.3 Market size and forecast, by Sales Channel
        • 7.3.5.3 Italy
          • 7.3.5.3.1 Market size and forecast, by Product Type
          • 7.3.5.3.2 Market size and forecast, by Application
          • 7.3.5.3.3 Market size and forecast, by Sales Channel
        • 7.3.5.4 U.K.
          • 7.3.5.4.1 Market size and forecast, by Product Type
          • 7.3.5.4.2 Market size and forecast, by Application
          • 7.3.5.4.3 Market size and forecast, by Sales Channel
        • 7.3.5.5 Rest of Europe
          • 7.3.5.5.1 Market size and forecast, by Product Type
          • 7.3.5.5.2 Market size and forecast, by Application
          • 7.3.5.5.3 Market size and forecast, by Sales Channel
    • 7.4 Asia-Pacific

      • 7.4.1 Key trends and opportunities

      • 7.4.2 Asia-Pacific Market size and forecast, by Product Type

      • 7.4.3 Asia-Pacific Market size and forecast, by Application

      • 7.4.4 Asia-Pacific Market size and forecast, by Sales Channel

      • 7.4.5 Asia-Pacific Market size and forecast, by country

        • 7.4.5.1 China
          • 7.4.5.1.1 Market size and forecast, by Product Type
          • 7.4.5.1.2 Market size and forecast, by Application
          • 7.4.5.1.3 Market size and forecast, by Sales Channel
        • 7.4.5.2 India
          • 7.4.5.2.1 Market size and forecast, by Product Type
          • 7.4.5.2.2 Market size and forecast, by Application
          • 7.4.5.2.3 Market size and forecast, by Sales Channel
        • 7.4.5.3 Japan
          • 7.4.5.3.1 Market size and forecast, by Product Type
          • 7.4.5.3.2 Market size and forecast, by Application
          • 7.4.5.3.3 Market size and forecast, by Sales Channel
        • 7.4.5.4 South Korea
          • 7.4.5.4.1 Market size and forecast, by Product Type
          • 7.4.5.4.2 Market size and forecast, by Application
          • 7.4.5.4.3 Market size and forecast, by Sales Channel
        • 7.4.5.5 Rest of Asia-Pacific
          • 7.4.5.5.1 Market size and forecast, by Product Type
          • 7.4.5.5.2 Market size and forecast, by Application
          • 7.4.5.5.3 Market size and forecast, by Sales Channel
    • 7.5 LAMEA

      • 7.5.1 Key trends and opportunities

      • 7.5.2 LAMEA Market size and forecast, by Product Type

      • 7.5.3 LAMEA Market size and forecast, by Application

      • 7.5.4 LAMEA Market size and forecast, by Sales Channel

      • 7.5.5 LAMEA Market size and forecast, by country

        • 7.5.5.1 Latin America
          • 7.5.5.1.1 Market size and forecast, by Product Type
          • 7.5.5.1.2 Market size and forecast, by Application
          • 7.5.5.1.3 Market size and forecast, by Sales Channel
        • 7.5.5.2 Middle East
          • 7.5.5.2.1 Market size and forecast, by Product Type
          • 7.5.5.2.2 Market size and forecast, by Application
          • 7.5.5.2.3 Market size and forecast, by Sales Channel
        • 7.5.5.3 Africa
          • 7.5.5.3.1 Market size and forecast, by Product Type
          • 7.5.5.3.2 Market size and forecast, by Application
          • 7.5.5.3.3 Market size and forecast, by Sales Channel
  • CHAPTER 8: COMPANY LANDSCAPE

    • 8.1. Introduction

    • 8.2. Top winning strategies

    • 8.3. Product Mapping of Top 10 Player

    • 8.4. Competitive Dashboard

    • 8.5. Competitive Heatmap

    • 8.6. Key developments

  • CHAPTER 9: COMPANY PROFILES

    • 9.1 Aperia Technology Inc

      • 9.1.1 Company overview

      • 9.1.2 Company snapshot

      • 9.1.3 Operating business segments

      • 9.1.4 Product portfolio

      • 9.1.5 Business performance

      • 9.1.6 Key strategic moves and developments

    • 9.2 Bigfoot Equipment LTD

      • 9.2.1 Company overview

      • 9.2.2 Company snapshot

      • 9.2.3 Operating business segments

      • 9.2.4 Product portfolio

      • 9.2.5 Business performance

      • 9.2.6 Key strategic moves and developments

    • 9.3 Dana Limited

      • 9.3.1 Company overview

      • 9.3.2 Company snapshot

      • 9.3.3 Operating business segments

      • 9.3.4 Product portfolio

      • 9.3.5 Business performance

      • 9.3.6 Key strategic moves and developments

    • 9.4 FTL IDEX

      • 9.4.1 Company overview

      • 9.4.2 Company snapshot

      • 9.4.3 Operating business segments

      • 9.4.4 Product portfolio

      • 9.4.5 Business performance

      • 9.4.6 Key strategic moves and developments

    • 9.5 Hendrickson USA

      • 9.5.1 Company overview

      • 9.5.2 Company snapshot

      • 9.5.3 Operating business segments

      • 9.5.4 Product portfolio

      • 9.5.5 Business performance

      • 9.5.6 Key strategic moves and developments

    • 9.6 Meritor Inc

      • 9.6.1 Company overview

      • 9.6.2 Company snapshot

      • 9.6.3 Operating business segments

      • 9.6.4 Product portfolio

      • 9.6.5 Business performance

      • 9.6.6 Key strategic moves and developments

    • 9.7 Parker Hannifin Corporation

      • 9.7.1 Company overview

      • 9.7.2 Company snapshot

      • 9.7.3 Operating business segments

      • 9.7.4 Product portfolio

      • 9.7.5 Business performance

      • 9.7.6 Key strategic moves and developments

    • 9.8 SAF HOLLAND SE

      • 9.8.1 Company overview

      • 9.8.2 Company snapshot

      • 9.8.3 Operating business segments

      • 9.8.4 Product portfolio

      • 9.8.5 Business performance

      • 9.8.6 Key strategic moves and developments

    • 9.9 Goodyear Tire & Rubber Co.

      • 9.9.1 Company overview

      • 9.9.2 Company snapshot

      • 9.9.3 Operating business segments

      • 9.9.4 Product portfolio

      • 9.9.5 Business performance

      • 9.9.6 Key strategic moves and developments

    • 9.10 ti systems GmbH

      • 9.10.1 Company overview

      • 9.10.2 Company snapshot

      • 9.10.3 Operating business segments

      • 9.10.4 Product portfolio

      • 9.10.5 Business performance

      • 9.10.6 Key strategic moves and developments

  • LIST OF TABLES

  • TABLE 01. GLOBAL AUTOMOTIVE AUTOMATIC TIRE INFLATION SYSTEM MARKET, BY PRODUCT TYPE, 2020-2030 ($MILLION)
    TABLE 02. AUTOMOTIVE AUTOMATIC TIRE INFLATION SYSTEM MARKET REVENUE FOR CENTRAL TIRE INFLATION, BY REGION, 2020–2030 ($MILLION)
    TABLE 03. AUTOMOTIVE AUTOMATIC TIRE INFLATION SYSTEM MARKET REVENUE FOR CONTINUOUS TIRE INFLATION, BY REGION, 2020–2030 ($MILLION)
    TABLE 04. GLOBAL AUTOMOTIVE AUTOMATIC TIRE INFLATION SYSTEM MARKET, BY APPLICATION, 2020-2030 ($MILLION)
    TABLE 05. AUTOMOTIVE AUTOMATIC TIRE INFLATION SYSTEM MARKET REVENUE FOR LIGHT-DUTY VEHICLES, BY REGION, 2020–2030 ($MILLION)
    TABLE 06. AUTOMOTIVE AUTOMATIC TIRE INFLATION SYSTEM MARKET REVENUE FOR HEAVY-DUTY VEHICLES, BY REGION, 2020–2030 ($MILLION)
    TABLE 07. GLOBAL AUTOMOTIVE AUTOMATIC TIRE INFLATION SYSTEM MARKET, BY SALES CHANNEL, 2020-2030 ($MILLION)
    TABLE 08. AUTOMOTIVE AUTOMATIC TIRE INFLATION SYSTEM MARKET REVENUE FOR OEM, BY REGION, 2020-2030 ($MILLION)
    TABLE 09. AUTOMOTIVE AUTOMATIC TIRE INFLATION SYSTEM MARKET REVENUE FOR AFTERMARKET, BY REGION, 2020–2030 ($MILLION)
    TABLE 10. NORTH AMERICA AUTOMOTIVE AUTOMATIC TIRE INFLATION SYSTEM MARKET, BY PRODUCT TYPE, 2020–2030 ($MILLION)
    TABLE 11. NORTH AMERICA AUTOMOTIVE AUTOMATIC TIRE INFLATION SYSTEM MARKET, BY APPLICATION, 2020-2030 ($MILLION)
    TABLE 12. NORTH AMERICA AUTOMOTIVE AUTOMATIC TIRE INFLATION SYSTEM MARKET, BY SALES CHANNEL, 2020–2030 ($MILLION)
    TABLE 13. U.S. AUTOMOTIVE AUTOMATIC TIRE INFLATION SYSTEM MARKET, BY PRODUCT TYPE, 2020–2030 ($MILLION)
    TABLE 14. U.S. AUTOMOTIVE AUTOMATIC TIRE INFLATION SYSTEM MARKET, BY APPLICATION, 2020–2030 ($MILLION)
    TABLE 15. U.S. AUTOMOTIVE AUTOMATIC TIRE INFLATION SYSTEM MARKET, BY SALES CHANNEL, 2020–2030 ($MILLION)
    TABLE 16. CANADA AUTOMOTIVE AUTOMATIC TIRE INFLATION SYSTEM MARKET, BY PRODUCT TYPE, 2020–2030 ($MILLION)
    TABLE 17. CANADA AUTOMOTIVE AUTOMATIC TIRE INFLATION SYSTEM MARKET, BY APPLICATION, 2020–2030 ($MILLION)
    TABLE 18. CANADA AUTOMOTIVE AUTOMATIC TIRE INFLATION SYSTEM MARKET, BY SALES CHANNEL, 2020–2030 ($MILLION)
    TABLE 19. MEXICO AUTOMOTIVE AUTOMATIC TIRE INFLATION SYSTEM MARKET, BY PRODUCT TYPE, 2020–2030 ($MILLION)
    TABLE 20. MEXICO AUTOMOTIVE AUTOMATIC TIRE INFLATION SYSTEM MARKET, BY APPLICATION, 2020–2030 ($MILLION)
    TABLE 21. MEXICO AUTOMOTIVE AUTOMATIC TIRE INFLATION SYSTEM MARKET, BY SALES CHANNEL, 2020–2030 ($MILLION)
    TABLE 22. EUROPE AUTOMOTIVE AUTOMATIC TIRE INFLATION SYSTEM MARKET, BY PRODUCT TYPE, 2020–2030 ($MILLION)
    TABLE 23. EUROPE AUTOMOTIVE AUTOMATIC TIRE INFLATION SYSTEM MARKET, BY APPLICATION, 2020–2030 ($MILLION)
    TABLE 24. EUROPE AUTOMOTIVE AUTOMATIC TIRE INFLATION SYSTEM MARKET, BY SALES CHANNEL, 2020–2030 ($MILLION)
    TABLE 25. GERMANY AUTOMOTIVE AUTOMATIC TIRE INFLATION SYSTEM MARKET, BY PRODUCT TYPE, 2020–2030 ($MILLION)
    TABLE 26. GERMANY AUTOMOTIVE AUTOMATIC TIRE INFLATION SYSTEM MARKET, BY APPLICATION, 2020–2030 ($MILLION)
    TABLE 27. GERMANY AUTOMOTIVE AUTOMATIC TIRE INFLATION SYSTEM MARKET, BY SALES CHANNEL, 2020–2030 ($MILLION)
    TABLE 28. FRANCE AUTOMOTIVE AUTOMATIC TIRE INFLATION SYSTEM MARKET, BY PRODUCT TYPE, 2020–2030 ($MILLION)
    TABLE 29. FRANCE AUTOMOTIVE AUTOMATIC TIRE INFLATION SYSTEM MARKET, BY APPLICATION, 2020–2030 ($MILLION)
    TABLE 30. FRANCE AUTOMOTIVE AUTOMATIC TIRE INFLATION SYSTEM MARKET, BY SALES CHANNEL, 2020–2030 ($MILLION)
    TABLE 31. UK AUTOMOTIVE AUTOMATIC TIRE INFLATION SYSTEM MARKET, BY PRODUCT TYPE, 2020–2030 ($MILLION)
    TABLE 32. UK AUTOMOTIVE AUTOMATIC TIRE INFLATION SYSTEM MARKET, BY APPLICATION, 2020–2030 ($MILLION)
    TABLE 33. UK AUTOMOTIVE AUTOMATIC TIRE INFLATION SYSTEM MARKET, BY SALES CHANNEL, 2020–2030 ($MILLION)
    TABLE 34. ITALY AUTOMOTIVE AUTOMATIC TIRE INFLATION SYSTEM MARKET, BY PRODUCT TYPE, 2020–2030 ($MILLION)
    TABLE 35. ITALY AUTOMOTIVE AUTOMATIC TIRE INFLATION SYSTEM MARKET, BY APPLICATION, 2020–2030 ($MILLION)
    TABLE 36. ITALY AUTOMOTIVE AUTOMATIC TIRE INFLATION SYSTEM MARKET, BY SALES CHANNEL, 2020–2030 ($MILLION)
    TABLE 37. REST OF EUROPE AUTOMOTIVE AUTOMATIC TIRE INFLATION SYSTEM MARKET, BY PRODUCT TYPE, 2020–2030 ($MILLION)
    TABLE 38. REST OF EUROPE AUTOMOTIVE AUTOMATIC TIRE INFLATION SYSTEM MARKET, BY APPLICATION, 2020–2030 ($MILLION)
    TABLE 39. REST OF EUROPE AUTOMOTIVE AUTOMATIC TIRE INFLATION SYSTEM MARKET, BY SALES CHANNEL, 2020–2030 ($MILLION)
    TABLE 40. ASIA-PACIFIC AUTOMOTIVE AUTOMATIC TIRE INFLATION SYSTEM MARKET, BY PRODUCT TYPE, 2020–2030 ($MILLION)
    TABLE 41. ASIA-PACIFIC AUTOMOTIVE AUTOMATIC TIRE INFLATION SYSTEM MARKET, BY APPLICATION, 2020–2030 ($MILLION)
    TABLE 42. ASIA-PACIFIC AUTOMOTIVE AUTOMATIC TIRE INFLATION SYSTEM MARKET, BY SALES CHANNEL, 2020–2030 ($MILLION)
    TABLE 43. CHINA AUTOMOTIVE AUTOMATIC TIRE INFLATION SYSTEM MARKET, BY PRODUCT TYPE, 2020–2030 ($MILLION)
    TABLE 44. CHINA AUTOMOTIVE AUTOMATIC TIRE INFLATION SYSTEM MARKET, BY APPLICATION, 2020–2030 ($MILLION)
    TABLE 45. CHINA AUTOMOTIVE AUTOMATIC TIRE INFLATION SYSTEM MARKET, BY SALES CHANNEL, 2020–2030 ($MILLION)
    TABLE 46. INDIA AUTOMOTIVE AUTOMATIC TIRE INFLATION SYSTEM MARKET, BY PRODUCT TYPE, 2020–2030 ($MILLION)
    TABLE 47. INDIA AUTOMOTIVE AUTOMATIC TIRE INFLATION SYSTEM MARKET, BY APPLICATION, 2020–2030 ($MILLION)
    TABLE 48. INDIA AUTOMOTIVE AUTOMATIC TIRE INFLATION SYSTEM MARKET, BY SALES CHANNEL, 2020–2030 ($MILLION)
    TABLE 49. JAPAN AUTOMOTIVE AUTOMATIC TIRE INFLATION SYSTEM MARKET, BY PRODUCT TYPE, 2020–2030 ($MILLION)
    TABLE 50. JAPAN AUTOMOTIVE AUTOMATIC TIRE INFLATION SYSTEM MARKET, BY APPLICATION, 2020–2030 ($MILLION)
    TABLE 51. JAPAN AUTOMOTIVE AUTOMATIC TIRE INFLATION SYSTEM MARKET, BY SALES CHANNEL, 2020–2030 ($MILLION)
    TABLE 52. SOUTH KOREA AUTOMOTIVE AUTOMATIC TIRE INFLATION SYSTEM MARKET, BY PRODUCT TYPE, 2020–2030 ($MILLION)
    TABLE 53. SOUTH KOREA AUTOMOTIVE AUTOMATIC TIRE INFLATION SYSTEM MARKET, BY APPLICATION, 2020–2030 ($MILLION)
    TABLE 54. SOUTH KOREA AUTOMOTIVE AUTOMATIC TIRE INFLATION SYSTEM MARKET, BY SALES CHANNEL, 2020–2030 ($MILLION)
    TABLE 55. REST OF ASIA-PACIFIC AUTOMOTIVE AUTOMATIC TIRE INFLATION SYSTEM MARKET, BY PRODUCT TYPE, 2020–2030 ($MILLION)
    TABLE 56. REST OF ASIA-PACIFIC AUTOMOTIVE AUTOMATIC TIRE INFLATION SYSTEM MARKET, BY APPLICATION, 2020–2030 ($MILLION)
    TABLE 57. REST OF ASIA-PACIFIC AUTOMOTIVE AUTOMATIC TIRE INFLATION SYSTEM MARKET, BY SALES CHANNEL, 2020–2030 ($MILLION)
    TABLE 58. LAMEA AUTOMOTIVE AUTOMATIC TIRE INFLATION SYSTEM MARKET, BY PRODUCT TYPE, 2020–2030 ($MILLION)
    TABLE 59. LAMEA AUTOMOTIVE AUTOMATIC TIRE INFLATION SYSTEM MARKET, BY APPLICATION, 2020–2030 ($MILLION)
    TABLE 60. LAMEA AUTOMOTIVE AUTOMATIC TIRE INFLATION SYSTEM MARKET, BY SALES CHANNEL, 2020–2030 ($MILLION)
    TABLE 61. LATIN AMERICA AUTOMOTIVE AUTOMATIC TIRE INFLATION SYSTEM MARKET, BY PRODUCT TYPE, 2020–2030 ($MILLION)
    TABLE 62. LATIN AMERICA AUTOMOTIVE AUTOMATIC TIRE INFLATION SYSTEM MARKET, BY APPLICATION, 2020–2030 ($MILLION)
    TABLE 63. LATIN AMERICA AUTOMOTIVE AUTOMATIC TIRE INFLATION SYSTEM MARKET, BY SALES CHANNEL, 2020–2030 ($MILLION)
    TABLE 64. MIDDLE EAST AUTOMOTIVE AUTOMATIC TIRE INFLATION SYSTEM MARKET, BY PRODUCT TYPE, 2020–2030 ($MILLION)
    TABLE 65. MIDDLE EAST AUTOMOTIVE AUTOMATIC TIRE INFLATION SYSTEM MARKET, BY APPLICATION, 2020–2030 ($MILLION)
    TABLE 66. MIDDLE EAST AUTOMOTIVE AUTOMATIC TIRE INFLATION SYSTEM MARKET, BY SALES CHANNEL, 2020–2030 ($MILLION)
    TABLE 67. AFRICA AUTOMOTIVE AUTOMATIC TIRE INFLATION SYSTEM MARKET, BY PRODUCT TYPE, 2020–2030 ($MILLION)
    TABLE 68. AFRICA AUTOMOTIVE AUTOMATIC TIRE INFLATION SYSTEM MARKET, BY APPLICATION, 2020–2030 ($MILLION)
    TABLE 69. AFRICA AUTOMOTIVE AUTOMATIC TIRE INFLATION SYSTEM MARKET, BY SALES CHANNEL, 2020–2030 ($MILLION)
    TABLE 70. APERIA TECHNOLOGY INC.: COMPANY SNAPSHOT
    TABLE 71. APERIA TECHNOLOGY INC.: PRODUCT PORTFOLIO
    TABLE 72. APERIA TECHNOLOGY INC.: KEY STRATEGIC MOVES AND DEVELOPMENTS
    TABLE 73. BIGFOOT EQUIPMENT LTD.: COMPANY SNAPSHOT
    TABLE 74. BIGFOOT EQUIPMENT LTD: PRODUCT PORTFOLIO
    TABLE 75. BIGFOOT EQUIPMENT LTD: KEY STRATEGIC MOVES AND DEVELOPMENTS
    TABLE 76. DANA LIMITED: KEY EXECUTIVES
    TABLE 77. DANA LIMITED: COMPANY SNAPSHOT
    TABLE 78. DANA LIMITED: OPERATING SEGMENTS
    TABLE 79. DANA LIMITED: PRODUCT PORTFOLIO
    TABLE 80. DANA LIMITED: R&D EXPENDITURE, 2019–2021 ($MILLION)
    TABLE 81. DANA LIMITED: NET SALES, 2019–2021 ($MILLION)
    TABLE 82. DANA LIMITED: KEY STRATEGIC MOVES AND DEVELOPMENTS
    TABLE 83. FTL/IDEX: KEY EXECUTIVES
    TABLE 84. FTL/IDEX: COMPANY SNAPSHOT
    TABLE 85. FTL/IDEX: OPERATING SEGMENTS
    TABLE 86. FTL/IDEX: PRODUCT PORTFOLIO
    TABLE 87. FTL/IDEX: R&D EXPENDITURE, 2019–2021 ($MILLION)
    TABLE 88. FTL/IDEX: NET SALES, 2019–2021 ($MILLION)
    TABLE 89. HENDRICKSON USA, LLC: COMPANY SNAPSHOT
    TABLE 90. HENDRICKSON USA, LLC: PRODUCT PORTFOLIO
    TABLE 91. HENDRICKSON USA, LLC: KEY STRATEGIC MOVES AND DEVELOPMENTS
    TABLE 92. MERITOR, INC.: KEY EXECUTIVES
    TABLE 93. MERITOR, INC.: COMPANY SNAPSHOT
    TABLE 94. MERITOR, INC.: OPERATING SEGMENTS
    TABLE 95. MERITOR, INC.: PRODUCT PORTFOLIO
    TABLE 96. MERITOR, INC.: R&D EXPENDITURE, 2019–2021 ($MILLION)
    TABLE 97. MERITOR, INC.: NET SALES, 2019–2021 ($MILLION)
    TABLE 98. MERITOR, INC.: KEY STRATEGIC MOVES AND DEVELOPMENTS
    TABLE 99. PARKER HANNIFIN CORP.: KEY EXECUTIVES
    TABLE 100. PARKER HANNIFIN CORP.: COMPANY SNAPSHOT
    TABLE 101. PARKER HANNIFIN CORP.: OPERATING SEGMENTS
    TABLE 102. PARKER HANNIFIN CORP.: PRODUCT PORTFOLIO
    TABLE 103. PARKER HANNIFIN CORP.: R&D EXPENDITURE, 2019–2021 ($MILLION)
    TABLE 104. PARKER HANNIFIN CORP.: NET SALES, 2019–2021 ($MILLION)
    TABLE 105. PARKER HANNIFIN CORP.: KEY STRATEGIC MOVES AND DEVELOPMENTS
    TABLE 106. SAF-HOLLAND SE: KEY EXECUTIVES
    TABLE 107. SAF-HOLLAND SE: COMPANY SNAPSHOT
    TABLE 108. SAF-HOLLAND SE: OPERATING SEGMENTS
    TABLE 109. SAF-HOLLAND SE: PRODUCT PORTFOLIO
    TABLE 110. SAF-HOLLAND SE: R&D EXPENDITURE, 2019–2021 ($MILLION)
    TABLE 111. SAF-HOLLAND SE: NET SALES, 2019–2021 ($MILLION)
    TABLE 112. SAF-HOLLAND SE: KEY STRATEGIC MOVES AND DEVELOPMENTS
    TABLE 113. THE GOODYEAR TIRE & RUBBER COMPANY: KEY EXECUTIVES
    TABLE 114. THE GOODYEAR TIRE & RUBBER COMPANY: COMPANY SNAPSHOT
    TABLE 115. THE GOODYEAR TIRE & RUBBER COMPANY: OPERATING SEGMENTS
    TABLE 116. THE GOODYEAR TIRE & RUBBER COMPANY: PRODUCT PORTFOLIO
    TABLE 117. THE GOODYEAR TIRE & RUBBER COMPANY: R&D EXPENDITURE, 2019–2021 ($MILLION)
    TABLE 118. THE GOODYEAR TIRE & RUBBER COMPANY: NET SALES, 2019–2021 ($MILLION)
    TABLE 119. THE GOODYEAR TIRE & RUBBER COMPANY: KEY STRATEGIC MOVES AND DEVELOPMENTS
    TABLE 120. TI.SYSTEMS GMBH: COMPANY SNAPSHOT
    TABLE 121. TI.SYSTEMS GMBH: PRODUCT PORTFOLIO
  • LIST OF FIGURES

  • FIGURE 01. KEY MARKET SEGMENTS
    FIGURE 02. AUTOMOTIVE AUTOMATIC TIRE INFLATION SYSTEM MARKET SNAPSHOT, BY SEGMENTATION, 2020–2030
    FIGURE 03. AUTOMOTIVE AUTOMATIC TIRE INFLATION SYSTEM MARKET SNAPSHOT, BY REGION, 2020–2030
    FIGURE 04. TOP IMPACTING FACTORS
    FIGURE 05. TOP INVESTMENT POCKETS
    FIGURE 06. TOP WINNING STRATEGIES, BY YEAR, 2018-2022*
    FIGURE 07. TOP WINNING STRATEGIES, BY DEVELOPMENT, 2018-2022*
    FIGURE 08. TOP WINNING STRATEGIES, BY COMPANY, 2018-2022*
    FIGURE 09. KEY PLAYER POSITIONING, 2021
    FIGURE 10. GLOBAL AUTOMOTIVE AUTOMATIC TIRE INFLATION SYSTEM MARKET, BY PRODUCT TYPE, 2020-2030
    FIGURE 11. COMPARATIVE SHARE ANALYSIS OF AUTOMOTIVE AUTOMATIC TIRE INFLATION SYSTEM MARKET FOR CENTRAL TIRE INFLATION, BY COUNTRY, 2020 & 2030 ($MILLION)
    FIGURE 12. COMPARATIVE SHARE ANALYSIS OF AUTOMOTIVE AUTOMATIC TIRE INFLATION SYSTEM MARKET FOR CONTINUOUS TIRE INFLATION, BY COUNTRY, 2020 & 2030 ($MILLION)
    FIGURE 13. GLOBAL AUTOMOTIVE AUTOMATIC TIRE INFLATION SYSTEM MARKET, BY APPLICATION, 2020-2030
    FIGURE 14. COMPARATIVE SHARE ANALYSIS OF AUTOMOTIVE AUTOMATIC TIRE INFLATION SYSTEM MARKET FOR LIGHT-DUTY VEHICLES, BY COUNTRY, 2020 & 2030 ($MILLION)
    FIGURE 15. COMPARATIVE SHARE ANALYSIS OF AUTOMOTIVE AUTOMATIC TIRE INFLATION SYSTEM MARKET FOR HEAVY-DUTY VEHICLES, BY COUNTRY, 2020 & 2030 ($MILLION)
    FIGURE 16. GLOBAL AUTOMOTIVE AUTOMATIC TIRE INFLATION SYSTEM MARKET, BY SALES CHANNEL, 2020-2030
    FIGURE 17. COMPARATIVE SHARE ANALYSIS OF AUTOMOTIVE AUTOMATIC TIRE INFLATION SYSTEM MARKET FOR OEM, BY COUNTRY, 2020 & 2030 ($MILLION)
    FIGURE 18. COMPARATIVE SHARE ANALYSIS OF AUTOMOTIVE AUTOMATIC TIRE INFLATION SYSTEM MARKET FOR AFTERMARKET, BY COUNTRY, 2020 & 2030 ($MILLION)
    FIGURE 19. AUTOMOTIVE AUTOMATIC TIRE INFLATION SYSTEM MARKET, BY REGION, 2020-2030 (%)
    FIGURE 20. COMPARATIVE SHARE ANALYSIS OF AUTOMOTIVE AUTOMATIC TIRE INFLATION SYSTEM MARKET, BY COUNTRY, 2020–2030 (%)
    FIGURE 21. U.S. AUTOMOTIVE AUTOMATIC TIRE INFLATION SYSTEM MARKET, 2020–2030 ($MILLION)
    FIGURE 22. CANADA AUTOMOTIVE AUTOMATIC TIRE INFLATION SYSTEM MARKET, 2020–2030 ($MILLION)
    FIGURE 23. MEXICO AUTOMOTIVE AUTOMATIC TIRE INFLATION SYSTEM MARKET, 2020–2030 ($MILLION)
    FIGURE 24. COMPARATIVE SHARE ANALYSIS OF AUTOMOTIVE AUTOMATIC TIRE INFLATION SYSTEM MARKET, BY COUNTRY, 2020–2030 (%)
    FIGURE 25. GERMANY AUTOMOTIVE AUTOMATIC TIRE INFLATION SYSTEM MARKET, 2020–2030 ($MILLION)
    FIGURE 26. FRANCE AUTOMOTIVE AUTOMATIC TIRE INFLATION SYSTEM MARKET, 2020–2030 ($MILLION)
    FIGURE 27. UK AUTOMOTIVE AUTOMATIC TIRE INFLATION SYSTEM MARKET, 2020–2030 ($MILLION)
    FIGURE 28. ITALY AUTOMOTIVE AUTOMATIC TIRE INFLATION SYSTEM MARKET, 2020–2030 ($MILLION)
    FIGURE 29. REST OF EUROPE AUTOMOTIVE AUTOMATIC TIRE INFLATION SYSTEM MARKET, 2020–2030 ($MILLION)
    FIGURE 30. COMPARATIVE SHARE ANALYSIS OF AUTOMOTIVE AUTOMATIC TIRE INFLATION SYSTEM MARKET, BY COUNTRY, 2020–2030 (%)
    FIGURE 31. CHINA AUTOMOTIVE AUTOMATIC TIRE INFLATION SYSTEM MARKET, 2020–2030 ($MILLION)
    FIGURE 32. INDIA AUTOMOTIVE AUTOMATIC TIRE INFLATION SYSTEM MARKET, 2020–2030 ($MILLION)
    FIGURE 33. JAPAN AUTOMOTIVE AUTOMATIC TIRE INFLATION SYSTEM MARKET, 2020–2030 ($MILLION)
    FIGURE 34. SOUTH KOREA AUTOMOTIVE AUTOMATIC TIRE INFLATION SYSTEM MARKET, 2020–2030 ($MILLION)
    FIGURE 35. REST OF ASIA-PACIFIC AUTOMOTIVE AUTOMATIC TIRE INFLATION SYSTEM MARKET, 2020–2030 ($MILLION)
    FIGURE 36. COMPARATIVE SHARE ANALYSIS OF AUTOMOTIVE AUTOMATIC TIRE INFLATION SYSTEM MARKET, BY COUNTRY, 2020–2030 (%)
    FIGURE 37. LATIN AMERICA AUTOMOTIVE AUTOMATIC TIRE INFLATION SYSTEM MARKET, 2020–2030 ($MILLION)
    FIGURE 38. MIDDLE EAST AUTOMOTIVE AUTOMATIC TIRE INFLATION SYSTEM MARKET, 2020–2030 ($MILLION)
    FIGURE 39. AFRICA AUTOMOTIVE AUTOMATIC TIRE INFLATION SYSTEM MARKET, 2020–2030 ($MILLION)
    FIGURE 40. DANA LIMITED: R&D EXPENDITURE, 2019–2021 ($MILLION)
    FIGURE 41. DANA LIMITED: NET SALES, 2019–2021 ($MILLION)
    FIGURE 42. DANA LIMITED: REVENUE SHARE BY SEGMENT, 2021 (%)
    FIGURE 43. DANA LIMITED: REVENUE SHARE BY REGION, 2021 (%)
    FIGURE 44. FTL/IDEX: R&D EXPENDITURE, 2019–2021 ($MILLION)
    FIGURE 45. FTL/IDEX: NET SALES, 2019–2021 ($MILLION)
    FIGURE 46. FTL/IDEX: REVENUE SHARE BY SEGMENT, 2021 (%)
    FIGURE 47. FTL/IDEX: REVENUE SHARE BY REGION, 2021 (%)
    FIGURE 48. MERITOR, INC.: R&D EXPENDITURE, 2019–2021 ($MILLION)
    FIGURE 49. MERITOR, INC.: NET SALES, 2019–2021 ($MILLION)
    FIGURE 50. MERITOR, INC.: REVENUE SHARE BY SEGMENT, 2021 (%)
    FIGURE 51. MERITOR, INC.: REVENUE SHARE BY REGION, 2021 (%)
    FIGURE 52. PARKER HANNIFIN CORP.: R&D EXPENDITURE, 2019–2021 ($MILLION)
    FIGURE 53. PARKER HANNIFIN CORP.: NET SALES, 2019–2021 ($MILLION)
    FIGURE 54. PARKER HANNIFIN CORP.: REVENUE SHARE BY SEGMENT, 2021 (%)
    FIGURE 55. PARKER HANNIFIN CORP.: REVENUE SHARE BY REGION, 2021 (%)
    FIGURE 56. SAF-HOLLAND SE: R&D EXPENDITURE, 2019–2021 ($MILLION)
    FIGURE 57. SAF-HOLLAND SE: NET SALES, 2019–2021 ($MILLION)
    FIGURE 58. SAF-HOLLAND SE: REVENUE SHARE BY SEGMENT, 2021 (%)
    FIGURE 59. SAF-HOLLAND SE: REVENUE SHARE BY REGION, 2021 (%)
    FIGURE 60. THE GOODYEAR TIRE & RUBBER COMPANY: R&D EXPENDITURE, 2019–2021 ($MILLION)
    FIGURE 61. THE GOODYEAR TIRE & RUBBER COMPANY: NET SALES, 2019–2021 ($MILLION)
    FIGURE 62. THE GOODYEAR TIRE & RUBBER COMPANY: REVENUE SHARE BY SEGMENT, 2021 (%)
    FIGURE 63. THE GOODYEAR TIRE & RUBBER COMPANY: REVENUE SHARE BY REGION, 2021 (%)


In accordance with the insights of the CXOs of leading companies, North America is expected to dominate the global automotive automatic tire inflation system market in terms of revenue, owing to presence of robust automobile industry. In addition, it is a hub for many automotive manufacturers. Moreover, high demand for commercial & off-road vehicles in North America due to the prominent mining industry and expanding construction industry boosts the demand for automatic tire inflation systems. The current business scenario of the automotive automatic tire inflation system market has witnessed significant growth, owing to technological advancements in the automotive sector, surge in adoption of electric vehicles, and rise in demand for remote diagnostics systems. In addition, research & development in the tire industry to improve the frictional resistance property of tires to increase vehicle efficiency by about 1–1.4% boosted the adoption of automatic tire inflation system, especially in the developed countries such as the U.S., Germany, and the UK.

According to insights gathered from primary sources, increase in adoption of technologies in vehicles to improve fuel efficiency & passenger comfort and the government regulations & safety measures for tire inflation on vehicles have fueled the demand among aftermarket players. Moreover, companies operating across the globe are adopting numerous innovative technologies and investing in R&D projects. For instance, in September 2021, Hendrickson USA, LLC developed its existing tire pressure system with TIREMAAX PRO-LB, which helps eliminate the guesswork of tire pressure management by monitoring the pressure in air springs and reacting to changing loads automatically. Thus, adopting an improved automatic tire inflation system enhances the efficiency of tires, increases fuel efficiency, and reduces tire wear by providing sufficient air in each wheel.

Factors such as increase in demand for all-terrain & military vehicles, surge in demand for incorporation of safety features in vehicles, and rise in demand for comfort while driving. However, high implementation cost & configuration complexity and nitrogen tires substituting compressed air tires hamper the growth of the market across the globe. On the contrary, technological advancements related to vehicles and integration of automatic tire inflation system with telematics are anticipated to offer remunerative opportunities for the growth of the global automotive automatic tire inflation system market.

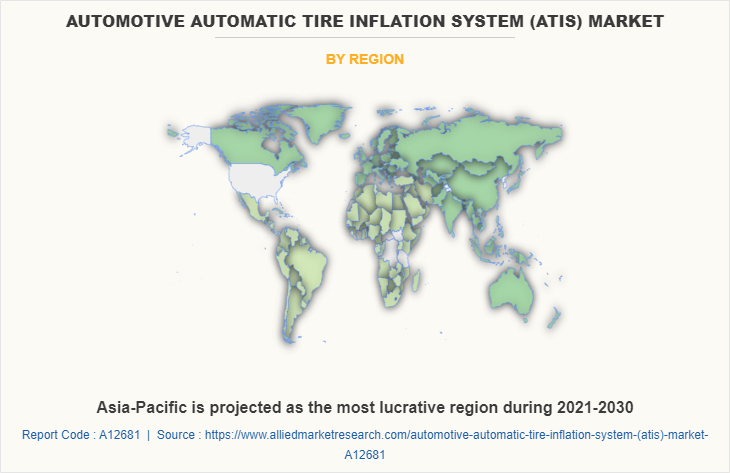
Among the analyzed regions, North America is the highest revenue contributor, followed by Europe, Asia-Pacific and LAMEA. On the basis of forecast analysis, Asia-Pacific is expected to maintain its lead during the forecast period, owing to increased demand for advanced features in vehicles across the Asian countries.

PURCHASE OPTIONS

Call or Email us

U.S.-Canada Toll-free: +1-800-792-5285
Int'l : +1-503-894-6022
Europe : +44-845-528-1300
Email : help@alliedmarketresearch.com
 
FREQUENTLY ASKED QUESTIONS?

A. The global automotive automatic tire inflation system (ATIS) market was valued at $658.1 million in 2020, and is projected to reach $2,262.9 million by 2030.

A. North America is the largest region in Automotive Automatic Tire Inflation System (ATIS) Market

A. Nitrogen tires substituting compressed air tires, Integration of automatic tire inflation system with telematics are major trends in Automatic Tire Inflation System (ATIS) Market

A. The market is segmented into product type, sales channel, application, and region.

A. The key players profiled in the automotive automatic tire inflation system market report include Aperia Technology Inc., Bigfoot Equipment LTD, Dana Limited, FTL/IDEX (subsidiary of IDEX Corporation), Hendrickson USA, LLC, Meritor, Inc., Parker Hannifin Corp, SAF-HOLLAND SE, the Goodyear Tire & Rubber Company, and ti.systems GmbH.

A. The company profiles of the top players of the market can be obtained from the company profile section mentioned in the report. This section includes analysis of top player’s operating in the industry along with their last three-year revenue, segmental revenue, product offerings, key strategies adopted, and geographical revenue generated

Looking for Customization?

 Customization Request

Have a Question?

 Speak with Analyst

Any Confusion?

 Inquire Before Buying

Have a glance of the Report

  Request Sample
RELATED TAGS

Purchase Full Report of
Automotive Automatic Tire Inflation System (atis) Market

Start reading instantly.
This Report and over 66,944+ more Reports, Available with Avenue Library. T&C*.

  • Online Only
  • $3,456
  • Online cloud access only
  • Restricted print, copy, paste & download
  • Read only
  • Free industry update
    (Within 180 days)
  • Free report update in next update cycle
    (Apr 2023 - Apr 2024)
  • Data Pack
  • $3,840
  • Restricted to one authorized user
  • One print only
  • Available in
    Excel
  • Free industry update
    (Within 180 days)
  •   Free report update in next update cycle
    (Apr 2023 - Apr 2024)
  • Single User
  • $5,769
  • Restricted to one authorized user
  • One print only
  • Available in
    PDF
  • Free industry update
    (Within 180 days)
  •   Free report update in next update cycle
    (Apr 2023 - Apr 2024)
  • Five Users
  • $6,450
  • Limited to five authorized users
  • Print upto five copies
  • Available in
    PDF
  • Free industry update
    (Within 180 days)
  •   Free report update in next update cycle
    (Apr 2023 - Apr 2024)
  • Enterprise
    License/PDF

  • $10,995
  • Unlimited
    within
    company/enterprise
  • Available in Excel & PDF
  • Free industry update
    (Within 180 days)
  •   Free report update in next update cycle
    (Apr 2023 - Apr 2024)
  • Library
    Membership

  • $999 $ 1,175
    Per User/ Per month/ Billed annually
  • Published Content
    E-access
  • Company Profiles
    E-access
  • Newly Added Content Access
  • 10 PDF
    Downloads
  • 5 Excel Data
    Pack Downloads
  • 250 Company Profiles PDF Downloads
  • Buy Now

*Taxes/Fees, if applicable will be added during checkout. All prices in USD

RELATED REPORTS
 

Why Allied Market Research?


Infallible Methodology

To ensure high-level data integrity, accurate analysis, and impeccable forecasts

Analyst Support

For complete satisfaction

Customization

On-demand customization of scope of the report to exactly meet your needs

TARGETED MARKET VIEW

Targeted market view to provide pertinent information and save time of readers

Get fresh content delivered

Get insights on topics that are crucial for your business. Stay abreast of your interest areas.

Get Industry Data Alerts

Why Allied Market Research?

Infallible Methodology

To ensure high-level data integrity, accurate analysis, and impeccable forecasts

Analyst Support

For complete satisfaction

Customization

On-demand customization of scope of the report to exactly meet your needs

TARGETED MARKET VIEW

Targeted market view to provide pertinent information and save time of readers