0
2019
Automotive Pedestrian Protection System Market

Automotive Pedestrian Protection System Market

by Type (External Airbags and Pop-Up Bonnets), Component Type (Sensors, Actuators, Control Units, and Others), Vehicle Type (SUV, Hatchback, and Sedan), and Distribution Channel (OEM and Aftermarket): Global Opportunity Analysis and Industry Forecast, 2018 - 2025

Report Code: A04883
Apr 2019 | Pages: 317
Tables: 121
Charts: 75
  • Formats*:

  • pdf

    Single User License, Five User
    License & Enterprise User License

  • xls

    Data Pack Excel License

  • ppt

    It comes with the additional cost
    of $2500.00 contact sales.


COVID-19

Pandemic disrupted the entire world and affected many industries.

Get detailed COVID-19 impact analysis on the Automotive Pedestrian Protection System Market

Request Now !

Automotive Pedestrian Protection System Market Outlook - 2025

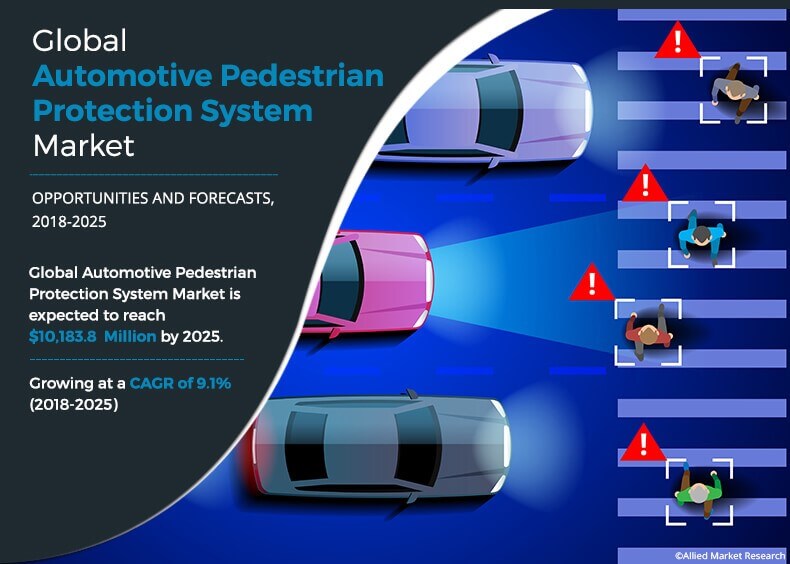
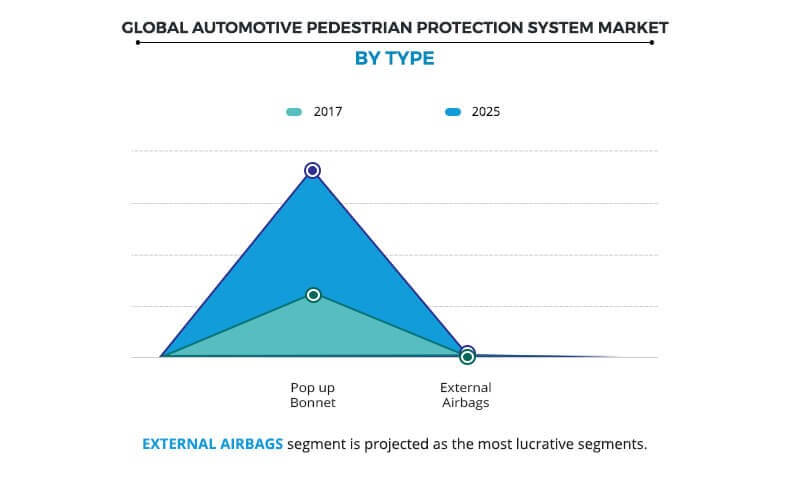
The global automotive pedestrian protection system market was valued at $5,133.2 million in 2017, and is projected to reach $10,183.8 million by 2025, registering a CAGR of 9.1% from 2018 to 2025. The pop-up bonnet segment was the highest contributor to the market, with $ 5,084.5 million in 2017, and is estimated to reach $ 10,040.1 million by 2025, at a CAGR of 9.0% during the forecast period. In 2017, Europe accounted for the highest share in the global automotive pedestrian protection system market.

A pedestrian protection system is used to protect the pedestrians in the event of a sudden collision so that it leads to less harm. This system has sensors that are designed for detecting collisions with pedestrians and an airbag control unit that can trigger the actuators for lifting the engine hood. When the system is activated, the rear section of the bonnet gets raised and the driver receives an automatic alarm. Systems such as popup hood & speed airbags and flexible air tubes are used for pedestrian safety during the time of sudden accidents. The various systems majorly concentrate on protecting the pedestrians heads and limbs. Moreover, as per the core definition, the automotive pedestrian protection system industry is only depending on the sales and latest innovation is done in active hoods and external airbags to save the pedestrian from the collision.

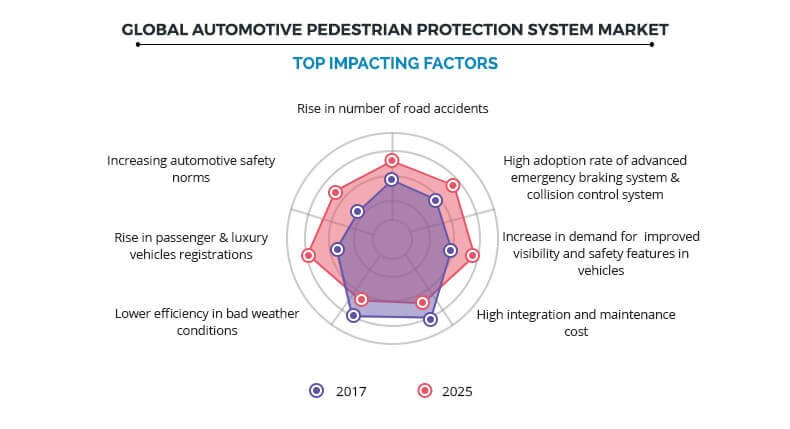
The automotive pedestrian protection system market is segmented on the basis of considering type, component type, distribution channel, and vehicle type. The latest automotive pedestrian protection system market trends boost the market growth. The pedestrian protection system trends is decided on the basis of the market forecast from 2018 to 2025. One of the major factors that driving the automotive pedestrian protection system market share is increase in number of accidents, and advanced collision avoidance based system with major advanced safety & security features.

Global Automotive Pedestrian Protection System Market

The global automotive pedestrian protection system market is driven by rise in number of road accidents, high adoption rate of advanced emergency braking system & collision control system, and increase in demand for improved visibility and safety features in vehicles. Furthermore, the shifting consumer preference to enhance driving experience and rise in demand for premium cars fuel the growth of the automotive pedestrian protection system market. In addition, technological steps taken by giant companies for the development of safety features further boost the growth of the global market. The market forecasted from year 2018-2025 by considering all the driving factors that influence equally to the automotive pedestrian protection system market report.

High installation cost and lower efficiency in bad weather conditions are some of the major factors that restrain the growth of the automotive pedestrian protection system market. Moreover, onetime use of external airbags adds up to cost, which is further expected to impend the market growth.

Furthermore, rise in consumer demand for safety & comfort and increase in global demand for premium & luxury vehicles registration provide growth opportunities for the automotive pedestrian protection system market globally. This can be attributed to rise in the sale of automated vehicles globally, which further offers lucrative opportunities for the automotive pedestrian protection systems market globally. The automotive pedestrian protection system market size includes the macroeconomic concerns such as the government support for the safety norms, rising interest rates among people and increase in sales and others.

Global Automotive Pedestrian Protection System Market By Type

The key players operating in the global automotive pedestrian protection system market include Autoliv, Robert Bosch GmbH, Magneti Marelli SpA, Denso Corporation, ZF Friedrichshafen AG, Mobileye N.V., Nissan Motor Corporation, Audi AG, Continental AG, and Valeo.

Global Automotive Pedestrian Protection System Market Top Impacting Factors

Rise in number of road accidents

According to the fact sheet of World Health Organization (WHO), road traffic injury is the leading cause of death among people aged between 15 and 29 years, and 1.25 million people die every year because of road accident. In addition, 90% of the world's fatalities on the roads occur in low & middle economical countries, though such countries have approximately 54% of the world's vehicles. Moreover, for most of the countries, road accidents cost 3% of their gross domestic product (GDP). Such factors result in increased demand for the vehicles equipped with autonomous emergency braking system (AEBS) and pedestrian protection systems for safety & security of the vehicle, driver, and people. Furthermore, road accidents cause considerable economic losses to individuals, their families, and nations. Thus, there is a growing demand for safety features in vehicles. Many automobile companies have introduced safety features to cater to the needs of the consumers. The automotive pedestrian protection system market is driven by the growing demand for safety features in automobiles, which in turn fuels the demand for pedestrians protection-based solutions to avoid road accidents.

High adoption rate of advanced emergency braking and collision control system

The AEBS possess high potential in case of crash avoidance & crash mitigation. BCollision Avoidance system functions of collision controls are to either avoid or at least mitigate a collision with a vehicle ahead with external airbags. This can be achieved either by warning to the driver or, if applicable, by autonomous braking of the vehicle. Systems with enhanced functions also respond for pedestrians, bicyclists, and other road users. Such advantages of pedestrian protection-based solutions are increasing its adoption globally. For instance, Nissan started offering GPS based ITS for pedestrian safety. This intelligent transport system cooperates with GPS mobile phones to detect pedestrians and alert drivers of the presence of pedestrians using voice and display messages on the car navigation monitor. In addition, the European general safety regulation has mandated AEBS for Hatchbacks (with the exemption of category N1) and for buses and coaches.

Increase in demand for improved visibility and safety features in vehicles

The demand for safety features such as parking assistance, collision avoidance systems, lane departure warnings, traction control, electronic stability control, tire pressure monitors, airbags, and telematics is expected to increase due to increase in the number of road accidents, worldwide. According to the Association of Safe International Road Travel (ASIRT), nearly 1.3 million people died in road crashes, worldwide, every year, with an average of 3,287 deaths per day. Thus, there is an increase in demand for safety features in vehicles. Automobile companies have introduced safety features to cater to the needs of the consumers. In addition, reduced visibility conditions, such as fog, frequently causes multiple vehicles crashes with serious consequences. The Radar and Lidar sensor used for pedestrian identifications warn the driver, whenever vehicle is in a condition to collide or crash on the upfront object, which helps in the avoidance of collision/crash, particularly in reduced visibility conditions. Such upgraded technology boost the market growth to some extends. The automotive pedestrian protection system market is driven by the growing demand for safety features in automobiles. The demand for driver assistance applications has significantly increased in the recent years due to increase in the purchasing power of consumers. This factor has influenced consumers to shift from normal driving to comfort driving. Moreover, the governments compulsion for safety rating and stop the crash campaign from various countries are creating awareness regarding safety parameters in vehicle. This factors are responsible to fuel the the automotive pedestrian protection system market opportunity in near future.

High integration and maintenance cost

The high cost associated with installing applications such as external airbags and highly precise collision avoidance sensors in vehicles restrains the growth of the automotive pedestrian protection system market as this factor leads to higher cost of the car. For instance, Subarus EyeSight starts at $1,195. Moreover, for standard brands, less expensive systems are implemented. For instance, Toyotas system costs as little as $500. The prospect of providing premium features in vehicles incurs additional expenses to consumers in the form of hardware, components. Moreover, the serviceability of the vehicle is difficult and requires skilled workers due to several electronic components and sensors. Thus, these factors are expected to have a significant impact on the growth of the automotive pedestrian protection systems market.

Lower efficiency in bad weather conditions

Environmental changes largely act as a restraint for pedestrian protection systems. The applications of pedestrian protection system do not work effectively in bad weather conditions. Vision-based systems especially have poor outcomes in bad weather and low light conditions. Moreover, the market is affected by other environmental factors such as lightning & thundering, storm, and others. These parameters are responsible to hinder the automotive pedestrian protection system market growth.

Increase in automotive safety norms

According to WHO, 1.25 million people die due to road accidents and millions more are injured. The safety of the vehicle plays a critical role in averting the crash or reducing the impact. Vehicles equipped with such standards are least anticipated to be involved in the accident. The minimum bCollision Avoidance system safety standards for the vehicle manufacturer and industry include standards on frontal and side impact protect occupants, electronic stability control, pedestrian protection, seat-belts, and ISOFIX child restraint anchorage point. Furthermore, there is an increase in trend and campaigns to include safety standard as bCollision Avoidance system feature, which creates lucrative opportunities for the market expansion. For instance, National Highway Traffic Safety Administration (NHTSA) Insurance Institute for Highway Safety (IIHS) announced that 99% of auto manufacturers in the U.S. have signed an agreement to include automatic emergency braking (AEB) systems as a standard feature by 2022 for all new vehicles. Such initiatives are expected to provide lucrative opportunities for the growth of the automotive pedestrian protection system market in the coming years.

Rise in passenger & luxury vehicles registrations

New SUV registrations increased in Europe, Russia, Japan, Brazil, India, and China, though it was sharply down in the U.S. In July 2017, the U.S. was the only major car market in the world with weaker growth with new light vehicle sales down 7%. The Indian and Russian car markets expanded rapidly with double-digit growth, while the recovery in Brazil continued at a more moderate pace. New passenger registrations in Japan increased for the ninth consecutive month. Moreover, in Europe and China, car sales was stronger but the UK recorded the fourth consecutive month of weaker car sales. Also, the luxury vehicles are more expensive than comparable vehicles. A record 28,500 of luxury vehicles were sold in 2016, a 15.9% increase with the demand fueled by China in particular. This is expected to create lucrative opportunities for the expansion of the automotive pedestrian protection system market.

Key Benefits for Automotive Pedestrian Protection System Market:

  • This study presents analytical depiction of the automotive pedestrian protection system market analysis along with the current trends and future estimations to depict the imminent investment pockets.
  • The overall market potential is determined to understand the profitable trends to gain a stronger foothold.
  • The report presents information related to key drivers, restraints, and opportunities of the market with a detailed impact analysis.
  • The current automotive pedestrian protection system market size is quantitatively analyzed from 2018 to 2025 to benchmark the financial competency.
  • Porters five forces analysis illustrates the potency of the buyers and suppliers in the automotive pedestrian protection system industry.

Automotive Pedestrian Protection System Market Report Highlights

Aspects Details
By Type
  • External Airbags
  • Pop-up Bonnets
By VEHICLE TYPE
  • SUV
  • Hatchback
  • Sedan
By COMPONENT TYPE
  • Sensors
  • Actuators
  • Control Units
  • Others (camera, accelerometer for air bags)
By DISTRIBUTION CHANNEL
  • OEM
  • AFTERMARKET
By Region
  • North America  (U.S, Canada, Mexico)
  • EUROPE  (UK, Germany, France, Russia, Rest of Europe)
  • Asia-Pacific  (China, Japan, India, Australia, Rest of Asia-Pacific)
  • LAMEA  (Latin America, Middle East, Africa)
Key Market Players VALEO, Nissan Motor Co., Ltd, DENSO Corporation, Continental AG, Autoliv, Inc, Mobileye, Fiat Chrysler Automobiles N.V, ZF Friedrichshafen AG, Robert Bosch GmbH, Audi AG
 

CHAPTER 1:    INTRODUCTION

1.1.    Report description
1.2.    Key benefits for stakeholders
1.3.    Key market segments
1.4.    Research methodology

1.4.1.    Primary research
1.4.2.    Secondary research
1.4.3.    Analyst tools and models

CHAPTER 2:    EXECUTIVE SUMMARY

2.1.    CXO perspective

CHAPTER 3:    MARKET OVERVIEW

3.1.    Market definition and scope
3.2.    Key findings

3.2.1.    Top impacting factors
3.2.2.    Top investment pockets
3.2.3.    Top winning strategies

3.3.    Porter’s five forces analysis
3.4.    Market share analysis (2017)
3.5.    Market dynamics

3.5.1.    Drivers

3.5.1.1.    Rise in number of road accidents
3.5.1.2.    High adoption rate of advanced emergency braking and collision control system
3.5.1.3.    Increasing demand for improved visibility and safety features in vehicles

3.5.2.    Restraint

3.5.2.1.    High integration and maintenance cost
3.5.2.2.    Lower efficiency in bad weather conditions

3.5.3.    Opportunities

3.5.3.1.    Increasing automotive safety norms
3.5.3.2.    Rise in passenger & luxury vehicles registrations

CHAPTER 4:    AUTOMOTIVE PEDESTRIAN PROTECTION SYSTEM MARKET, BY TYPE

4.1.    Overview
4.2.    EXTERNAL AIRBAGS

4.2.1.    Key market trends, growth factors, and opportunities
4.2.2.    Market size and forecast, by region
4.2.3.    Market analysis by country

4.3.    POP-UP BONNETS

4.3.1.    Key market trends, growth factors, and opportunities
4.3.2.    Market size and forecast, by region
4.3.3.    Market analysis by country

CHAPTER 5:    AUTOMOTIVE PEDESTRIAN PROTECTION SYSTEM MARKET, BY VEHICLE TYPE

5.1.    Overview
5.2.    SUV

5.2.1.    Key market trends, growth factors and opportunities
5.2.2.    Market size and forecast, by region
5.2.3.    Market analysis by country

5.3.    Hatchback

5.3.1.    Key market trends, growth factors and opportunities
5.3.2.    Market size and forecast, by region
5.3.3.    Market analysis by country

5.4.    Sedan

5.4.1.    Key market trends, growth factors and opportunities
5.4.2.    Market size and forecast, by region
5.4.3.    Market analysis by country

CHAPTER 6:    AUTOMOTIVE PEDESTRIAN PROTECTION SYSTEM MARKET, BY COMPONENT TYPE

6.1.    Overview
6.2.    Sensors

6.2.1.    Key market trends, growth factors and opportunities
6.2.2.    Market size and forecast, by region
6.2.3.    Market analysis by country

6.3.    Actuators

6.3.1.    Key market trends, growth factors, and opportunities
6.3.2.    Market size and forecast, by region
6.3.3.    Market analysis by country

6.4.    Control Units

6.4.1.    Key market trends, growth factors, and opportunities
6.4.2.    Market size and forecast, by region
6.4.3.    Market analysis by country

6.5.    Others

6.5.1.    Key market trends, growth factors, and opportunities
6.5.2.    Market size and forecast, by region
6.5.3.    Market analysis by country

CHAPTER 7:    AUTOMOTIVE PEDESTRIAN PROTECTION SYSTEM MARKET, BY DISTRIBUTION CHANNEL

7.1.    Overview
7.2.    OEM

7.2.1.    Key market trends, growth factors and opportunities
7.2.2.    Market size and forecast, by region
7.2.3.    Market analysis by country

7.3.    Aftermarket

7.3.1.    Key market trends, growth factors and opportunities
7.3.2.    Market size and forecast, by region
7.3.3.    Market analysis by country

CHAPTER 8:    AUTOMOTIVE PEDESTRIAN PROTECTION SYSTEM MARKET, BY REGION

8.1.    Overview
8.2.    North America

8.2.1.    Key market trends, growth factors, and opportunities
8.2.2.    Market size and forecast, by type
8.2.3.    Market size and forecast, by component type
8.2.4.    Market size and forecast, by vehicle type
8.2.5.    Market size and forecast, by distribution channel
8.2.6.    Market analysis by country

8.2.6.1.    U.S.

8.2.6.1.1.    Market size and forecast, by type
8.2.6.1.2.    Market size and forecast, by component type
8.2.6.1.3.    Market size and forecast, by distribution channel
8.2.6.1.4.    Market size and forecast, by vehicle type

8.2.6.2.    Canada

8.2.6.2.1.    Market size and forecast, by type
8.2.6.2.2.    Market size and forecast, by component type
8.2.6.2.3.    Market size and forecast, by distribution channel
8.2.6.2.4.    Market size and forecast, by vehicle type

8.2.6.3.    Mexico

8.2.6.3.1.    Market size and forecast, by type
8.2.6.3.2.    Market size and forecast, by component type
8.2.6.3.3.    Market size and forecast, by distribution channel
8.2.6.3.4.    Market size and forecast, by vehicle type

8.3.    Europe

8.3.1.    Key market trends, growth factors, and opportunities
8.3.2.    Market size and forecast, by type
8.3.3.    Market size and forecast, by component type
8.3.4.    Market size and forecast, by distribution channel
8.3.5.    Market size and forecast, by vehicle type
8.3.6.    Market analysis by country

8.3.6.1.    UK

8.3.6.1.1.    Market size and forecast, by type
8.3.6.1.2.    Market size and forecast, by component type
8.3.6.1.3.    Market size and forecast, by distribution channel
8.3.6.1.4.    Market size and forecast, by vehicle type

8.3.6.2.    Germany

8.3.6.2.1.    Market size and forecast, by type
8.3.6.2.2.    Market size and forecast, by component type
8.3.6.2.3.    Market size and forecast, by distribution channel
8.3.6.2.4.    Market size and forecast, by vehicle type

8.3.6.3.    France

8.3.6.3.1.    Market size and forecast, by type
8.3.6.3.2.    Market size and forecast, by component type
8.3.6.3.3.    Market size and forecast, by distribution channel
8.3.6.3.4.    Market size and forecast, by vehicle type

8.3.6.4.    Russia

8.3.6.4.1.    Market size and forecast, by type
8.3.6.4.2.    Market size and forecast, by component type
8.3.6.4.3.    Market size and forecast, by distribution channel
8.3.6.4.4.    Market size and forecast, by vehicle type

8.3.6.5.    Rest of Europe

8.3.6.5.1.    Market size and forecast, by type
8.3.6.5.2.    Market size and forecast, by component type
8.3.6.5.3.    Market size and forecast, by distribution channel
8.3.6.5.4.    Market size and forecast, by vehicle type

8.4.    Asia-Pacific

8.4.1.    Key market trends, growth factors, and opportunities
8.4.2.    Market size and forecast, by type
8.4.3.    Market size and forecast, by component type
8.4.4.    Market size and forecast, by distribution channel
8.4.5.    Market size and forecast, by vehicle type
8.4.6.    Market analysis by country

8.4.6.1.    China

8.4.6.1.1.    Market size and forecast, by type
8.4.6.1.2.    Market size and forecast, by component type
8.4.6.1.3.    Market size and forecast, by distribution channel
8.4.6.1.4.    Market size and forecast, by vehicle type

8.4.6.2.    Japan

8.4.6.2.1.    Market size and forecast, by type
8.4.6.2.2.    Market size and forecast, by component type
8.4.6.2.3.    Market size and forecast, by distribution channel
8.4.6.2.4.    Market size and forecast, by vehicle type

8.4.6.3.    India

8.4.6.3.1.    Market size and forecast, by type
8.4.6.3.2.    Market size and forecast, by component type
8.4.6.3.3.    Market size and forecast, by distribution channel
8.4.6.3.4.    Market size and forecast, by vehicle type

8.4.6.4.    Australia

8.4.6.4.1.    Market size and forecast, by type
8.4.6.4.2.    Market size and forecast, by component type
8.4.6.4.3.    Market size and forecast, by distribution channel
8.4.6.4.4.    Market size and forecast, by vehicle type

8.4.6.5.    Rest of Asia-Pacific

8.4.6.5.1.    Market size and forecast, by type
8.4.6.5.2.    Market size and forecast, by component type
8.4.6.5.3.    Market size and forecast, by distribution channel
8.4.6.5.4.    Market size and forecast, by vehicle type

8.5.    LAMEA

8.5.1.    Key market trends, growth factors, and opportunities
8.5.2.    Market size and forecast, by type
8.5.3.    Market size and forecast, by component type
8.5.4.    Market size and forecast, by distribution channel
8.5.5.    Market size and forecast, by vehicle type
8.5.6.    Market analysis by country

8.5.6.1.    Latin America

8.5.6.1.1.    Market size and forecast, by type
8.5.6.1.2.    Market size and forecast, by component type
8.5.6.1.3.    Market size and forecast, by distribution channel
8.5.6.1.4.    Market size and forecast, by vehicle type

8.5.6.2.    Middle East

8.5.6.2.1.    Market size and forecast, by type
8.5.6.2.2.    Market size and forecast, by component type
8.5.6.2.3.    Market size and forecast, by distribution channel
8.5.6.2.4.    Market size and forecast, by vehicle type

8.5.6.3.    Africa

8.5.6.3.1.    Market size and forecast, by type
8.5.6.3.2.    Market size and forecast, by component type
8.5.6.3.3.    Market size and forecast, by distribution channel
8.5.6.3.4.    Market size and forecast, by vehicle type

CHAPTER 9:    COMPANY PROFILES

9.1.    Audi AG

9.1.1.    Company overview
9.1.2.    Company snapshot
9.1.3.    Operating business segments
9.1.4.    Product portfolio
9.1.5.    Business performance
9.1.6.    Key strategic moves and developments

9.2.    Autoliv, Inc.

9.2.1.    Company overview
9.2.2.    Company snapshot
9.2.3.    Operating business segments
9.2.4.    Business performance
9.2.5.    Key strategic moves and developments

9.3.    Continental AG

9.3.1.    Company overview
9.3.2.    Company snapshot
9.3.3.    Operating business segments
9.3.4.    Product portfolio
9.3.5.    Business performance
9.3.6.    Key strategic moves and developments

9.4.    DENSO Corporation

9.4.1.    Company overview
9.4.2.    Company snapshot
9.4.3.    Operating business segments
9.4.4.    Product portfolio
9.4.5.    Business performance
9.4.6.    Key strategic moves and developments

9.5.    Mobileye

9.5.1.    Company overview
9.5.2.    Company snapshot
9.5.3.    Operating business segments
9.5.4.    Product portfolio
9.5.5.    Key strategic moves and developments

9.6.    Fiat Chrysler Automobiles N.V.

9.6.1.    Company overview
9.6.2.    Company snapshot
9.6.3.    Operating business segments
9.6.4.    Business performance

9.7.    Robert Bosch GmbH

9.7.1.    Company overview
9.7.2.    Company snapshot
9.7.3.    Operating business segments
9.7.4.    Product portfolio
9.7.5.    Business performance
9.7.6.    Key strategic moves and developments

9.8.    Nissan Motor Co., Ltd.

9.8.1.    Company overview
9.8.2.    Company snapshot
9.8.3.    Operating business segments
9.8.4.    Product portfolio
9.8.5.    Business performance
9.8.6.    Key strategic moves and developments

9.9.    ZF Friedrichshafen AG

9.9.1.    Company overview
9.9.2.    Company snapshot
9.9.3.    Operating business segments
9.9.4.    Product portfolio
9.9.5.    Business performance
9.9.6.    Key strategic moves and developments

9.10.    VALEO

9.10.1.    Company overview
9.10.2.    Company snapshot
9.10.3.    Operating business segments
9.10.4.    Product portfolio
9.10.5.    Business performance
9.10.6.    Key strategic moves and developments

LIST OF TABLES

TABLE 01.    GLOBAL AUTOMOTIVE PEDESTRIAN PROTECTION SYSTEM MARKET, BY TYPE, 2017-2025($MILLION)
TABLE 02.    AUTOMOTIVE PEDESTRIAN PROTECTION SYSTEM MARKET REVENUE FOR EXTERNAL AIRBAGS, BY REGION 2017–2025 ($MILLION)
TABLE 03.    AUTOMOTIVE PEDESTRIAN PROTECTION SYSTEM MARKET REVENUE FOR POP-UP BONNETS, BY REGION 2017–2025 ($MILLION)
TABLE 04.    GLOBAL AUTOMOTIVE PEDESTRIAN PROTECTION SYSTEM MARKET, BY VEHICLE TYPE, 2017–2025 ($MILLION)
TABLE 05.    AUTOMOTIVE PEDESTRIAN PROTECTION SYSTEM MARKET REVENUE FOR SUV, BY REGION, 2017–2025 ($MILLION)
TABLE 06.    AUTOMOTIVE PEDESTRIAN PROTECTION SYSTEM MARKET REVENUE FOR HATCHBACK, BY REGION 2017-2025 ($MILLION)
TABLE 07.    AUTOMOTIVE PEDESTRIAN PROTECTION SYSTEM MARKET REVENUE FOR SEDAN, BY REGION, 2017–2025 ($MILLION)
TABLE 08.    GLOBAL AUTOMOTIVE PEDESTRIAN PROTECTION SYSTEM MARKET, BY COMPONENT TYPE, 2017-2025($MILLION)
TABLE 09.    AUTOMOTIVE PEDESTRIAN PROTECTION SYSTEM MARKET REVENUE FOR SENSORS, BY REGION 2017-2025 ($MILLION)
TABLE 10.    AUTOMOTIVE PEDESTRIAN PROTECTION SYSTEM MARKET REVENUE FOR ACTUATORS, BY REGION 2017-2025 ($MILLION)
TABLE 11.    AUTOMOTIVE PEDESTRIAN PROTECTION SYSTEM MARKET REVENUE FOR CONTROL UNITS, BY REGION 2017–2025 ($MILLION)
TABLE 12.    AUTOMOTIVE PEDESTRIAN PROTECTION SYSTEM MARKET REVENUE FOR OTHERS, BY REGION 2017–2025 ($MILLION)
TABLE 13.    GLOBAL PEDESTRIAN PROTECTION SYSTEM MARKET MARKET, BY DISTRIBUTION CHANNEL, 2017–2025 ($MILLION)
TABLE 14.    AUTOMOTIVE PEDESTRIAN PROTECTION SYSTEM MARKET REVENUE FOR OEM, BY REGION, 2017–2025 ($MILLION)
TABLE 15.    AUTOMOTIVE PEDESTRIAN PROTECTION SYSTEM MARKET REVENUE FOR AFTERMARKET, BY REGION, 2017–2025 ($MILLION)
TABLE 16.    NORTH AMERICAN AUTOMOTIVE PEDESTRIAN PROTECTION SYSTEM MARKET, BY TYPE, 2017–2025 ($MILLION)
TABLE 17.    NORTH AMERICAN AUTOMOTIVE PEDESTRIAN PROTECTION SYSTEM MARKET, BY COMPONENT TYPE, 2017–2025 ($MILLION)
TABLE 18.    NORTH AMERICAN AUTOMOTIVE PEDESTRIAN PROTECTION SYSTEM MARKET, BY VEHICLE TYPE, 2017–2025 ($MILLION)
TABLE 19.    NORTH AMERICAN AUTOMOTIVE PEDESTRIAN PROTECTION SYSTEM MARKET, BY DISTRIBUTION CHANNEL, 2017–2025 ($MILLION)
TABLE 20.    U.S. AUTOMOTIVE PEDESTRIAN PROTECTION SYSTEM MARKET, BY TYPE, 2017–2025 ($MILLION)
TABLE 21.    U.S. AUTOMOTIVE PEDESTRIAN PROTECTION SYSTEM MARKET, BY COMPONENT TYPE, 2017–2025 ($MILLION)
TABLE 22.    U. S. AUTOMOTIVE PEDESTRIAN PROTECTION SYSTEM MARKET, BY DISTRIBUTION CHANNEL, 2017–2025 ($MILLION)
TABLE 23.    U.S. AUTOMOTIVE PEDESTRIAN PROTECTION SYSTEM MARKET, BY VEHICLE TYPE, 2017–2025 ($MILLION)
TABLE 24.    CANADA AUTOMOTIVE PEDESTRIAN PROTECTION SYSTEM MARKET, BY TYPE, 2017–2025 ($MILLION)
TABLE 25.    CANADA AUTOMOTIVE PEDESTRIAN PROTECTION SYSTEM MARKET, BY COMPONENT TYPE, 2017–2025 ($MILLION)
TABLE 26.    CANADA AUTOMOTIVE PEDESTRIAN PROTECTION SYSTEM MARKET, BY DISTRIBUTION CHANNEL, 2017–2025 ($MILLION)
TABLE 27.    CANADA AUTOMOTIVE PEDESTRIAN PROTECTION SYSTEM MARKET, BY VEHICLE TYPE, 2017–2025 ($MILLION)
TABLE 28.    MEXICO AUTOMOTIVE PEDESTRIAN PROTECTION SYSTEM MARKET, BY TYPE, 2017–2025 ($MILLION)
TABLE 29.    MEXICO AUTOMOTIVE PEDESTRIAN PROTECTION SYSTEM MARKET, BY COMPONENT TYPE, 2017–2025 ($MILLION)
TABLE 30.    MEXICO AUTOMOTIVE PEDESTRIAN PROTECTION SYSTEM MARKET, BY DISTRIBUTION CHANNEL, 2017–2025 ($MILLION)
TABLE 31.    MEXICO AUTOMOTIVE PEDESTRIAN PROTECTION SYSTEM MARKET, BY VEHICLE TYPE, 2017–2025 ($MILLION)
TABLE 32.    EUROPEAN AUTOMOTIVE PEDESTRIAN PROTECTION SYSTEM MARKET, BY TYPE, 2017–2025 ($MILLION)
TABLE 33.    EUROPEAN AUTOMOTIVE PEDESTRIAN PROTECTION SYSTEM MARKET, BY COMPONENT TYPE, 2017–2025 ($MILLION)
TABLE 34.    EUROPEAN AUTOMOTIVE PEDESTRIAN PROTECTION SYSTEM MARKET, BY DISTRIBUTION CHANNEL, 2017–2025 ($MILLION)
TABLE 35.    EUROPEAN AUTOMOTIVE PEDESTRIAN PROTECTION SYSTEM MARKET, BY VEHICLE TYPE, 2017–2025 ($MILLION)
TABLE 36.    UK AUTOMOTIVE PEDESTRIAN PROTECTION SYSTEM MARKET, BY TYPE, 2017–2025 ($MILLION)
TABLE 37.    UK AUTOMOTIVE PEDESTRIAN PROTECTION SYSTEM MARKET, BY COMPONENT TYPE, 2017–2025 ($MILLION)
TABLE 38.    UK AUTOMOTIVE PEDESTRIAN PROTECTION SYSTEM MARKET, BY DISTRIBUTION CHANNEL, 2017–2025 ($MILLION)
TABLE 39.    UK AUTOMOTIVE PEDESTRIAN PROTECTION SYSTEM MARKET, BY VEHICLE TYPE, 2017–2025 ($MILLION)
TABLE 40.    GERMANY AUTOMOTIVE PEDESTRIAN PROTECTION SYSTEM MARKET, BY TYPE, 2017–2025 ($MILLION)
TABLE 41.    GERMANY AUTOMOTIVE PEDESTRIAN PROTECTION SYSTEM MARKET, BY COMPONENT TYPE, 2017–2025 ($MILLION)
TABLE 42.    GERMANY AUTOMOTIVE PEDESTRIAN PROTECTION SYSTEM MARKET, BY DISTRIBUTION CHANNEL, 2017–2025 ($MILLION)
TABLE 43.    GERMANY AUTOMOTIVE PEDESTRIAN PROTECTION SYSTEM MARKET, BY VEHICLE TYPE, 2017–2025 ($MILLION)
TABLE 44.    FRANCE AUTOMOTIVE PEDESTRIAN PROTECTION SYSTEM MARKET, BY TYPE, 2017–2025 ($MILLION)
TABLE 45.    FRANCE AUTOMOTIVE PEDESTRIAN PROTECTION SYSTEM MARKET, BY COMPONENT TYPE, 2017–2025 ($MILLION)
TABLE 46.    FRANCE AUTOMOTIVE PEDESTRIAN PROTECTION SYSTEM MARKET, BY DISTRIBUTION CHANNEL, 2017–2025 ($MILLION)
TABLE 47.    FRANCE AUTOMOTIVE PEDESTRIAN PROTECTION SYSTEM MARKET, BY VEHICLE TYPE, 2017–2025 ($MILLION)
TABLE 48.    RUSSIA AUTOMOTIVE PEDESTRIAN PROTECTION SYSTEM MARKET, BY TYPE, 2017–2025 ($MILLION)
TABLE 49.    RUSSIA AUTOMOTIVE PEDESTRIAN PROTECTION SYSTEM MARKET, BY COMPONENT TYPE, 2017–2025 ($MILLION)
TABLE 50.    RUSSIA AUTOMOTIVE PEDESTRIAN PROTECTION SYSTEM MARKET, BY DISTRIBUTION CHANNEL, 2017–2025 ($MILLION)
TABLE 51.    RUSSIA AUTOMOTIVE PEDESTRIAN PROTECTION SYSTEM MARKET, BY VEHICLE TYPE, 2017–2025 ($MILLION)
TABLE 52.    REST OF EUROPE AUTOMOTIVE PEDESTRIAN PROTECTION SYSTEM MARKET, BY TYPE, 2017–2025 ($MILLION)
TABLE 53.    REST OF EUROPE AUTOMOTIVE PEDESTRIAN PROTECTION SYSTEM MARKET, BY COMPONENT TYPE, 2017–2025 ($MILLION)
TABLE 54.    REST OF EUROPE AUTOMOTIVE PEDESTRIAN PROTECTION SYSTEM MARKET, BY DISTRIBUTION CHANNEL, 2017–2025 ($MILLION)
TABLE 55.    REST OF EUROPE AUTOMOTIVE PEDESTRIAN PROTECTION SYSTEM MARKET, BY VEHICLE TYPE, 2017–2025 ($MILLION)
TABLE 56.    ASIA-PACIFIC AUTOMOTIVE PEDESTRIAN PROTECTION SYSTEM MARKET, BY TYPE, 2017–2025 ($MILLION)
TABLE 57.    ASIA-PACIFIC AUTOMOTIVE PEDESTRIAN PROTECTION SYSTEM MARKET, BY COMPONENT TYPE, 2017–2025 ($MILLION)
TABLE 58.    ASIA-PACIFIC AUTOMOTIVE PEDESTRIAN PROTECTION SYSTEM MARKET, BY DISTRIBUTION CHANNEL, 2017–2025 ($MILLION)
TABLE 59.    ASIA-PACIFIC AUTOMOTIVE PEDESTRIAN PROTECTION SYSTEM MARKET, BY VEHICLE TYPE, 2017–2025 ($MILLION)
TABLE 60.    CHINA AUTOMOTIVE PEDESTRIAN PROTECTION SYSTEM MARKET, BY TYPE, 2017–2025 ($MILLION)
TABLE 61.    CHINA AUTOMOTIVE PEDESTRIAN PROTECTION SYSTEM MARKET, BY COMPONENT TYPE, 2017–2025 ($MILLION)
TABLE 62.    CHINA AUTOMOTIVE PEDESTRIAN PROTECTION SYSTEM MARKET, BY DISTRIBUTION CHANNEL, 2017–2025 ($MILLION)
TABLE 63.    CHINA AUTOMOTIVE PEDESTRIAN PROTECTION SYSTEM MARKET, BY VEHICLE TYPE, 2017–2025 ($MILLION)
TABLE 64.    JAPAN AUTOMOTIVE PEDESTRIAN PROTECTION SYSTEM MARKET, BY TYPE, 2017–2025 ($MILLION)
TABLE 65.    JAPAN AUTOMOTIVE PEDESTRIAN PROTECTION SYSTEM MARKET, BY COMPONENT TYPE, 2017–2025 ($MILLION)
TABLE 66.    JAPAN AUTOMOTIVE PEDESTRIAN PROTECTION SYSTEM MARKET, BY DISTRIBUTION CHANNEL, 2017–2025 ($MILLION)
TABLE 67.    JAPAN AUTOMOTIVE PEDESTRIAN PROTECTION SYSTEM MARKET, BY VEHICLE TYPE, 2017–2025 ($MILLION)
TABLE 68.    INDIA AUTOMOTIVE PEDESTRIAN PROTECTION SYSTEM MARKET, BY TYPE, 2017–2025 ($MILLION)
TABLE 69.    INDIA AUTOMOTIVE PEDESTRIAN PROTECTION SYSTEM MARKET, BY COMPONENT TYPE, 2017–2025 ($MILLION)
TABLE 70.    INDIA AUTOMOTIVE PEDESTRIAN PROTECTION SYSTEM MARKET, BY DISTRIBUTION CHANNEL, 2017–2025 ($MILLION)
TABLE 71.    INDIA AUTOMOTIVE PEDESTRIAN PROTECTION SYSTEM MARKET, BY VEHICLE TYPE, 2017–2025 ($MILLION)
TABLE 72.    AUSTRALIA AUTOMOTIVE PEDESTRIAN PROTECTION SYSTEM MARKET, BY TYPE, 2017–2025 ($MILLION)
TABLE 73.    AUSTRALIA AUTOMOTIVE PEDESTRIAN PROTECTION SYSTEM MARKET, BY COMPONENT TYPE, 2017–2025 ($MILLION)
TABLE 74.    AUSTRALIA AUTOMOTIVE PEDESTRIAN PROTECTION SYSTEM MARKET, BY DISTRIBUTION CHANNEL, 2017–2025 ($MILLION)
TABLE 75.    AUSTRALIA AUTOMOTIVE PEDESTRIAN PROTECTION SYSTEM MARKET, BY VEHICLE TYPE, 2017–2025 ($MILLION)
TABLE 76.    REST OF ASIA-PACIFIC AUTOMOTIVE PEDESTRIAN PROTECTION SYSTEM MARKET, BY TYPE, 2017–2025 ($MILLION)
TABLE 77.    REST OF ASIA-PACIFIC AUTOMOTIVE PEDESTRIAN PROTECTION SYSTEM MARKET, BY COMPONENT TYPE, 2017–2025 ($MILLION)
TABLE 78.    REST OF ASIA-PACIFIC AUTOMOTIVE PEDESTRIAN PROTECTION SYSTEM MARKET, BY DISTRIBUTION CHANNEL, 2017–2025 ($MILLION)
TABLE 79.    REST OF ASIA-PACIFIC AUTOMOTIVE PEDESTRIAN PROTECTION SYSTEM MARKET, BY VEHICLE TYPE, 2017–2025 ($MILLION)
TABLE 80.    LAMEA AUTOMOTIVE PEDESTRIAN PROTECTION SYSTEM MARKET, BY TYPE, 2017–2025 ($MILLION)
TABLE 81.    LAMEA AUTOMOTIVE PEDESTRIAN PROTECTION SYSTEM MARKET, BY COMPONENT TYPE, 2017–2025 ($MILLION)
TABLE 82.    LAMEA AUTOMOTIVE PEDESTRIAN PROTECTION SYSTEM MARKET, BY DISTRIBUTION CHANNEL, 2017–2025 ($MILLION)
TABLE 83.    LAMEA AUTOMOTIVE PEDESTRIAN PROTECTION SYSTEM MARKET, BY VEHICLE TYPE, 2017–2025 ($MILLION)
TABLE 84.    LATIN AMERICA AUTOMOTIVE PEDESTRIAN PROTECTION SYSTEM MARKET, BY TYPE, 2017–2025 ($MILLION)
TABLE 85.    LATIN AMERICA AUTOMOTIVE PEDESTRIAN PROTECTION SYSTEM MARKET, BY COMPONENT TYPE, 2017–2025 ($MILLION)
TABLE 86.    LATIN AMERICA AUTOMOTIVE PEDESTRIAN PROTECTION SYSTEM MARKET, BY DISTRIBUTION CHANNEL, 2017–2025 ($MILLION)
TABLE 87.    LATIN AMERICA AUTOMOTIVE PEDESTRIAN PROTECTION SYSTEM MARKET, BY VEHICLE TYPE, 2017–2025 ($MILLION)
TABLE 88.    MIDDLE EAST AUTOMOTIVE PEDESTRIAN PROTECTION SYSTEM MARKET, BY TYPE, 2017–2025 ($MILLION)
TABLE 89.    MIDDLE EAST AUTOMOTIVE PEDESTRIAN PROTECTION SYSTEM MARKET, BY COMPONENT TYPE, 2017–2025 ($MILLION)
TABLE 90.    MIDDLE EAST AUTOMOTIVE PEDESTRIAN PROTECTION SYSTEM MARKET, BY DISTRIBUTION CHANNEL, 2017–2025 ($MILLION)
TABLE 91.    MIDDLE EAST AUTOMOTIVE PEDESTRIAN PROTECTION SYSTEM MARKET, BY VEHICLE TYPE, 2017–2025 ($MILLION)
TABLE 92.    AFRICA AUTOMOTIVE PEDESTRIAN PROTECTION SYSTEM MARKET, BY TYPE, 2017–2025 ($MILLION)
TABLE 93.    AFRICA AUTOMOTIVE PEDESTRIAN PROTECTION SYSTEM MARKET, BY COMPONENT TYPE, 2017–2025 ($MILLION)
TABLE 94.    AFRICA AUTOMOTIVE PEDESTRIAN PROTECTION SYSTEM MARKET, BY DISTRIBUTION CHANNEL, 2017–2025 ($MILLION)
TABLE 95.    AFRICA AUTOMOTIVE PEDESTRIAN PROTECTION SYSTEM MARKET, BY VEHICLE TYPE, 2017–2025 ($MILLION)
TABLE 96.    AUDI AG: COMPANY SNAPSHOT
TABLE 97.    AUDI AG: OPERATING SEGMENTS
TABLE 98.    AUDI AG: PRODUCT PORTFOLIO
TABLE 99.    AUTOLIV: COMPANY SNAPSHOT
TABLE 100.    AUTOLIV: OPERATING SEGMENTS
TABLE 101.    CONTINENTAL AG: COMPANY SNAPSHOT
TABLE 102.    CONTINENTAL AG: OPERATING SEGMENTS
TABLE 103.    CONTINENTAL AG: PRODUCT PORTFOLIO
TABLE 104.    DENSO CORPORATION: COMPANY SNAPSHOT
TABLE 105.    DENSO CORPORATION: OPERATING SEGMENTS
TABLE 106.    DENSO CORPORATION: PRODUCT PORTFOLIO
TABLE 107.    MOBILEYE: COMPANY SNAPSHOT
TABLE 108.    MOBILEYE.: PRODUCT CATEGORY
TABLE 109.    MOBILEYE: PRODUCT PORTFOLIO
TABLE 110.    FIAT CHRYSLER AUTOMOBILES N.V..: COMPANY SNAPSHOT
TABLE 111.    FIAT CHRYSLER AUTOMOBILES N.V.: OPERATING SEGMENTS
TABLE 112.    ROBERT BOSCH GMBH: PRODUCT PORTFOLIO
TABLE 113.    NISSAN MOTOR CO., LTD.: COMPANY SNAPSHOT
TABLE 114.    NISSAN MOTOR CO., LTD.: OPERATING DIVISIONS
TABLE 115.    NISSAN MOTOR CO LTD: PRODUCT PORTFOLIO
TABLE 116.    ZF: COMPANY SNAPSHOT
TABLE 117.    ZF: OPERATING SEGMENTS
TABLE 118.    ZF: PRODUCT PORTFOLIO
TABLE 119.    VALEO SA: COMPANY SNAPSHOT
TABLE 120.    VALEO SA: OPERATING SEGMENTS
TABLE 121.    VALEO SA: PRODUCT PORTFOLIO

LIST OF FIGURES

FIGURE 01.    KEY MARKET SEGMENTS
FIGURE 02.    EXECUTIVE SUMMARY
FIGURE 03.    EXECUTIVE SUMMARY
FIGURE 04.    TOP IMPACTING FACTORS
FIGURE 05.    TOP INVESTMENT POCKETS
FIGURE 06.    TOP WINNING STRATEGIES, BY YEAR, 2015–2019*
FIGURE 07.    TOP WINNING STRATEGIES, BY YEAR, 2015–2019*
FIGURE 08.    TOP WINNING STRATEGIES, BY COMPANY, 2015–2019*
FIGURE 09.    MODERATE-TO-MODERATE BARGAINING POWER OF SUPPLIERS
FIGURE 10.    MODERATE-TO-HIGH THREAT OF NEW ENTRANTS
FIGURE 11.    LOW-TO-HIGH THREAT OF SUBSTITUTES
FIGURE 12.    HIGH-TO-HIGH INTENSITY OF RIVALRY
FIGURE 13.    LOW-TO-LOW BARGAINING POWER OF BUYERS
FIGURE 14.    MARKET SHARE ANALYSIS (2017)
FIGURE 15.    GLOBAL AUTOMOTIVE PEDESTRIAN PROTECTION SYSTEM MARKET SHARE, BY TYPE, 2017–2025 (%)
FIGURE 16.    COMPARATIVE SHARE ANALYSIS OF AUTOMOTIVE PEDESTRIAN PROTECTION SYSTEM MARKET FOR EXTERNAL AIRBAGS, BY COUNTRY, 2017 & 2025 (%)
FIGURE 17.    COMPARATIVE SHARE ANALYSIS OF AUTOMOTIVE PEDESTRIAN PROTECTION SYSTEM MARKET FOR POP-UP BONNETS, BY COUNTRY, 2017 & 2025 (%)
FIGURE 18.    GLOBAL AUTOMOTIVE PEDESTRIAN PROTECTION SYSTEM MARKET SHARE, BY VEHICLE TYPE, 2017–2025 (%)
FIGURE 19.    COMPARATIVE SHARE ANALYSIS OF AUTOMOTIVE PEDESTRIAN PROTECTION SYSTEM MARKET FOR SUV, BY COUNTRY, 2017 & 2025 (%)
FIGURE 20.    COMPARATIVE SHARE ANALYSIS OF AUTOMOTIVE PEDESTRIAN PROTECTION SYSTEM MARKET FOR HATCHBACK, BY COUNTRY, 2017 & 2025 (%)
FIGURE 21.    COMPARATIVE SHARE ANALYSIS OF AUTOMOTIVE PEDESTRIAN PROTECTION SYSTEM MARKET FOR SEDAN, BY COUNTRY, 2017 & 2025 (%)
FIGURE 22.    GLOBAL AUTOMOTIVE PEDESTRIAN PROTECTION SYSTEM MARKET SHARE, BY COMPONENT TYPE, 2017–2025 (%)
FIGURE 23.    COMPARATIVE SHARE ANALYSIS OF AUTOMOTIVE PEDESTRIAN PROTECTION SYSTEM MARKET FOR SENSORS, BY COUNTRY, 2017 & 2025 (%)
FIGURE 24.    COMPARATIVE SHARE ANALYSIS OF AUTOMOTIVE PEDESTRIAN PROTECTION SYSTEM MARKET FOR ACTUATORS, BY COUNTRY, 2017 & 2025 (%)
FIGURE 25.    COMPARATIVE SHARE ANALYSIS OF AUTOMOTIVE PEDESTRIAN PROTECTION SYSTEM MARKET FOR CONTROL UNITS, BY COUNTRY, 2017 & 2025 (%)
FIGURE 26.    COMPARATIVE SHARE ANALYSIS OF AUTOMOTIVE PEDESTRIAN PROTECTION SYSTEM MARKET FOR OTHERS, BY COUNTRY, 2017 & 2025 (%)
FIGURE 27.    GLOBAL AUTOMOTIVE PEDESTRIAN PROTECTION SYSTEM MARKET SHARE, BY DISTRIBUTION CHANNEL, 2017–2025 (%)
FIGURE 28.    COMPARATIVE SHARE ANALYSIS OF AUTOMOTIVE PEDESTRIAN PROTECTION SYSTEM MARKET FOR OEM, BY COUNTRY, 2017 & 2025 (%)
FIGURE 29.    COMPARATIVE SHARE ANALYSIS OF AUTOMOTIVE PEDESTRIAN PROTECTION SYSTEM MARKET FOR AFTERMARKET, BY COUNTRY, 2017 & 2025 (%)
FIGURE 30.    AUTOMOTIVE PEDESTRIAN PROTECTION SYSTEM MARKET, BY REGION, 2017-2025 (%)
FIGURE 31.    COMPARATIVE SHARE ANALYSIS OF AUTOMOTIVE PEDESTRIAN PROTECTION SYSTEM MARKET, BY COUNTRY, 2017–2025 (%)
FIGURE 32.    U.S. AUTOMOTIVE PEDESTRIAN PROTECTION SYSTEM MARKET, 2017–2025 ($MILLION)
FIGURE 33.    CANADA AUTOMOTIVE PEDESTRIAN PROTECTION SYSTEM MARKET, 2017–2025 ($MILLION)
FIGURE 34.    MEXICO AUTOMOTIVE PEDESTRIAN PROTECTION SYSTEM MARKET, 2017–2025 ($MILLION)
FIGURE 35.    COMPARATIVE SHARE ANALYSIS OF AUTOMOTIVE PEDESTRIAN PROTECTION SYSTEM MARKET, BY COUNTRY, 2017–2025 (%)
FIGURE 36.    UK AUTOMOTIVE PEDESTRIAN PROTECTION SYSTEM MARKET, 2017–2025 ($MILLION)
FIGURE 37.    GERMANY AUTOMOTIVE PEDESTRIAN PROTECTION SYSTEM MARKET, 2017–2025 ($MILLION)
FIGURE 38.    FRANCE AUTOMOTIVE PEDESTRIAN PROTECTION SYSTEM MARKET, 2017–2025 ($MILLION)
FIGURE 39.    RUSSIA AUTOMOTIVE PEDESTRIAN PROTECTION SYSTEM MARKET, 2017–2025 ($MILLION)
FIGURE 40.    REST OF EUROPE AUTOMOTIVE PEDESTRIAN PROTECTION SYSTEM MARKET, 2017–2025 ($MILLION)
FIGURE 41.    COMPARATIVE SHARE ANALYSIS OF AUTOMOTIVE PEDESTRIAN PROTECTION SYSTEM MARKET, BY COUNTRY, 2017–2025 (%)
FIGURE 42.    CHINA AUTOMOTIVE PEDESTRIAN PROTECTION SYSTEM MARKET, 2017–2025 ($MILLION)
FIGURE 43.    JAPAN AUTOMOTIVE PEDESTRIAN PROTECTION SYSTEM MARKET, 2017–2025 ($MILLION)
FIGURE 44.    INDIA AUTOMOTIVE PEDESTRIAN PROTECTION SYSTEM MARKET, 2017–2025 ($MILLION)
FIGURE 45.    AUSTRALIA AUTOMOTIVE PEDESTRIAN PROTECTION SYSTEM MARKET, 2017–2025 ($MILLION)
FIGURE 46.    REST OF ASIA-PACIFIC AUTOMOTIVE PEDESTRIAN PROTECTION SYSTEM MARKET, 2017–2025 ($MILLION)
FIGURE 47.    COMPARATIVE SHARE ANALYSIS OF AUTOMOTIVE PEDESTRIAN PROTECTION SYSTEM MARKET, BY COUNTRY, 2017–2025 (%)
FIGURE 48.    LATIN AMERICA AUTOMOTIVE PEDESTRIAN PROTECTION SYSTEM MARKET, 2017–2025 ($MILLION)
FIGURE 49.    MIDDLE EAST AUTOMOTIVE PEDESTRIAN PROTECTION SYSTEM MARKET, 2017–2025 ($MILLION)
FIGURE 50.    AFRICA AUTOMOTIVE PEDESTRIAN PROTECTION SYSTEM MARKET, 2017–2025 ($MILLION)
FIGURE 51.    AUDI AG: REVENUE, 2015–2017 ($MILLION)
FIGURE 52.    AUDI AG: REVENUE SHARE BY SEGMENT, 2017 (%)
FIGURE 53.    AUDI AG: REVENUE SHARE BY GEOGRAPHY, 2017 (%)
FIGURE 54.    AUTOLIV: NET SALES, 2015–2017 ($MILLION)
FIGURE 55.    AUTOLIV: REVENUE SHARE BY SEGMENT, 2017 (%)
FIGURE 56.    AUTOLIV: REVENUE SHARE BY GEOGRAPHY, 2017 (%)
FIGURE 57.    CONTINENTAL AG: REVENUE, 2015–2017 ($MILLION)
FIGURE 58.    CONTINENTAL AG: REVENUE SHARE BY SEGMENT, 2017 (%)
FIGURE 59.    CONTINENTAL AG: REVENUE SHARE BY REGION, 2017 (%)
FIGURE 60.    DENSO CORPORATION: NET SALES, 2016–2018 ($MILLION)
FIGURE 61.    DENSO: REVENUE SHARE BY SEGMENT, 2018 (%)
FIGURE 62.    DENSO: REVENUE SHARE BY REGION, 2018 (%)
FIGURE 63.    FIAT CHRYSLER AUTOMOBILES N.V.: REVENUE, 2015–2017 ($MILLION)
FIGURE 64.    FIAT CHRYSLER AUTOMOBILES N.V.: REVENUE SHARE BY SEGMENT, 2018 (%)
FIGURE 65.    FIAT CHRYSLER AUTOMOBILES N.V.: REVENUE SHARE BY GEOGRAPHY, 2018 (%)
FIGURE 66.    ROBERT BOSCH GMBH: REVENUE, 2015–2017 ($MILLION)
FIGURE 67.    ROBERT BOSCH GMBH: REVENUE BY SEGMENT, 2017 (%)
FIGURE 68.    ROBERT BOSCH GMBH: REVENUE SHARE BY REGION, 2017 (%)
FIGURE 69.    NISSAN MOTOR CO., LTD.: REVENUE, 2014–2016 ($MILLION)
FIGURE 70.    ZF: NET SALES, 2015–2017 ($MILLION)
FIGURE 71.    ZF: REVENUE SHARE BY SEGMENT, 2017 (%)
FIGURE 72.    ZF: REVENUE SHARE BY GEOGRAPHY, 2017 (%)
FIGURE 73.    VALEO SA: NET SALES, 2015–2017 ($MILLION)
FIGURE 74.    VALEO SA: REVENUE SHARE BY SEGMENT, 2017 (%)
FIGURE 75.    VALEO SA: REVENUE SHARE BY GEOGRAPHY, 2017 (%)


Automotive pedestrian protection systems are designed to decrease the accidental injuries due to crashes between the pedestrian and a vehicle. Such systems involve technologies such as LiDAR, RADAR, ultrasonic, control units, eternal airbags, pop up bonnet, and camera, which monitor the environment of the vehicle constantly and assist the driver in order to avoid collision with the pedestrian.

The pedestrian protection system monitors pedestrian’s sudden collision with the front bumper and the acceleration sensor detects that motion (in terms of acceleration). It then sends the corresponding signal to the control unit. The control unit then sends a signal to the motor and actuators to lift the engine hood so that pedestrian can safely land on the bonnet and airbags without any injury.

The global automotive pedestrian protection system market is driven by growth in number of road accidents, high adoption rate of advanced emergency braking system & collision control system, and increase in demand for improved visibility and safety features in vehicles. Furthermore, shifting consumer preference to enhance driving experience and rise in demand for premium cars boost the growth of the automotive pedestrian protection system market. In addition, technological advancements for the development of safety features further boost the demand for the global automotive pedestrian protection system market.

High installation cost and lower efficiency in bad weather conditions are some of the major restraining factors of this market. Moreover, onetime use of external airbags adds up to the cost, which further impedes the growth of the market.

Furthermore, rise in consumer demand for safety & comfort and increase in global demand for premium & luxury vehicles registration provide growth opportunities for the market globally. This can be attributed to rise in the sale of automated vehicles globally, which further offers lucrative opportunities for the automotive pedestrian protection system market globally.

Among the analyzed geographical regions, currently, Europe is the highest revenue contributor, and is expected to remain dominant during the forecast period, followed by Asia Pacific, North America, and LAMEA. This growth is attributed to increase in demand for pop up hoods.

PURCHASE OPTIONS

Call or Email us

U.S.-Canada Toll-free: +1-800-792-5285
Int'l : +1-503-894-6022
Europe : +44-845-528-1300
Email : help@alliedmarketresearch.com

Looking for Customization?

 Customization Request

Have a Question?

 Speak with Analyst

Any Confusion?

 Inquire Before Buying

Have a glance of the Report

  Request Sample

Purchase Full Report of
Automotive Pedestrian Protection System Market

Start reading instantly.
This Report and over 66,905+ more Reports, Available with Avenue Library. T&C*.

  • Online Only
  • $3,456
  • Online cloud access only
  • Restricted print, copy, paste & download
  • Read only
  • Free industry update
    (Within 180 days)
  • Free report update in next update cycle
    (Apr 2020 - Apr 2021)
  • Data Pack
  • $3,840
  • Restricted to one authorized user
  • One print only
  • Available in
    Excel
  • Free industry update
    (Within 180 days)
  •   Free report update in next update cycle
    (Apr 2020 - Apr 2021)
  • Single User
  • $5,769
  • Restricted to one authorized user
  • One print only
  • Available in
    PDF
  • Free industry update
    (Within 180 days)
  •   Free report update in next update cycle
    (Apr 2020 - Apr 2021)
  • Five Users
  • $6,450
  • Limited to five authorized users
  • Print upto five copies
  • Available in
    PDF
  • Free industry update
    (Within 180 days)
  •   Free report update in next update cycle
    (Apr 2020 - Apr 2021)
  • Enterprise
    License/PDF

  • $10,995
  • Unlimited
    within
    company/enterprise
  • Available in Excel & PDF
  • Free industry update
    (Within 180 days)
  •   Free report update in next update cycle
    (Apr 2020 - Apr 2021)
  • Library
    Membership

  • $999 $ 1,175
    Per User/ Per month/ Billed annually
  • Published Content
    E-access
  • Company Profiles
    E-access
  • Newly Added Content Access
  • 10 PDF
    Downloads
  • 5 Excel Data
    Pack Downloads
  • 250 Company Profiles PDF Downloads
  • Buy Now

*Taxes/Fees, if applicable will be added during checkout. All prices in USD

RELATED REPORTS
 

Why Allied Market Research?


Infallible Methodology

To ensure high-level data integrity, accurate analysis, and impeccable forecasts

Analyst Support

For complete satisfaction

Customization

On-demand customization of scope of the report to exactly meet your needs

TARGETED MARKET VIEW

Targeted market view to provide pertinent information and save time of readers

Get fresh content delivered

Get insights on topics that are crucial for your business. Stay abreast of your interest areas.

Get Industry Data Alerts

Why Allied Market Research?

Infallible Methodology

To ensure high-level data integrity, accurate analysis, and impeccable forecasts

Analyst Support

For complete satisfaction

Customization

On-demand customization of scope of the report to exactly meet your needs

TARGETED MARKET VIEW

Targeted market view to provide pertinent information and save time of readers