0
2022
Baby Care Products Market

Baby Care Products Market

by Products Type (Baby Skin Care, Baby Hair Care, Baby Food and Beverage, Others), by Price Point (Low, Medium, High), by Distribution Channel (Supermarkets and Hypermarkets, Drug Stores or Pharmacy, Mass Merchandiser, Departmental Stores, Mono Brand Stores, Specialty Stores, Online Sales Channel): Global Opportunity Analysis and Industry Forecast, 2022-2031

Report Code: A16900
Jul 2022 | Pages: 305
Tables: 140
Charts: 70
  • Formats*:

  • pdf

    Single User License, Five User
    License & Enterprise User License

  • xls

    Data Pack Excel License

  • ppt

    It comes with the additional cost
    of $2500.00 contact sales.


The global baby care products market size was valued at $38.0 billion in 2021, and is projected to reach $58.8 billion by 2031, growing at a CAGR of 4.5% from 2022 to 2031.

The baby care products market is expanding as a result of growing parental concerns about their children's skin. In addition, infant skin must be shielded from dirt exposure as it is typically sensitive. People are more likely to select skin care products owing to rise in awareness regarding hygiene and overall health of babies. Moreover, kids are more prone to develop chronic diseases and attract microorganisms that lead to diseases. Many companies have devised unique solutions to illustrate the importance of hygiene in babies and how this might affect their health.

Baby Care Products Market

For their infants, the majority of parents choose homemade baby food to packaged baby food. This pattern has changed, nevertheless, as a result of time demands placed on food preparation as a result of the greater engagement of women in the workforce and growing dietary concerns. Moreover, high price of the baby food products has hampered their adoption among middle-income groups. In addition, due to a lack of knowledge about these items, consumers favor home-cooked food in rural and isolated areas. Promotional efforts and reasonably priced infant food items are expected to result in an overall rise in the market's revenue generation.

The market is segmented into product type, price point, distribution channel, and region. On the basis of product type, the market is classified into baby skin care, baby hair care, baby food & beverage, and others. By price point, it is bifurcated into low, medium, and high. As per distribution channel, it is categorized into supermarkets & hypermarkets, drug stores or pharmacy, mass merchandiser, departmental stores, mono-brand stores, specialty stores, online sales channel, and others. Region-wise, the market is analyzed across North America, Europe, Asia-Pacific, and LAMEA.
Baby Care Products Market

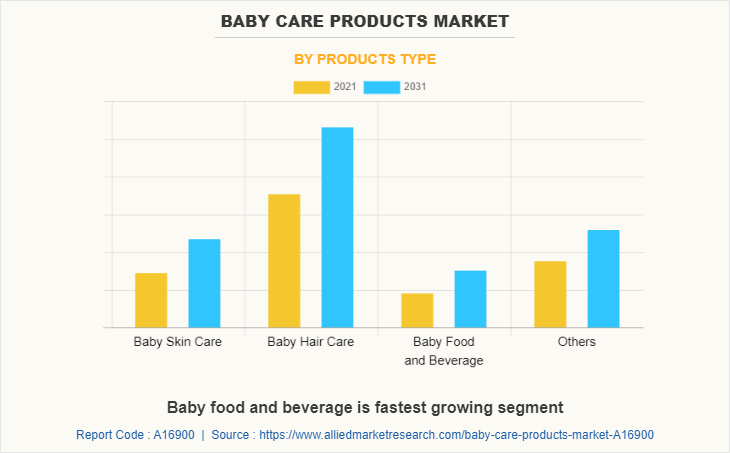
The baby hair care segment dominates the global baby care products market. This is mostly caused by the rise in proportion of working women in these nations. A number of factors, including rise in discretionary income, new product launches, and rapid urbanization, are expected to affect the sales volume during the forecast period. This market is expanding as a result of the emergence of organized retail, which ensures accessibility of cutting-edge goods and multinational brands with specialized features.
Baby Care Products Market

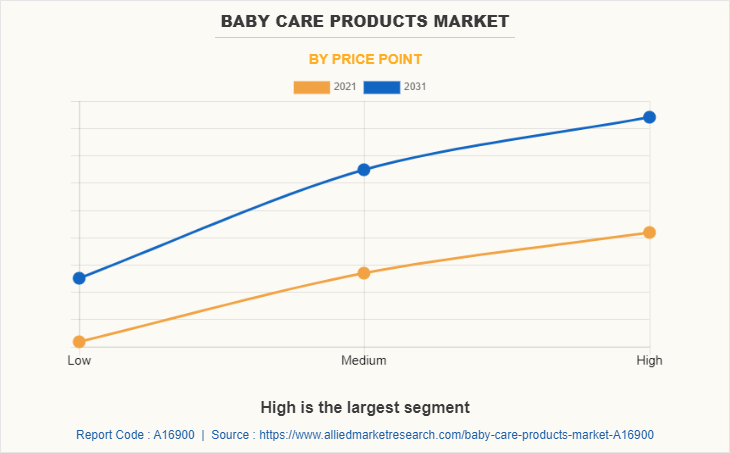
The medium segment exhibits the fastest growth, owing to rise in preference for natural and organic products at reasonable prices. Developing regions of North America and LAMEA are anticipated to provide great opportunities to the market during the forecast period. This is attributed to the existence of market players and unexplored market opportunities in nations such as the U.S. and UK.
Baby Care Products Market

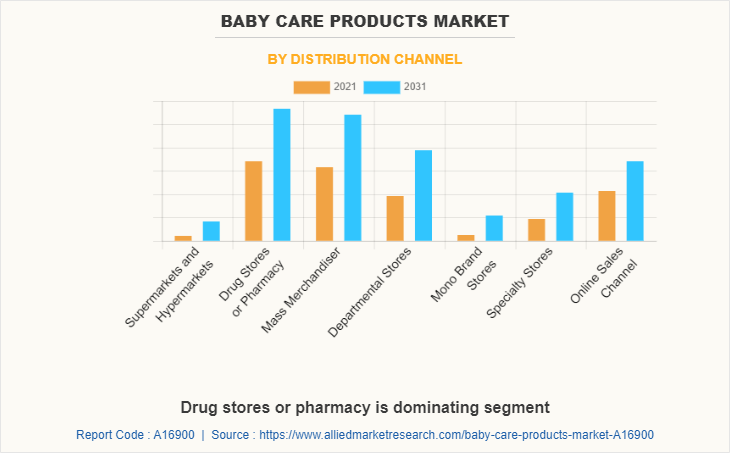
Consumers purchase baby care products by various distribution channels, including supermarkets & hypermarkets, specialty stores, online sales channel, and others. The online sales channel is growing at the highest rate, owing to benefits provided, such as discounts and free home delivery.
Baby Care Products Market

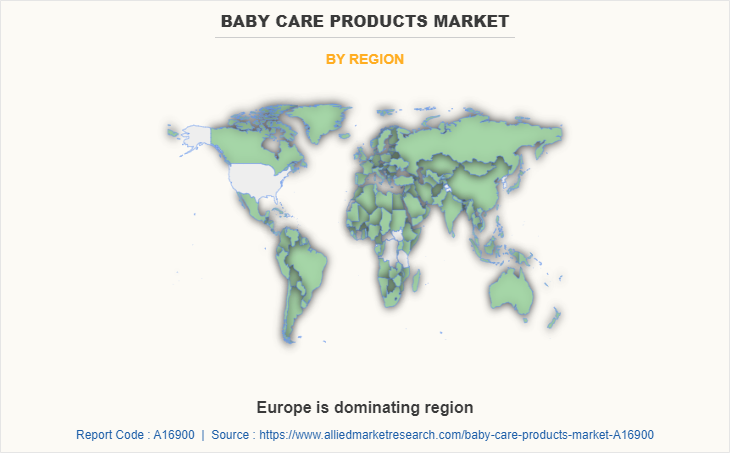
Region-wise, Europe dominates the market with largest baby care products market share during the baby care products market forecast period. Baby care products and their different varieties are the mostly purchased in Asia-Pacific, especially in Japan, India, and China. The preference for baby care products with different organic and natural ingredients changes with different geographical locations. In addition, the growing preference for nutritious and healthy baby food products as well as increase in demand for formula-based baby food and beverage products are driving the baby care products market growth in Asia-Pacific. The demand for baby care products in this region is expected to rise over the next few years as a result of rise in health and hygiene awareness, urbanization, rise in living standards, and rise in levels of disposable income.

The major players analyzed for the baby care products industry are Baby Brezza, Beiersdorf, California Baby, Cotton Babies Inc., Dorel Industries Inc., Helen of Troy Limited, Johnson & Johnson, Kimberly-Clark, Koninklijke Philips N.V., Munchkin, Inc., Nestle SA, Procter & Gamble (P&G), Sebapharma GmbH & Co. KG, and Unilever.

Key Benefits For Stakeholders

  • This report provides a quantitative analysis of the market segments, current trends, estimations, and dynamics of the baby care products market analysis from 2021 to 2031 to identify the prevailing baby care products market opportunities.
  • The market research is offered along with information related to key drivers, restraints, and opportunities.
  • Porter's five forces analysis highlights the potency of buyers and suppliers to enable stakeholders make profit-oriented business decisions and strengthen their supplier-buyer network.
  • In-depth analysis of the baby care products market segmentation assists to determine the prevailing market opportunities.
  • Major countries in each region are mapped according to their revenue contribution to the global market.
  • Market player positioning facilitates benchmarking and provides a clear understanding of the present position of the market players.
  • The report includes the analysis of the regional as well as global baby care products market trends, key players, market segments, application areas, and market growth strategies.


Baby Care Products Market Report Highlights

Aspects Details
Market Size By 2031 USD 58.8 billion
Growth Rate CAGR of 4.5%
Forecast period 2021 - 2031
Report Pages 305
By Products Type
  • Baby Skin Care
  • Baby Hair Care
  • Baby Food and Beverage
  • Others
By Price Point
  • Low
  • Medium
  • High
By Distribution Channel
  • Supermarkets and Hypermarkets
  • Drug Stores or Pharmacy
  • Mass Merchandiser
  • Departmental Stores
  • Mono Brand Stores
  • Specialty Stores
  • Online Sales Channel
By Region
  • North America  (U.S., Canada, Mexico)
  • Europe  (U.K., France, Netherlands, Germany, Turkey, Italy, Rest of Europe)
  • Asia-Pacific  (China, Japan, India, South Korea, Australia, Indonesia, Rest of Asia-Pacific)
  • LAMEA  (Brazil, South Africa, United Arab Emirates, Rest of LAMEA)
Key Market Players Procter & Gamble (P&G), kimberly-clark, Cotton Babies Inc., Nestle SA, Baby Brezza, Johnson & Johnson, California Baby, beiersdorf, Munchkin, Inc., sebapharma gmbh & co. kg

Analyst Review

According to the insights of CXOs of leading companies, the market for baby care products offers significant potential to market participants. Baby hygiene care has improved, birth rates have increased, and more women are working, all of which have helped the market expand. Many large corporations, including Johnson & Johnson Consumer Inc., make an effort to keep the amount of chemicals in their baby powder and shampoos to a minimum. To raise public awareness about diaper consumption, businesses like Kimberly Clark team up with diaper banks. To increase awareness of the advantages of infant toiletries and spur market expansion, major players in the industry are creating a variety of cutting-edge strategies.

CXOs further added that these firms have increased the market share of their baby food products by engaging in research and development activities and innovations to enhance the flavors and ingredients of baby food. Contrary to residents of semi-urban and urban areas, urban residents have started using packaged food goods in recent years. People's busy lifestyles have led them to use prepared baby food and newborn formula. The acceptance of baby food items has also been aided by the rising number of cases in which mothers struggle to nurse their children. Because packaged baby foods are now more widely available thanks to the expansion of media and other communication channels, people in rural and semi-urban regions have gradually begun to use them. Future development potential is quite strong for the prepared baby food and milk formula categories.

 
  • CHAPTER 1: INTRODUCTION

    • 1.1. Report description

    • 1.2. Key market segments

    • 1.3. Key benefits to the stakeholders

    • 1.4. Research Methodology

      • 1.4.1. Primary research

      • 1.4.2. Secondary research

      • 1.4.3. Analyst tools and models

  • CHAPTER 2: EXECUTIVE SUMMARY

    • 2.1. CXO Perspective

  • CHAPTER 3: MARKET OVERVIEW

    • 3.1. Market definition and scope

    • 3.2. Key findings

      • 3.2.1. Top impacting factors

      • 3.2.2. Top investment pockets

    • 3.3. Porter’s five forces analysis

      • 3.3.1. Moderate bargaining power of suppliers

      • 3.3.2. Moderate threat of new entrants

      • 3.3.3. High threat of substitutes

      • 3.3.4. Moderate intensity of rivalry

      • 3.3.5. Moderate bargaining power of buyers

    • 3.4. Market dynamics

      • 3.4.1. Drivers

        • 3.4.1.1. Growing preference for fortified baby food
        • 3.4.1.2. Rising health consciousness regarding babies
        • 3.4.1.3. Increased in penetration of online shopping

      • 3.4.2. Restraints

        • 3.4.2.1. Lack of awareness about baby care products among consumers
        • 3.4.2.2. Adverse effects of chemical products on babies

      • 3.4.3. Opportunities

        • 3.4.3.1. Surge in demand for organic and natural baby products
        • 3.4.3.2. Growing establishments of daycare centers

    • 3.5. COVID-19 Impact Analysis on the market

  • CHAPTER 4: BABY CARE PRODUCTS MARKET, BY PRODUCTS TYPE

    • 4.1. Overview

      • 4.1.1. Market size and forecast

    • 4.2. Baby Skin Care

      • 4.2.1. Key market trends, growth factors and opportunities

      • 4.2.2. Market size and forecast, by region

      • 4.2.3. Market share analysis by country

    • 4.3. Baby Hair Care

      • 4.3.1. Key market trends, growth factors and opportunities

      • 4.3.2. Market size and forecast, by region

      • 4.3.3. Market share analysis by country

    • 4.4. Baby Food and Beverage

      • 4.4.1. Key market trends, growth factors and opportunities

      • 4.4.2. Market size and forecast, by region

      • 4.4.3. Market share analysis by country

    • 4.5. Others

      • 4.5.1. Key market trends, growth factors and opportunities

      • 4.5.2. Market size and forecast, by region

      • 4.5.3. Market share analysis by country

  • CHAPTER 5: BABY CARE PRODUCTS MARKET, BY PRICE POINT

    • 5.1. Overview

      • 5.1.1. Market size and forecast

    • 5.2. Low

      • 5.2.1. Key market trends, growth factors and opportunities

      • 5.2.2. Market size and forecast, by region

      • 5.2.3. Market share analysis by country

    • 5.3. Medium

      • 5.3.1. Key market trends, growth factors and opportunities

      • 5.3.2. Market size and forecast, by region

      • 5.3.3. Market share analysis by country

    • 5.4. High

      • 5.4.1. Key market trends, growth factors and opportunities

      • 5.4.2. Market size and forecast, by region

      • 5.4.3. Market share analysis by country

  • CHAPTER 6: BABY CARE PRODUCTS MARKET, BY DISTRIBUTION CHANNEL

    • 6.1. Overview

      • 6.1.1. Market size and forecast

    • 6.2. Supermarkets and Hypermarkets

      • 6.2.1. Key market trends, growth factors and opportunities

      • 6.2.2. Market size and forecast, by region

      • 6.2.3. Market share analysis by country

    • 6.3. Drug Stores or Pharmacy

      • 6.3.1. Key market trends, growth factors and opportunities

      • 6.3.2. Market size and forecast, by region

      • 6.3.3. Market share analysis by country

    • 6.4. Mass Merchandiser

      • 6.4.1. Key market trends, growth factors and opportunities

      • 6.4.2. Market size and forecast, by region

      • 6.4.3. Market share analysis by country

    • 6.5. Departmental Stores

      • 6.5.1. Key market trends, growth factors and opportunities

      • 6.5.2. Market size and forecast, by region

      • 6.5.3. Market share analysis by country

    • 6.6. Mono Brand Stores

      • 6.6.1. Key market trends, growth factors and opportunities

      • 6.6.2. Market size and forecast, by region

      • 6.6.3. Market share analysis by country

    • 6.7. Specialty Stores

      • 6.7.1. Key market trends, growth factors and opportunities

      • 6.7.2. Market size and forecast, by region

      • 6.7.3. Market share analysis by country

    • 6.8. Online Sales Channel

      • 6.8.1. Key market trends, growth factors and opportunities

      • 6.8.2. Market size and forecast, by region

      • 6.8.3. Market share analysis by country

  • CHAPTER 7: BABY CARE PRODUCTS MARKET, BY REGION

    • 7.1. Overview

      • 7.1.1. Market size and forecast By Region

    • 7.2. North America

      • 7.2.1. Key trends and opportunities

      • 7.2.2. Market size and forecast, by Products Type

      • 7.2.3. Market size and forecast, by Price Point

      • 7.2.4. Market size and forecast, by Distribution Channel

      • 7.2.5. Market size and forecast, by country

        • 7.2.5.1. U.S.
          • 7.2.5.1.1. Key market trends, growth factors and opportunities
          • 7.2.5.1.2. Market size and forecast, by Products Type
          • 7.2.5.1.3. Market size and forecast, by Price Point
          • 7.2.5.1.4. Market size and forecast, by Distribution Channel
        • 7.2.5.2. Canada
          • 7.2.5.2.1. Key market trends, growth factors and opportunities
          • 7.2.5.2.2. Market size and forecast, by Products Type
          • 7.2.5.2.3. Market size and forecast, by Price Point
          • 7.2.5.2.4. Market size and forecast, by Distribution Channel
        • 7.2.5.3. Mexico
          • 7.2.5.3.1. Key market trends, growth factors and opportunities
          • 7.2.5.3.2. Market size and forecast, by Products Type
          • 7.2.5.3.3. Market size and forecast, by Price Point
          • 7.2.5.3.4. Market size and forecast, by Distribution Channel
    • 7.3. Europe

      • 7.3.1. Key trends and opportunities

      • 7.3.2. Market size and forecast, by Products Type

      • 7.3.3. Market size and forecast, by Price Point

      • 7.3.4. Market size and forecast, by Distribution Channel

      • 7.3.5. Market size and forecast, by country

        • 7.3.5.1. U.K.
          • 7.3.5.1.1. Key market trends, growth factors and opportunities
          • 7.3.5.1.2. Market size and forecast, by Products Type
          • 7.3.5.1.3. Market size and forecast, by Price Point
          • 7.3.5.1.4. Market size and forecast, by Distribution Channel
        • 7.3.5.2. France
          • 7.3.5.2.1. Key market trends, growth factors and opportunities
          • 7.3.5.2.2. Market size and forecast, by Products Type
          • 7.3.5.2.3. Market size and forecast, by Price Point
          • 7.3.5.2.4. Market size and forecast, by Distribution Channel
        • 7.3.5.3. Netherlands
          • 7.3.5.3.1. Key market trends, growth factors and opportunities
          • 7.3.5.3.2. Market size and forecast, by Products Type
          • 7.3.5.3.3. Market size and forecast, by Price Point
          • 7.3.5.3.4. Market size and forecast, by Distribution Channel
        • 7.3.5.4. Germany
          • 7.3.5.4.1. Key market trends, growth factors and opportunities
          • 7.3.5.4.2. Market size and forecast, by Products Type
          • 7.3.5.4.3. Market size and forecast, by Price Point
          • 7.3.5.4.4. Market size and forecast, by Distribution Channel
        • 7.3.5.5. Turkey
          • 7.3.5.5.1. Key market trends, growth factors and opportunities
          • 7.3.5.5.2. Market size and forecast, by Products Type
          • 7.3.5.5.3. Market size and forecast, by Price Point
          • 7.3.5.5.4. Market size and forecast, by Distribution Channel
        • 7.3.5.6. Italy
          • 7.3.5.6.1. Key market trends, growth factors and opportunities
          • 7.3.5.6.2. Market size and forecast, by Products Type
          • 7.3.5.6.3. Market size and forecast, by Price Point
          • 7.3.5.6.4. Market size and forecast, by Distribution Channel
        • 7.3.5.7. Rest of Europe
          • 7.3.5.7.1. Key market trends, growth factors and opportunities
          • 7.3.5.7.2. Market size and forecast, by Products Type
          • 7.3.5.7.3. Market size and forecast, by Price Point
          • 7.3.5.7.4. Market size and forecast, by Distribution Channel
    • 7.4. Asia-Pacific

      • 7.4.1. Key trends and opportunities

      • 7.4.2. Market size and forecast, by Products Type

      • 7.4.3. Market size and forecast, by Price Point

      • 7.4.4. Market size and forecast, by Distribution Channel

      • 7.4.5. Market size and forecast, by country

        • 7.4.5.1. China
          • 7.4.5.1.1. Key market trends, growth factors and opportunities
          • 7.4.5.1.2. Market size and forecast, by Products Type
          • 7.4.5.1.3. Market size and forecast, by Price Point
          • 7.4.5.1.4. Market size and forecast, by Distribution Channel
        • 7.4.5.2. Japan
          • 7.4.5.2.1. Key market trends, growth factors and opportunities
          • 7.4.5.2.2. Market size and forecast, by Products Type
          • 7.4.5.2.3. Market size and forecast, by Price Point
          • 7.4.5.2.4. Market size and forecast, by Distribution Channel
        • 7.4.5.3. India
          • 7.4.5.3.1. Key market trends, growth factors and opportunities
          • 7.4.5.3.2. Market size and forecast, by Products Type
          • 7.4.5.3.3. Market size and forecast, by Price Point
          • 7.4.5.3.4. Market size and forecast, by Distribution Channel
        • 7.4.5.4. South Korea
          • 7.4.5.4.1. Key market trends, growth factors and opportunities
          • 7.4.5.4.2. Market size and forecast, by Products Type
          • 7.4.5.4.3. Market size and forecast, by Price Point
          • 7.4.5.4.4. Market size and forecast, by Distribution Channel
        • 7.4.5.5. Australia
          • 7.4.5.5.1. Key market trends, growth factors and opportunities
          • 7.4.5.5.2. Market size and forecast, by Products Type
          • 7.4.5.5.3. Market size and forecast, by Price Point
          • 7.4.5.5.4. Market size and forecast, by Distribution Channel
        • 7.4.5.6. Indonesia
          • 7.4.5.6.1. Key market trends, growth factors and opportunities
          • 7.4.5.6.2. Market size and forecast, by Products Type
          • 7.4.5.6.3. Market size and forecast, by Price Point
          • 7.4.5.6.4. Market size and forecast, by Distribution Channel
        • 7.4.5.7. Rest of Asia-Pacific
          • 7.4.5.7.1. Key market trends, growth factors and opportunities
          • 7.4.5.7.2. Market size and forecast, by Products Type
          • 7.4.5.7.3. Market size and forecast, by Price Point
          • 7.4.5.7.4. Market size and forecast, by Distribution Channel
    • 7.5. LAMEA

      • 7.5.1. Key trends and opportunities

      • 7.5.2. Market size and forecast, by Products Type

      • 7.5.3. Market size and forecast, by Price Point

      • 7.5.4. Market size and forecast, by Distribution Channel

      • 7.5.5. Market size and forecast, by country

        • 7.5.5.1. Brazil
          • 7.5.5.1.1. Key market trends, growth factors and opportunities
          • 7.5.5.1.2. Market size and forecast, by Products Type
          • 7.5.5.1.3. Market size and forecast, by Price Point
          • 7.5.5.1.4. Market size and forecast, by Distribution Channel
        • 7.5.5.2. South Africa
          • 7.5.5.2.1. Key market trends, growth factors and opportunities
          • 7.5.5.2.2. Market size and forecast, by Products Type
          • 7.5.5.2.3. Market size and forecast, by Price Point
          • 7.5.5.2.4. Market size and forecast, by Distribution Channel
        • 7.5.5.3. United Arab Emirates
          • 7.5.5.3.1. Key market trends, growth factors and opportunities
          • 7.5.5.3.2. Market size and forecast, by Products Type
          • 7.5.5.3.3. Market size and forecast, by Price Point
          • 7.5.5.3.4. Market size and forecast, by Distribution Channel
        • 7.5.5.4. Rest of LAMEA
          • 7.5.5.4.1. Key market trends, growth factors and opportunities
          • 7.5.5.4.2. Market size and forecast, by Products Type
          • 7.5.5.4.3. Market size and forecast, by Price Point
          • 7.5.5.4.4. Market size and forecast, by Distribution Channel
  • CHAPTER 8: COMPETITIVE LANDSCAPE

    • 8.1. Introduction

    • 8.2. Top winning strategies

    • 8.3. Product Mapping of Top 10 Player

    • 8.4. Competitive Dashboard

    • 8.5. Competitive Heatmap

    • 8.6. Top player positioning, 2021

  • CHAPTER 9: COMPANY PROFILES

    • 9.1. Baby Brezza

      • 9.1.1. Company overview

      • 9.1.2. Key Executives

      • 9.1.3. Company snapshot

      • 9.1.4. Operating business segments

      • 9.1.5. Product portfolio

    • 9.2. beiersdorf

      • 9.2.1. Company overview

      • 9.2.2. Key Executives

      • 9.2.3. Company snapshot

      • 9.2.4. Operating business segments

      • 9.2.5. Product portfolio

      • 9.2.6. Business performance

      • 9.2.7. Key strategic moves and developments

    • 9.3. California Baby

      • 9.3.1. Company overview

      • 9.3.2. Key Executives

      • 9.3.3. Company snapshot

      • 9.3.4. Operating business segments

      • 9.3.5. Product portfolio

    • 9.4. Cotton Babies Inc.

      • 9.4.1. Company overview

      • 9.4.2. Key Executives

      • 9.4.3. Company snapshot

      • 9.4.4. Operating business segments

      • 9.4.5. Product portfolio

    • 9.5. Johnson & Johnson

      • 9.5.1. Company overview

      • 9.5.2. Key Executives

      • 9.5.3. Company snapshot

      • 9.5.4. Operating business segments

      • 9.5.5. Product portfolio

      • 9.5.6. Business performance

    • 9.6. kimberly-clark

      • 9.6.1. Company overview

      • 9.6.2. Key Executives

      • 9.6.3. Company snapshot

      • 9.6.4. Operating business segments

      • 9.6.5. Product portfolio

    • 9.7. Munchkin, Inc.

      • 9.7.1. Company overview

      • 9.7.2. Key Executives

      • 9.7.3. Company snapshot

      • 9.7.4. Operating business segments

      • 9.7.5. Product portfolio

    • 9.8. Nestle SA

      • 9.8.1. Company overview

      • 9.8.2. Key Executives

      • 9.8.3. Company snapshot

      • 9.8.4. Operating business segments

      • 9.8.5. Product portfolio

      • 9.8.6. Key strategic moves and developments

    • 9.9. Procter & Gamble (P&G)

      • 9.9.1. Company overview

      • 9.9.2. Key Executives

      • 9.9.3. Company snapshot

      • 9.9.4. Operating business segments

      • 9.9.5. Product portfolio

    • 9.10. sebapharma gmbh & co. kg

      • 9.10.1. Company overview

      • 9.10.2. Key Executives

      • 9.10.3. Company snapshot

      • 9.10.4. Operating business segments

      • 9.10.5. Product portfolio

      • 9.10.6. Key strategic moves and developments

  • LIST OF TABLES

  • TABLE 01. GLOBAL BABY CARE PRODUCTS MARKET, BY PRODUCTS TYPE, 2021-2031 ($MILLION)
    TABLE 02. BABY CARE PRODUCTS MARKET FOR BABY SKIN CARE, BY REGION, 2021-2031 ($MILLION)
    TABLE 03. BABY CARE PRODUCTS MARKET FOR BABY HAIR CARE, BY REGION, 2021-2031 ($MILLION)
    TABLE 04. BABY CARE PRODUCTS MARKET FOR BABY FOOD AND BEVERAGE, BY REGION, 2021-2031 ($MILLION)
    TABLE 05. BABY CARE PRODUCTS MARKET FOR OTHERS, BY REGION, 2021-2031 ($MILLION)
    TABLE 06. GLOBAL BABY CARE PRODUCTS MARKET, BY PRICE POINT, 2021-2031 ($MILLION)
    TABLE 07. BABY CARE PRODUCTS MARKET FOR LOW, BY REGION, 2021-2031 ($MILLION)
    TABLE 08. BABY CARE PRODUCTS MARKET FOR MEDIUM, BY REGION, 2021-2031 ($MILLION)
    TABLE 09. BABY CARE PRODUCTS MARKET FOR HIGH, BY REGION, 2021-2031 ($MILLION)
    TABLE 10. GLOBAL BABY CARE PRODUCTS MARKET, BY DISTRIBUTION CHANNEL, 2021-2031 ($MILLION)
    TABLE 11. BABY CARE PRODUCTS MARKET FOR SUPERMARKETS AND HYPERMARKETS, BY REGION, 2021-2031 ($MILLION)
    TABLE 12. BABY CARE PRODUCTS MARKET FOR DRUG STORES OR PHARMACY, BY REGION, 2021-2031 ($MILLION)
    TABLE 13. BABY CARE PRODUCTS MARKET FOR MASS MERCHANDISER, BY REGION, 2021-2031 ($MILLION)
    TABLE 14. BABY CARE PRODUCTS MARKET FOR DEPARTMENTAL STORES, BY REGION, 2021-2031 ($MILLION)
    TABLE 15. BABY CARE PRODUCTS MARKET FOR MONO BRAND STORES, BY REGION, 2021-2031 ($MILLION)
    TABLE 16. BABY CARE PRODUCTS MARKET FOR SPECIALTY STORES, BY REGION, 2021-2031 ($MILLION)
    TABLE 17. BABY CARE PRODUCTS MARKET FOR ONLINE SALES CHANNEL, BY REGION, 2021-2031 ($MILLION)
    TABLE 18. BABY CARE PRODUCTS MARKET, BY REGION, 2021-2031 ($MILLION)
    TABLE 19. NORTH AMERICA BABY CARE PRODUCTS MARKET, BY PRODUCTS TYPE, 2021-2031 ($MILLION)
    TABLE 20. NORTH AMERICA BABY CARE PRODUCTS MARKET, BY PRICE POINT, 2021-2031 ($MILLION)
    TABLE 21. NORTH AMERICA BABY CARE PRODUCTS MARKET, BY DISTRIBUTION CHANNEL, 2021-2031 ($MILLION)
    TABLE 22. NORTH AMERICA BABY CARE PRODUCTS MARKET, BY COUNTRY, 2021-2031 ($MILLION)
    TABLE 23. U.S. BABY CARE PRODUCTS MARKET, BY PRODUCTS TYPE, 2021-2031 ($MILLION)
    TABLE 24. U.S. BABY CARE PRODUCTS MARKET, BY PRICE POINT, 2021-2031 ($MILLION)
    TABLE 25. U.S. BABY CARE PRODUCTS MARKET, BY DISTRIBUTION CHANNEL, 2021-2031 ($MILLION)
    TABLE 26. CANADA BABY CARE PRODUCTS MARKET, BY PRODUCTS TYPE, 2021-2031 ($MILLION)
    TABLE 27. CANADA BABY CARE PRODUCTS MARKET, BY PRICE POINT, 2021-2031 ($MILLION)
    TABLE 28. CANADA BABY CARE PRODUCTS MARKET, BY DISTRIBUTION CHANNEL, 2021-2031 ($MILLION)
    TABLE 29. MEXICO BABY CARE PRODUCTS MARKET, BY PRODUCTS TYPE, 2021-2031 ($MILLION)
    TABLE 30. MEXICO BABY CARE PRODUCTS MARKET, BY PRICE POINT, 2021-2031 ($MILLION)
    TABLE 31. MEXICO BABY CARE PRODUCTS MARKET, BY DISTRIBUTION CHANNEL, 2021-2031 ($MILLION)
    TABLE 32. EUROPE BABY CARE PRODUCTS MARKET, BY PRODUCTS TYPE, 2021-2031 ($MILLION)
    TABLE 33. EUROPE BABY CARE PRODUCTS MARKET, BY PRICE POINT, 2021-2031 ($MILLION)
    TABLE 34. EUROPE BABY CARE PRODUCTS MARKET, BY DISTRIBUTION CHANNEL, 2021-2031 ($MILLION)
    TABLE 35. EUROPE BABY CARE PRODUCTS MARKET, BY COUNTRY, 2021-2031 ($MILLION)
    TABLE 36. U.K. BABY CARE PRODUCTS MARKET, BY PRODUCTS TYPE, 2021-2031 ($MILLION)
    TABLE 37. U.K. BABY CARE PRODUCTS MARKET, BY PRICE POINT, 2021-2031 ($MILLION)
    TABLE 38. U.K. BABY CARE PRODUCTS MARKET, BY DISTRIBUTION CHANNEL, 2021-2031 ($MILLION)
    TABLE 39. FRANCE BABY CARE PRODUCTS MARKET, BY PRODUCTS TYPE, 2021-2031 ($MILLION)
    TABLE 40. FRANCE BABY CARE PRODUCTS MARKET, BY PRICE POINT, 2021-2031 ($MILLION)
    TABLE 41. FRANCE BABY CARE PRODUCTS MARKET, BY DISTRIBUTION CHANNEL, 2021-2031 ($MILLION)
    TABLE 42. NETHERLANDS BABY CARE PRODUCTS MARKET, BY PRODUCTS TYPE, 2021-2031 ($MILLION)
    TABLE 43. NETHERLANDS BABY CARE PRODUCTS MARKET, BY PRICE POINT, 2021-2031 ($MILLION)
    TABLE 44. NETHERLANDS BABY CARE PRODUCTS MARKET, BY DISTRIBUTION CHANNEL, 2021-2031 ($MILLION)
    TABLE 45. GERMANY BABY CARE PRODUCTS MARKET, BY PRODUCTS TYPE, 2021-2031 ($MILLION)
    TABLE 46. GERMANY BABY CARE PRODUCTS MARKET, BY PRICE POINT, 2021-2031 ($MILLION)
    TABLE 47. GERMANY BABY CARE PRODUCTS MARKET, BY DISTRIBUTION CHANNEL, 2021-2031 ($MILLION)
    TABLE 48. TURKEY BABY CARE PRODUCTS MARKET, BY PRODUCTS TYPE, 2021-2031 ($MILLION)
    TABLE 49. TURKEY BABY CARE PRODUCTS MARKET, BY PRICE POINT, 2021-2031 ($MILLION)
    TABLE 50. TURKEY BABY CARE PRODUCTS MARKET, BY DISTRIBUTION CHANNEL, 2021-2031 ($MILLION)
    TABLE 51. ITALY BABY CARE PRODUCTS MARKET, BY PRODUCTS TYPE, 2021-2031 ($MILLION)
    TABLE 52. ITALY BABY CARE PRODUCTS MARKET, BY PRICE POINT, 2021-2031 ($MILLION)
    TABLE 53. ITALY BABY CARE PRODUCTS MARKET, BY DISTRIBUTION CHANNEL, 2021-2031 ($MILLION)
    TABLE 54. REST OF EUROPE BABY CARE PRODUCTS MARKET, BY PRODUCTS TYPE, 2021-2031 ($MILLION)
    TABLE 55. REST OF EUROPE BABY CARE PRODUCTS MARKET, BY PRICE POINT, 2021-2031 ($MILLION)
    TABLE 56. REST OF EUROPE BABY CARE PRODUCTS MARKET, BY DISTRIBUTION CHANNEL, 2021-2031 ($MILLION)
    TABLE 57. ASIA-PACIFIC BABY CARE PRODUCTS MARKET, BY PRODUCTS TYPE, 2021-2031 ($MILLION)
    TABLE 58. ASIA-PACIFIC BABY CARE PRODUCTS MARKET, BY PRICE POINT, 2021-2031 ($MILLION)
    TABLE 59. ASIA-PACIFIC BABY CARE PRODUCTS MARKET, BY DISTRIBUTION CHANNEL, 2021-2031 ($MILLION)
    TABLE 60. ASIA-PACIFIC BABY CARE PRODUCTS MARKET, BY COUNTRY, 2021-2031 ($MILLION)
    TABLE 61. CHINA BABY CARE PRODUCTS MARKET, BY PRODUCTS TYPE, 2021-2031 ($MILLION)
    TABLE 62. CHINA BABY CARE PRODUCTS MARKET, BY PRICE POINT, 2021-2031 ($MILLION)
    TABLE 63. CHINA BABY CARE PRODUCTS MARKET, BY DISTRIBUTION CHANNEL, 2021-2031 ($MILLION)
    TABLE 64. JAPAN BABY CARE PRODUCTS MARKET, BY PRODUCTS TYPE, 2021-2031 ($MILLION)
    TABLE 65. JAPAN BABY CARE PRODUCTS MARKET, BY PRICE POINT, 2021-2031 ($MILLION)
    TABLE 66. JAPAN BABY CARE PRODUCTS MARKET, BY DISTRIBUTION CHANNEL, 2021-2031 ($MILLION)
    TABLE 67. INDIA BABY CARE PRODUCTS MARKET, BY PRODUCTS TYPE, 2021-2031 ($MILLION)
    TABLE 68. INDIA BABY CARE PRODUCTS MARKET, BY PRICE POINT, 2021-2031 ($MILLION)
    TABLE 69. INDIA BABY CARE PRODUCTS MARKET, BY DISTRIBUTION CHANNEL, 2021-2031 ($MILLION)
    TABLE 70. SOUTH KOREA BABY CARE PRODUCTS MARKET, BY PRODUCTS TYPE, 2021-2031 ($MILLION)
    TABLE 71. SOUTH KOREA BABY CARE PRODUCTS MARKET, BY PRICE POINT, 2021-2031 ($MILLION)
    TABLE 72. SOUTH KOREA BABY CARE PRODUCTS MARKET, BY DISTRIBUTION CHANNEL, 2021-2031 ($MILLION)
    TABLE 73. AUSTRALIA BABY CARE PRODUCTS MARKET, BY PRODUCTS TYPE, 2021-2031 ($MILLION)
    TABLE 74. AUSTRALIA BABY CARE PRODUCTS MARKET, BY PRICE POINT, 2021-2031 ($MILLION)
    TABLE 75. AUSTRALIA BABY CARE PRODUCTS MARKET, BY DISTRIBUTION CHANNEL, 2021-2031 ($MILLION)
    TABLE 76. INDONESIA BABY CARE PRODUCTS MARKET, BY PRODUCTS TYPE, 2021-2031 ($MILLION)
    TABLE 77. INDONESIA BABY CARE PRODUCTS MARKET, BY PRICE POINT, 2021-2031 ($MILLION)
    TABLE 78. INDONESIA BABY CARE PRODUCTS MARKET, BY DISTRIBUTION CHANNEL, 2021-2031 ($MILLION)
    TABLE 79. REST OF ASIA-PACIFIC BABY CARE PRODUCTS MARKET, BY PRODUCTS TYPE, 2021-2031 ($MILLION)
    TABLE 80. REST OF ASIA-PACIFIC BABY CARE PRODUCTS MARKET, BY PRICE POINT, 2021-2031 ($MILLION)
    TABLE 81. REST OF ASIA-PACIFIC BABY CARE PRODUCTS MARKET, BY DISTRIBUTION CHANNEL, 2021-2031 ($MILLION)
    TABLE 82. LAMEA BABY CARE PRODUCTS MARKET, BY PRODUCTS TYPE, 2021-2031 ($MILLION)
    TABLE 83. LAMEA BABY CARE PRODUCTS MARKET, BY PRICE POINT, 2021-2031 ($MILLION)
    TABLE 84. LAMEA BABY CARE PRODUCTS MARKET, BY DISTRIBUTION CHANNEL, 2021-2031 ($MILLION)
    TABLE 85. LAMEA BABY CARE PRODUCTS MARKET, BY COUNTRY, 2021-2031 ($MILLION)
    TABLE 86. BRAZIL BABY CARE PRODUCTS MARKET, BY PRODUCTS TYPE, 2021-2031 ($MILLION)
    TABLE 87. BRAZIL BABY CARE PRODUCTS MARKET, BY PRICE POINT, 2021-2031 ($MILLION)
    TABLE 88. BRAZIL BABY CARE PRODUCTS MARKET, BY DISTRIBUTION CHANNEL, 2021-2031 ($MILLION)
    TABLE 89. SOUTH AFRICA BABY CARE PRODUCTS MARKET, BY PRODUCTS TYPE, 2021-2031 ($MILLION)
    TABLE 90. SOUTH AFRICA BABY CARE PRODUCTS MARKET, BY PRICE POINT, 2021-2031 ($MILLION)
    TABLE 91. SOUTH AFRICA BABY CARE PRODUCTS MARKET, BY DISTRIBUTION CHANNEL, 2021-2031 ($MILLION)
    TABLE 92. UNITED ARAB EMIRATES BABY CARE PRODUCTS MARKET, BY PRODUCTS TYPE, 2021-2031 ($MILLION)
    TABLE 93. UNITED ARAB EMIRATES BABY CARE PRODUCTS MARKET, BY PRICE POINT, 2021-2031 ($MILLION)
    TABLE 94. UNITED ARAB EMIRATES BABY CARE PRODUCTS MARKET, BY DISTRIBUTION CHANNEL, 2021-2031 ($MILLION)
    TABLE 95. REST OF LAMEA BABY CARE PRODUCTS MARKET, BY PRODUCTS TYPE, 2021-2031 ($MILLION)
    TABLE 96. REST OF LAMEA BABY CARE PRODUCTS MARKET, BY PRICE POINT, 2021-2031 ($MILLION)
    TABLE 97. REST OF LAMEA BABY CARE PRODUCTS MARKET, BY DISTRIBUTION CHANNEL, 2021-2031 ($MILLION)
    TABLE 98. BABY BREZZA: KEY EXECUTIVES
    TABLE 99. BABY BREZZA: COMPANY SNAPSHOT
    TABLE 100. BABY BREZZA: PRODUCT SEGMENTS
    TABLE 101. BABY BREZZA: PRODUCT PORTFOLIO
    TABLE 102. BEIERSDORF: KEY EXECUTIVES
    TABLE 103. BEIERSDORF: COMPANY SNAPSHOT
    TABLE 104. BEIERSDORF: PRODUCT SEGMENTS
    TABLE 105. BEIERSDORF: PRODUCT PORTFOLIO
    TABLE 106. BEIERSDORF: KEY STRATERGIES
    TABLE 107. CALIFORNIA BABY: KEY EXECUTIVES
    TABLE 108. CALIFORNIA BABY: COMPANY SNAPSHOT
    TABLE 109. CALIFORNIA BABY: PRODUCT SEGMENTS
    TABLE 110. CALIFORNIA BABY: PRODUCT PORTFOLIO
    TABLE 111. COTTON BABIES INC.: KEY EXECUTIVES
    TABLE 112. COTTON BABIES INC.: COMPANY SNAPSHOT
    TABLE 113. COTTON BABIES INC.: PRODUCT SEGMENTS
    TABLE 114. COTTON BABIES INC.: PRODUCT PORTFOLIO
    TABLE 115. JOHNSON & JOHNSON: KEY EXECUTIVES
    TABLE 116. JOHNSON & JOHNSON: COMPANY SNAPSHOT
    TABLE 117. JOHNSON & JOHNSON: PRODUCT SEGMENTS
    TABLE 118. JOHNSON & JOHNSON: PRODUCT PORTFOLIO
    TABLE 119. KIMBERLY-CLARK: KEY EXECUTIVES
    TABLE 120. KIMBERLY-CLARK: COMPANY SNAPSHOT
    TABLE 121. KIMBERLY-CLARK: PRODUCT SEGMENTS
    TABLE 122. KIMBERLY-CLARK: PRODUCT PORTFOLIO
    TABLE 123. MUNCHKIN, INC.: KEY EXECUTIVES
    TABLE 124. MUNCHKIN, INC.: COMPANY SNAPSHOT
    TABLE 125. MUNCHKIN, INC.: PRODUCT SEGMENTS
    TABLE 126. MUNCHKIN, INC.: PRODUCT PORTFOLIO
    TABLE 127. NESTLE SA: KEY EXECUTIVES
    TABLE 128. NESTLE SA: COMPANY SNAPSHOT
    TABLE 129. NESTLE SA: PRODUCT SEGMENTS
    TABLE 130. NESTLE SA: PRODUCT PORTFOLIO
    TABLE 131. NESTLE SA: KEY STRATERGIES
    TABLE 132. PROCTER & GAMBLE (P&G): KEY EXECUTIVES
    TABLE 133. PROCTER & GAMBLE (P&G): COMPANY SNAPSHOT
    TABLE 134. PROCTER & GAMBLE (P&G): PRODUCT SEGMENTS
    TABLE 135. PROCTER & GAMBLE (P&G): PRODUCT PORTFOLIO
    TABLE 136. SEBAPHARMA GMBH & CO. KG: KEY EXECUTIVES
    TABLE 137. SEBAPHARMA GMBH & CO. KG: COMPANY SNAPSHOT
    TABLE 138. SEBAPHARMA GMBH & CO. KG: PRODUCT SEGMENTS
    TABLE 139. SEBAPHARMA GMBH & CO. KG: PRODUCT PORTFOLIO
    TABLE 140. SEBAPHARMA GMBH & CO. KG: KEY STRATERGIES
  • LIST OF FIGURES

  • FIGURE 1.BABY CARE PRODUCTS MARKET SEGMENTATION
    FIGURE 2.BABY CARE PRODUCTS MARKET,2021-2031
    FIGURE 3.BABY CARE PRODUCTS MARKET,2021-2031
    FIGURE 4. TOP INVESTMENT POCKETS, BY REGION
    FIGURE 5.PORTER FIVE-1
    FIGURE 6.PORTER FIVE-2
    FIGURE 7.PORTER FIVE-3
    FIGURE 8.PORTER FIVE-4
    FIGURE 9.PORTER FIVE-5
    FIGURE 10.TOP PLAYER POSITIONING
    FIGURE 11.BABY CARE PRODUCTS MARKET:DRIVERS, RESTRAINTS AND OPPORTUNITIES
    FIGURE 12.BABY CARE PRODUCTS MARKET,BY PRODUCTS TYPE,2021(%)
    FIGURE 13.COMPARATIVE SHARE ANALYSIS OF BABY SKIN CARE BABY CARE PRODUCTS MARKET,2021-2031(%)
    FIGURE 14.COMPARATIVE SHARE ANALYSIS OF BABY HAIR CARE BABY CARE PRODUCTS MARKET,2021-2031(%)
    FIGURE 15.COMPARATIVE SHARE ANALYSIS OF BABY FOOD AND BEVERAGE BABY CARE PRODUCTS MARKET,2021-2031(%)
    FIGURE 16.COMPARATIVE SHARE ANALYSIS OF OTHERS BABY CARE PRODUCTS MARKET,2021-2031(%)
    FIGURE 17.BABY CARE PRODUCTS MARKET,BY PRICE POINT,2021(%)
    FIGURE 18.COMPARATIVE SHARE ANALYSIS OF LOW BABY CARE PRODUCTS MARKET,2021-2031(%)
    FIGURE 19.COMPARATIVE SHARE ANALYSIS OF MEDIUM BABY CARE PRODUCTS MARKET,2021-2031(%)
    FIGURE 20.COMPARATIVE SHARE ANALYSIS OF HIGH BABY CARE PRODUCTS MARKET,2021-2031(%)
    FIGURE 21.BABY CARE PRODUCTS MARKET,BY DISTRIBUTION CHANNEL,2021(%)
    FIGURE 22.COMPARATIVE SHARE ANALYSIS OF SUPERMARKETS AND HYPERMARKETS BABY CARE PRODUCTS MARKET,2021-2031(%)
    FIGURE 23.COMPARATIVE SHARE ANALYSIS OF DRUG STORES OR PHARMACY BABY CARE PRODUCTS MARKET,2021-2031(%)
    FIGURE 24.COMPARATIVE SHARE ANALYSIS OF MASS MERCHANDISER BABY CARE PRODUCTS MARKET,2021-2031(%)
    FIGURE 25.COMPARATIVE SHARE ANALYSIS OF DEPARTMENTAL STORES BABY CARE PRODUCTS MARKET,2021-2031(%)
    FIGURE 26.COMPARATIVE SHARE ANALYSIS OF MONO BRAND STORES BABY CARE PRODUCTS MARKET,2021-2031(%)
    FIGURE 27.COMPARATIVE SHARE ANALYSIS OF SPECIALTY STORES BABY CARE PRODUCTS MARKET,2021-2031(%)
    FIGURE 28.COMPARATIVE SHARE ANALYSIS OF ONLINE SALES CHANNEL BABY CARE PRODUCTS MARKET,2021-2031(%)
    FIGURE 29.BABY CARE PRODUCTS MARKET BY REGION,2021
    FIGURE 30.U.S. BABY CARE PRODUCTS MARKET,2021-2031($MILLION)
    FIGURE 31.CANADA BABY CARE PRODUCTS MARKET,2021-2031($MILLION)
    FIGURE 32.MEXICO BABY CARE PRODUCTS MARKET,2021-2031($MILLION)
    FIGURE 33.U.K. BABY CARE PRODUCTS MARKET,2021-2031($MILLION)
    FIGURE 34.FRANCE BABY CARE PRODUCTS MARKET,2021-2031($MILLION)
    FIGURE 35.NETHERLANDS BABY CARE PRODUCTS MARKET,2021-2031($MILLION)
    FIGURE 36.GERMANY BABY CARE PRODUCTS MARKET,2021-2031($MILLION)
    FIGURE 37.TURKEY BABY CARE PRODUCTS MARKET,2021-2031($MILLION)
    FIGURE 38.ITALY BABY CARE PRODUCTS MARKET,2021-2031($MILLION)
    FIGURE 39.REST OF EUROPE BABY CARE PRODUCTS MARKET,2021-2031($MILLION)
    FIGURE 40.CHINA BABY CARE PRODUCTS MARKET,2021-2031($MILLION)
    FIGURE 41.JAPAN BABY CARE PRODUCTS MARKET,2021-2031($MILLION)
    FIGURE 42.INDIA BABY CARE PRODUCTS MARKET,2021-2031($MILLION)
    FIGURE 43.SOUTH KOREA BABY CARE PRODUCTS MARKET,2021-2031($MILLION)
    FIGURE 44.AUSTRALIA BABY CARE PRODUCTS MARKET,2021-2031($MILLION)
    FIGURE 45.INDONESIA BABY CARE PRODUCTS MARKET,2021-2031($MILLION)
    FIGURE 46.REST OF ASIA-PACIFIC BABY CARE PRODUCTS MARKET,2021-2031($MILLION)
    FIGURE 47.BRAZIL BABY CARE PRODUCTS MARKET,2021-2031($MILLION)
    FIGURE 48.SOUTH AFRICA BABY CARE PRODUCTS MARKET,2021-2031($MILLION)
    FIGURE 49.UNITED ARAB EMIRATES BABY CARE PRODUCTS MARKET,2021-2031($MILLION)
    FIGURE 50.REST OF LAMEA BABY CARE PRODUCTS MARKET,2021-2031($MILLION)
    FIGURE 51. TOP WINNING STRATEGIES, BY YEAR
    FIGURE 52. TOP WINNING STRATEGIES, BY DEVELOPMENT
    FIGURE 53. TOP WINNING STRATEGIES, BY COMPANY
    FIGURE 54.PRODUCT MAPPING OF TOP 10 PLAYERS
    FIGURE 55.COMPETITIVE DASHBOARD
    FIGURE 56.COMPETITIVE HEATMAP OF TOP 10 KEY PLAYERS
    FIGURE 57.BABY BREZZA.: NET SALES ,($MILLION)
    FIGURE 58.BEIERSDORF.: NET SALES ,($MILLION)
    FIGURE 59.CALIFORNIA BABY.: NET SALES ,($MILLION)
    FIGURE 60.COTTON BABIES INC..: NET SALES ,($MILLION)
    FIGURE 61.DOREL INDUSTRIES INC..: NET SALES ,($MILLION)
    FIGURE 62.HELEN OF TROY LIMITED.: NET SALES ,($MILLION)
    FIGURE 63.JOHNSON & JOHNSON.: NET SALES ,($MILLION)
    FIGURE 64.KIMBERLY-CLARK.: NET SALES ,($MILLION)
    FIGURE 65.KONINKLIJKE PHILIPS N.V..: NET SALES ,($MILLION)
    FIGURE 66.MUNCHKIN, INC..: NET SALES ,($MILLION)
    FIGURE 67.NESTLE SA.: NET SALES ,($MILLION)
    FIGURE 68.PROCTER & GAMBLE (P&G).: NET SALES ,($MILLION)
    FIGURE 69.UNILEVER.: NET SALES ,($MILLION)
    FIGURE 70.SEBAPHARMA GMBH & CO. KG.: NET SALES ,($MILLION)


PURCHASE OPTIONS

Call or Email us

U.S.-Canada Toll-free: +1-800-792-5285
Int'l : +1-503-894-6022
Europe : +44-845-528-1300
Email : help@alliedmarketresearch.com
 
FREQUENTLY ASKED QUESTIONS?

A. The global baby care products market size was valued at $38,050.0 million in 2021, and is projected to reach $58,766.1 million by 2031, registering a CAGR of 4.5% from 2022 to 2031.

A. The forecast period in the baby care products market report is 2022 to 2031.

A. The base year calculated in the baby care products market report is 2021.

A. The market value of the baby care products market in 2021 was $38,050.0 million.

A. The baby hair care segment is the most influential segment in the baby care products market report.

A. Europe holds the maximum market share of the baby care products market.

A. The top companies analyzed for global baby care products market report are Baby Brezza, Beiersdorf, California Baby, Cotton Babies Inc., Dorel Industries Inc., Helen of Troy Limited, Johnson & Johnson, Kimberly-Clark, Koninklijke Philips N.V., Munchkin, Inc., Nestle SA, Procter & Gamble (P&G), Sebapharma GmbH & Co. KG, and Unilever.

A. The company profile has been selected on the basis of key developments such as partnership, product launch, merger and acquisition.

Looking for Customization?

 Customization Request

Have a Question?

 Speak with Analyst

Any Confusion?

 Inquire Before Buying

Have a glance of the Report

  Request Sample
RELATED TAGS

Purchase Full Report of
Baby Care Products Market

Start reading instantly.
This Report and over 66,905+ more Reports, Available with Avenue Library. T&C*.

  • Online Only
  • $3,570
  • Online cloud access only
  • Restricted print, copy, paste & download
  • Read only
  • Free industry update
    (Within 180 days)
  • Free report update in next update cycle
    (Jul 2023 - Jul 2024)
  • Data Pack
  • $3,840
  • Restricted to one authorized user
  • One print only
  • Available in
    Excel
  • Free industry update
    (Within 180 days)
  •   Free report update in next update cycle
    (Jul 2023 - Jul 2024)
  • Single User
  • $5,730
  • Restricted to one authorized user
  • One print only
  • Available in
    PDF
  • Free industry update
    (Within 180 days)
  •   Free report update in next update cycle
    (Jul 2023 - Jul 2024)
  • Five Users
  • $6,450
  • Limited to five authorized users
  • Print upto five copies
  • Available in
    PDF
  • Free industry update
    (Within 180 days)
  •   Free report update in next update cycle
    (Jul 2023 - Jul 2024)
  • Enterprise
    License/PDF

  • $9,600
  • Unlimited
    within
    company/enterprise
  • Available in Excel & PDF
  • Free industry update
    (Within 180 days)
  •   Free report update in next update cycle
    (Jul 2023 - Jul 2024)
  • Library
    Membership

  • $999 $ 1,175
    Per User/ Per month/ Billed annually
  • Published Content
    E-access
  • Company Profiles
    E-access
  • Newly Added Content Access
  • 10 PDF
    Downloads
  • 5 Excel Data
    Pack Downloads
  • 250 Company Profiles PDF Downloads
  • Buy Now

*Taxes/Fees, if applicable will be added during checkout. All prices in USD

RELATED REPORTS
 

Why Allied Market Research?


Infallible Methodology

To ensure high-level data integrity, accurate analysis, and impeccable forecasts

Analyst Support

For complete satisfaction

Customization

On-demand customization of scope of the report to exactly meet your needs

TARGETED MARKET VIEW

Targeted market view to provide pertinent information and save time of readers

Get fresh content delivered

Get insights on topics that are crucial for your business. Stay abreast of your interest areas.

Get Industry Data Alerts

Why Allied Market Research?

Infallible Methodology

To ensure high-level data integrity, accurate analysis, and impeccable forecasts

Analyst Support

For complete satisfaction

Customization

On-demand customization of scope of the report to exactly meet your needs

TARGETED MARKET VIEW

Targeted market view to provide pertinent information and save time of readers