Report Code: A15673 | Oct 2022 | Pages: 280 | ||
Tables: 221 | Charts: 59 |
|
The global birch water market size was valued at $1.2 billion in 2021, and is projected to reach $2.4 billion by 2031, growing at a CAGR of 7.2% from 2022 to 2031.
COVID-19 had a minimal impact on the growth of the birch water market in 2020. However, the increased health consciousness and rise in consumer expenditure on healthy food and beverage products boosted the demand for birch water during the pandemic.
The birch water market is segmented into Nature, Distribution Channel, Type and Application.
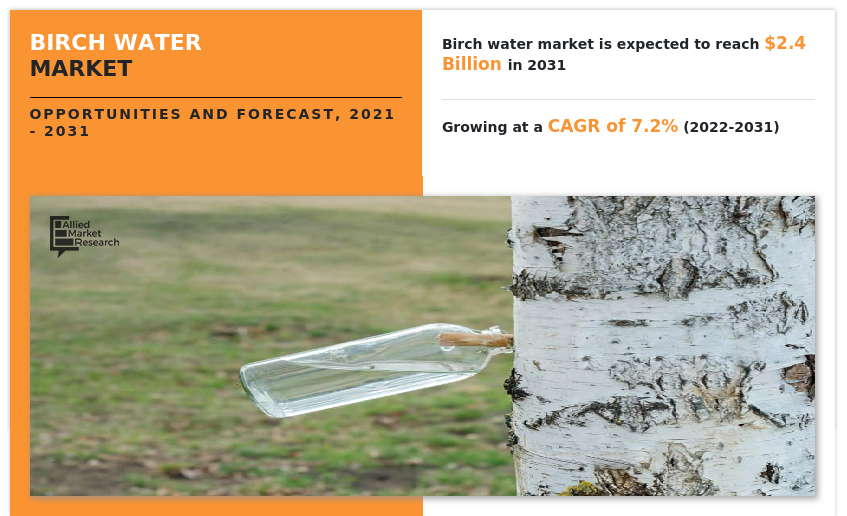
Birch water is a liquid or fluid that is directly tapped from the various birch trees, which include Betula occidentalis (red birch), Betula pendula (silver birch), Betula alba (white birch), Betula lenta (black birch), and Betula papyrifera (paper/white birch). Birch water is also known as birch sap. It is a transparent and sweet liquid and has a silky texture.
Birch water is traditionally considered to be a “super drink” owing to the natural presence of vital nutrients such as manganese, zin, calcium, potassium, and magnesium. It has been used as a medicinal ingredient and health drink by the populous in Canada, Eastern Europe, and China over the past century. For centuries, birch water has been known for detoxifying the body by removing toxins. Birch sap is a pure natural detox elixir that is low in calories and sugar and high in minerals and vitamins. As per an article by birch-sap.org, birch sap is rich in minerals, trace elements, and vitamins, especially B vitamins. It remineralizes joints and strengthens and rehydrates muscles for athletes, convalescent, and elderly people. The birch water contains a component named saponin which absorbs cholesterol, due to which it is helpful in reducing the cholesterol level. Along with this, it also drains the liver and uric acid from the body due to its anti-inflammatory effect. A 300ml of birch water contains 95% of the daily value of magnesium and 130% of daily manganese and birch water can also aid in weight loss as it eliminates excess salt and cleanses the urinary tract of harmful toxins. Therefore, the rising awareness among consumers regarding the numerous health benefits of birch water is expected to boost the birch water market demand for direct consumption, during the forecast period.
There is a surge in the demand for organic products among the global population. Rising awareness regarding the benefits of organic products, a rise in disposable income, and rapid urbanization are some of the reasons behind such an increase in the demand for organic products. According to the National Library of Medicine of the U.S. government, suggestive evidence indicates that organic food consumption may reduce the risk of allergic disease and of overweight and obesity, but residual confounding is likely, as consumers of organic food tend to have healthier lifestyles overall. Consumers are preferring organic products due to all these benefits of organic products which will result in the increased demand for organic plant-based water. Increasing demand will drive market growth for birch water. Therefore, rise in inclination toward organic food and beverages products is expected to drive the global birch water market growth in the upcoming future.
Furthermore, the rising applications of birch water in the personal care and cosmetics industry is fueling the market growth significantly. Birch water usage is getting increased significantly due to its various advantages for the skin. According to an article by Femina, when applied regularly, birch sap is thought to reduce cellulite and ancillary marks. It also helps rejuvenate skin, tighten it, reduce acne, and serves as protection from UV rays and pollution. Due to its moisturizing and antioxidant qualities, which help with collagen synthesis and iron absorption, birch water has become a common element in lotions and other cosmetics. The vitamin C in birch water may also strengthen your hair. All these benefits will increase its usage in the cosmetic industry which will provide an opportunity for the birch water market to grow.
However, the high prices of birch water may restrain the growth of the market. According to an article by Femina, a 100 ml bottle of birch water costs Rs 1,500 or $18.8, which is very expensive for a consumer in a developing nation. Such a high price of it makes it difficult for the middle-class population to consume. Such a high price of the product puts weight on the pocket of a consumer due to which consumers generally avoid it which can hinder the growth of the birch water market in the region.
According to the birch water market analysis, the birch water market is segregated based on type, application, nature, distribution channel, and region. By type, the market is segmented into carbonated and non-carbonated. Both the carbonated and non-carbonated segments as further bifurcated based on flavor into strawberry, blueberry, raspberry, apple ginger, lemon, unflavored, and others. Based on the application, it is segmented into food and beverages, nutraceuticals, pharmaceuticals, and personal care and cosmetics. Further, on the basis of nature, the market is bifurcated into organic and conventional segments. Depending on the distribution channel, the market is categorized into direct distribution and retail distribution. The retail distribution is further segmented into modern trade, convenience stores, online stores, and others. Region-wise, the birch water market is analyzed across North America, Europe, Asia-Pacific, and LAMEA (Latin America, the Middle East, and Africa).
As per the birch water market forecast, based on the type, the non-carbonated segment dominated the market, accounting for 84.2% of the birch water market share in 2021. Carbonated drinks can cause bloating, burping, and other gas symptoms which is a major reason that majority of the consumers are opting for regular or non-carbonated birch sap. The availability of birch water in a variety of flavors such as watermelon, blueberry, raspberry, lemon, mint, mango, and apple ginger attracts a huge number of different customers. Furthermore, the high nutritional contents of birch water are creating an image as a super-drink among consumers. The rising awareness regarding the health benefits of birch water is expected to drive the growth of this segment during the forecast period.
As per the birch water market trends, on the basis of application, the pharmaceuticals segment is expected to witness the highest CAGR of 8.0% during the forecast period. Birch water has certain properties that can be effective in the treatment of various diseases such as arthritis, gout, nephrolithiasis, and rheumatism. Moreover, birch water can reduce hair fall by strengthening hair and can clarify skin. Further, birch water is also effective in treating small kidney stones. These properties of birch water to effectively treat diseases are expected to drive the growth of this segment during the forecast period.
Depending on nature, the organic segment is expected to grow at the highest CAGR, during the forecast period, owing to the growing popularity and adoption of chemical-free and healthy food and beverages products. The growing demand for organic and natural products, as well as the health benefits of organic food and non-food products, are the two main factors driving the growth of the organic birch water market. According to Organic Trade Association in the year 2020-21, organic revenues exceeded $63 billion, with total annual growth of $1.4 billion. Food sales, which accounted for more than 90% of organic sales, reached $57.5 billion (approximately 2% growth) and non-food sales reached $6.0 billion (7% growth) in U.S. Additionally, the rising adoption of organic birch water in various industry verticals such as personal care, cosmetics, nutraceuticals, and food and beverages industries to manufacture organic products is expected to drive the growth of this segment during the forecast period.
Based on the distribution channel, the retail distribution segment dominated the market accounting for 65.5% of the birch water market share in 2021. Retail distribution is gaining popularity, owing to the availability of a broad range of consumer goods and food and beverages under a single roof. In addition, the availability of ample parking space and convenient operation timings boost the sale of birch water through retail distribution channels. Moreover, the increase in urbanization, rise in working-class population, and competitive pricing drive the popularity of retail distribution in developed and developing economies has significantly contributed to the growth of the retail distribution channel. Furthermore, these retail stores offer a variety of brands in a particular product category, offering more options for consumers to buy the brands as per their choice. Thus, all these factors collectively contribute to the growth of the overall birch water market.
Region-wise, the market is analyzed across North America (the U.S., Canada, and Mexico), Europe (UK, Germany, France, Italy, Russia, Spain, rest of Europe), Asia-Pacific (China, Japan, India, South Korea, Australia, and rest of Asia-Pacific), and LAMEA (Brazil, Argentina, South Africa, Saudi Arabia, Colombia, Turkey, rest of LAMEA).
Europe was the dominant market with 39.8% of the revenue share in 2021, followed by North America with 33.3%. Europe comprises the UK, Germany, France, Italy, Russia, Spain, Rest of Europe. Europe has the major share of the birch water market and the consumption of birch water is increasing at a significant rate in Europe, owing to a rise in awareness of the health benefits of birch water. The availability of a huge number of birch trees is expected to emerge as another growth factor for the birch water market in Europe. The increasing popularity of healthy functional drinks, the desired decrease in sugar and energy intake, and new flavor launches are the leading drivers behind the growing interest in the birch water market in Europe. The main reason for market stagnation was strong competition from other plant-based water dinks. However, it is expected that consumption will increase in the coming years. In the Scandinavian countries, there is extensive use of birch water as an anti-aging cosmetic in the personal care and cosmetic industry.
Asia-Pacific is expected to be the fastest-growing market during the forecast period. The market will grow at the highest CAGR of 8.2% owing to its huge population and rise in disposable income. Alon with these factors, rapid urbanization of the region and rising awareness of the health benefit of birch water will also help the market to rise in the region. China is one of the countries in which birch water is used as a refreshing and healthy drink owing to its dominance in the region. Whereas India is expected to grow at the highest CAGR owing to rapid urbanization and a rise in disposable income.
Players operating in the birch water industry have used a variety of developmental strategies to expand their market share, exploit the birch water market opportunities, and boost their profitability. The key players operating in the birch water industry include The Birch Factory, Alaska Wild Harvest, LLC., Nordic Koivu Ltd, Vitalife Ltd, Eminence organic skin care, Procter & Gamble, Nature On Tap Ltd., Treo Brands LLC., Sublime life, JSC Straikas, Sibberi, and BelSeva.
Birch Water Market Report Highlights
Aspects | Details |
---|---|
Market Size By 2031 | USD 2.4 billion |
Growth Rate | CAGR of 7.2% |
Forecast period | 2021 - 2031 |
Report Pages | 280 |
By Nature |
|
By Distribution Channel |
|
By Type |
|
By Application |
|
By Region |
|
Key Market Players | Nature On Tap Ltd., The Birch Factory, Eminence Organic Skin Care Inc., Procter & Gamble, Sublime Life, BelSeva, Vitalife Ltd., Alaska Wild Harvest LLC, Nordic Koivu Ltd., Treo Brands LLC. |
CHAPTER 1:INTRODUCTION
1.1.Report description
1.2.Key benefits for stakeholders
1.3.Key market segments
1.4.Research methodology
1.4.1.Secondary research
1.4.2.Primary research
1.4.3.Analyst tools and models
CHAPTER 2:EXECUTIVE SUMMARY
2.1.Key findings of the study
2.2.Snapshot
2.3.CXO perspective
CHAPTER 3:MARKET OVERVIEW
3.1.Market definition and scope
3.2.Key findings
3.2.1.Top investment pockets
3.3.Porter's five force analysis
3.4.Market player positioning, 2021
3.5.Market dynamics
3.5.1.Drivers
3.5.1.1.Health benefits of birch water
3.5.1.2.Increase in use in food and beverages and pharmaceutical industry
3.5.1.3.Rise in demand for organic plant-based water
3.5.2.Restraints
3.5.2.1.High price of birch water
3.5.2.2.Limited availability of birch water
3.5.3.Opportunities
3.5.3.1.Growth in use in cosmetic industry
3.5.3.2.Introduction of tetra-packaging
3.6.Value chain analysis
3.7.Parent-Peer Market Outlook
3.7.1.Parent-Peer Market Overview, 2021
3.8.Top Impacting Factors: Birch Water Market
3.8.1.Top Impacting Factor, 2021 & 2031
3.9.Birch Water Market: Market Share Analysis
3.9.1.By Type
3.9.2.By Application
3.9.3.By Nature
3.9.4.By Distribution Channel
3.9.5.By Region
3.10.COVID-19 Impact on the Vitamin Supplements Market
3.10.1.Introduction
CHAPTER 4:BIRCH WATER MARKET, BY TYPE
4.1.Overview
4.1.1.Market size and forecast, by type
4.2.Carbonated
4.2.1.Key market trends, growth factors, and opportunities
4.2.2.Market size and forecast, by region
4.2.2.1.Market size and forecast, by carbonated
4.2.2.2.Strawberry
4.2.2.2.1.Market size and forecast, by region
4.2.2.3.Blueberry
4.2.2.3.1.Market size and forecast, by region
4.2.2.4.Raspberry
4.2.2.4.1.Market size and forecast, by region
4.2.2.5.Apple ginger
4.2.2.5.1.Market size and forecast, by region
4.2.2.6.Lemon
4.2.2.6.1.Market size and forecast, by region
4.2.2.7.Unflavored
4.2.2.7.1.Market size and forecast, by region
4.2.2.8.Others
4.2.2.8.1.Market size and forecast, by region
4.2.3.Market size and forecast, by country
4.3.Non-carbonated
4.3.1.Key market trends, growth factors, and opportunities
4.3.2.Market size and forecast, by region
4.3.2.1.Market size and forecast, by non-carbonated
4.3.2.2.Strawberry
4.3.2.2.1.Market size and forecast, by regio
4.3.2.3.Blueberry
4.3.2.3.1.Market size and forecast, by region
4.3.2.4.Raspberry
4.3.2.4.1.Market size and forecast, by region
4.3.2.5.Apple ginger
4.3.2.5.1.Market size and forecast, by region
4.3.2.6.Lemon
4.3.2.6.1.Market size and forecast, by region
4.3.2.7.Unflavored
4.3.2.7.1.Market size and forecast, by region
4.3.2.8.Others
4.3.2.8.1.Market size and forecast, by region
4.3.3.Market size and forecast, by country
CHAPTER 5:BIRCH WATER MARKET, BY APPLICATION
5.1.Overview
5.1.1.Market size and forecast
5.2.Food and Beverages
5.2.1.Key market trends, growth factors, and opportunities
5.2.2.Market size and forecast, by region
5.2.3.Market size and forecast, by country
5.3.Nutraceuticals
5.3.1.Key market trends, growth factors, and opportunities
5.3.2.Market size and forecast, by region
5.3.3.Market size and forecast, by country
5.4.Pharmaceuticals
5.4.1.Key market trends, growth factors, and opportunities
5.4.2.Market size and forecast, by region
5.4.3.Market size and forecast, by country
5.5.Personal Care & Cosmetics
5.5.1.Key market trends, growth factors, and opportunities
5.5.2.Market size and forecast, by region
5.5.3.Market size and forecast, by country
CHAPTER 6:BIRCH WATER MARKET, BY NATURE
6.1.Overview
6.1.1.Market size and forecast
6.2.Organic
6.2.1.Key market trends, growth factors, and opportunities
6.2.2.Market size and forecast, by region
6.2.3.Market size and forecast, by country
6.3.Conventional
6.3.1.Key market trends, growth factors, and opportunities
6.3.2.Market size and forecast, by region
6.3.3.Market size and forecast, by country
CHAPTER 7:BIRCH WATER MARKET, BY DISTRIBUTION CHANNEL
7.1.Overview
7.1.1.Market size and forecast
7.2.Direct distribution
7.2.1.Key market trends, growth factors, and opportunities
7.2.2.Market size and forecast, by region
7.2.3.Market size and forecast, by country
7.3.Retail distribution
7.3.1.Key market trends, growth factors, and opportunities
7.3.2.Market size and forecast, by region
7.3.3.Market size and forecast, by country
7.3.3.1.Modern trade
7.3.3.1.1.Market size and forecast, by region
7.3.3.2.Convenience stores
7.3.3.2.1.Market size and forecast, by region
7.3.3.3.Online stores
7.3.3.3.1.Market size and forecast, by region
7.3.3.4.Others
7.3.3.4.1.Market size and forecast, by region
CHAPTER 8:BIRCH WATER MARKET, BY REGION
8.1.Overview
8.1.1.Market size and forecast, by region
8.2.North America
8.2.1.Key market trends, growth factors, and opportunities
8.2.2.Market size and forecast, by type
8.2.2.1.Market size and forecast, by carbonated, by flavor
8.2.2.2.Market size and forecast, by non-carbonated, by flavor
8.2.3.Market size and forecast, by application
8.2.4.Market size and forecast, by nature
8.2.5.Market size and forecast, by distribution channel
8.2.5.1.Market size and forecast, by retail distribution
8.2.6.Market size and forecast, by country
8.2.6.1.U.S.
8.2.6.1.1.Market size and forecast, by type
8.2.6.1.2.Market size and forecast, by application
8.2.6.1.3.Market size and forecast, by nature
8.2.6.1.4.Market size and forecast, by distribution channel
8.2.6.2.Canada
8.2.6.2.1.Market size and forecast, by type
8.2.6.2.2.Market size and forecast, by application
8.2.6.2.3.Market size and forecast, by nature
8.2.6.2.4.Market size and forecast, by distribution channel
8.2.6.3.Mexico
8.2.6.3.1.Market size and forecast, by type
8.2.6.3.2.Market size and forecast, by application
8.2.6.3.3.Market size and forecast, by nature
8.2.6.3.4.Market size and forecast, by distribution channel
8.3.Europe
8.3.1.Key market trends, growth factors, and opportunities
8.3.2.Market size and forecast, by type
8.3.2.1.Market size and forecast, by carbonated
8.3.2.2.Market size and forecast, by non-carbonated
8.3.3.Market size and forecast, by application
8.3.4.Market size and forecast, by nature
8.3.5.Market size and forecast, by distribution channel
8.3.5.1.Market size and forecast, by retail channel
Source: Primary & Secondary Research and AMR Analysis
8.3.6.Market size and forecast, by retail channel
8.3.6.1.UK
8.3.6.1.1.Market size and forecast, by type
8.3.6.1.2.Market size and forecast, by application
8.3.6.1.3.Market size and forecast, by nature
8.3.6.1.4.Market size and forecast, by distribution channel
8.3.6.2.Germany
8.3.6.2.1.Market size and forecast, by type
8.3.6.2.2.Market size and forecast, by application
8.3.6.2.3.Market size and forecast, by nature
8.3.6.2.4.Market size and forecast, by distribution channel
8.3.6.3.France
8.3.6.3.1.Market size and forecast, by type
8.3.6.3.2.Market size and forecast, by application
8.3.6.3.3.Market size and forecast, by nature
8.3.6.3.4.Market size and forecast, by distribution channel
8.3.6.4.Italy
8.3.6.4.1.Market size and forecast, by type
8.3.6.4.2.Market size and forecast, by application
8.3.6.4.3.Market size and forecast, by nature
8.3.6.4.4.Market size and forecast, by distribution channel
8.3.6.5.Russia
8.3.6.5.1.Market size and forecast, by type
8.3.6.5.2.Market size and forecast, by application
8.3.6.5.3.Market size and forecast, by nature
8.3.6.5.4.Market size and forecast, by distribution channel
8.3.6.6.Spain
8.3.6.6.1.Market size and forecast, by type
8.3.6.6.2.Market size and forecast, by application
8.3.6.6.3.Market size and forecast, by nature
8.3.6.6.4.Market size and forecast, by distribution channel
8.3.6.7.Rest of Europe
8.3.6.7.1.Market size and forecast, by type
8.3.6.7.2.Market size and forecast, by application
8.3.6.7.3.Market size and forecast, by nature
8.3.6.7.4.Market size and forecast, by distribution channel
8.4.Asia-Pacific
8.4.1.Key market trends, growth factors, and opportunities
8.4.2.Market size and forecast, by type
8.4.2.1.Market size and forecast, by carbonated
8.4.2.2.Market size and forecast, by non-carbonated
8.4.3.Market size and forecast, by application
8.4.4.Market size and forecast, by nature
8.4.5.Market size and forecast, by distribution channel
8.4.5.1.Market size and forecast, by retail channel
8.4.6.Market size and forecast, by retail channel
8.4.6.1.China
8.4.6.1.1.Market size and forecast, by type
8.4.6.1.2.Market size and forecast, by application
8.4.6.1.3.Market size and forecast, by nature
8.4.6.1.4.Market size and forecast, by distribution channel
8.4.6.2.Japan
8.4.6.2.1.Market size and forecast, by type
8.4.6.2.2.Market size and forecast, by application
8.4.6.2.3.Market size and forecast, by nature
8.4.6.2.4.Market size and forecast, by distribution channel
8.4.6.3.India
8.4.6.3.1.Market size and forecast, by type
8.4.6.3.2.Market size and forecast, by application
8.4.6.3.3.Market size and forecast, by nature
8.4.6.3.4.Market size and forecast, by distribution channel
8.4.6.4.South Korea
8.4.6.4.1.Market size and forecast, by type
8.4.6.4.2.Market size and forecast, by application
8.4.6.4.3.Market size and forecast, by nature
8.4.6.4.4.Market size and forecast, by distribution channel
8.4.6.5.Australia
8.4.6.5.1.Market size and forecast, by type
8.4.6.5.2.Market size and forecast, by application
8.4.6.5.3.Market size and forecast, by nature
8.4.6.5.4.Market size and forecast, by distribution channel
8.4.6.6.Rest of Asia-Pacific
8.4.6.6.1.Market size and forecast, by type
8.4.6.6.2.Market size and forecast, by application
8.4.6.6.3.Market size and forecast, by nature
8.4.6.6.4.Market size and forecast, by distribution channel
8.5.LAMEA
8.5.1.Key market trends, growth factors, and opportunities
8.5.2.Market size and forecast, by type
8.5.2.1.Market size and forecast, by carbonated
8.5.2.2.Market size and forecast, by non-carbonated
8.5.3.Market size and forecast, by application
8.5.4.Market size and forecast, by nature
8.5.5.Market size and forecast, by distribution channel
8.5.5.1.Market size and forecast, by retail channel
Source: Primary & Secondary Research and AMR Analysis
8.5.6.Market size and forecast, by retail channel
8.5.6.1.Brazil
8.5.6.1.1.Market size and forecast, by type
8.5.6.1.2.Market size and forecast, by application
8.5.6.1.3.Market size and forecast, by nature
8.5.6.1.4.Market size and forecast, by distribution channel
8.5.6.2.Argentina
8.5.6.2.1.Market size and forecast, by type
8.5.6.2.2.Market size and forecast, by application
8.5.6.2.3.Market size and forecast, by nature
8.5.6.2.4.Market size and forecast, by distribution channel
8.5.6.3.South Africa
8.5.6.3.1.Market size and forecast, by type
8.5.6.3.2.Market size and forecast, by application
8.5.6.3.3.Market size and forecast, by nature
8.5.6.3.4.Market size and forecast, by distribution channel
Source: Primary & Secondary Research and AMR Analysis
8.5.6.4.Saudi Arabia
8.5.6.4.1.Market size and forecast, by type
8.5.6.4.2.Market size and forecast, by application
8.5.6.4.3.Market size and forecast, by nature
8.5.6.4.4.Market size and forecast, by distribution channel
8.5.6.5.Colombia
8.5.6.5.1.Market size and forecast, by type
8.5.6.5.2.Market size and forecast, by application
8.5.6.5.3.Market size and forecast, by nature
8.5.6.5.4.Market size and forecast, by distribution channel
8.5.6.6.Turkey
8.5.6.6.1.Market size and forecast, by type
8.5.6.6.2.Market size and forecast, by application
8.5.6.6.3.Market size and forecast, by nature
8.5.6.6.4.Market size and forecast, by distribution channel
8.5.6.7.Rest of LAMEA
8.5.6.7.1.Market size and forecast, by type
8.5.6.7.2.Market size and forecast, by application
8.5.6.7.3.Market size and forecast, by nature
8.5.6.7.4.Market size and forecast, by distribution channel
CHAPTER 9:COMPETITION LANDSCAPE
9.1.Overview
9.2.Competitive dashboard
9.3.Competitive heat map
9.4.Product mapping
CHAPTER 10:COMPANY PROFILES
10.1.THE BIRCH FACTORY
10.1.1.Company overview
10.1.2.Key Executives
10.1.3.Company snapshot
10.1.4.Product portfolio
10.2.ALASKA WILD HARVEST, LLC.
10.2.1.Company overview
10.2.2.Key Executives
10.2.3.Company snapshot
10.2.4.Product portfolio
10.3.NORDIC KOIVU LTD.
10.3.1.Company overview
10.3.2.Key Executives
10.3.3.Company snapshot
10.3.4.Product portfolio
10.4.VITALIFE LTD.
10.4.1.Company overview
10.4.2.Key Executives
10.4.3.Company snapshot
10.4.4.Product portfolio
10.5.EMINENCE ORGANIC SKIN CARE
10.5.1.Company overview
10.5.2.Key Executives
10.5.3.Company snapshot
10.5.4.Product portfolio
10.6.PROCTER & GAMBLE
10.6.1.Company overview
10.6.2.Key Executives
10.6.3.Company snapshot
10.6.4.Product portfolio
10.7.TREO BRANDS LLC.
10.7.1.Company overview
10.7.2.Key Executives
10.7.3.Company snapshot
10.7.4.Product portfolio
10.8.SUBLIME LIFE
10.8.1.Company overview
10.8.2.Key Executives
10.8.3.Company snapshot
10.8.4.Product portfolio
10.9.JSC STRAIKAS
10.9.1.Company overview
10.9.2.Key Executives
10.9.3.Company snapshot
10.9.4.Product portfolio
10.10.SIBBERI
10.10.1.Company overview
10.10.2.Key executives
10.10.3.Company snapshot
10.10.4.Product portfolio
CHAPTER 11:KEY INNOVATORS PROFILE
11.1.BELSEVA
11.1.1.Company overview
11.1.2.Key Executives
11.1.3.Company snapshot
11.1.4.Product portfolio
11.1.5.Key Innovations and Its Impact Over the Market
11.2.NATURE ON TAP LTD.
11.2.1.Company overview
11.2.2.Key Executives
11.2.3.Company snapshot
11.2.4.Product portfolio
11.2.5.Key Innovations and Its Impact Over the Market
LIST OF TABLES
TABLE 01.GLOBAL BIRCH WATER MARKET, BY TYPE, 2021-2031 ($MILLION)
TABLE 02.BIRCH WATER MARKET FOR CARBONATED, BY REGION, 2021-2031 ($MILLION)
TABLE 03.BIRCH WATER MARKET, BY CARBONATED, 2021-2031 ($MILLION)
TABLE 04.BIRCH WATER MARKET FOR CARBONATED STRAWBERRY, BY REGION, 2021-2031 ($MILLION)
TABLE 05.BIRCH WATER MARKET FOR CARBONATED BLUEBERRY, BY REGION, 2021-2031 ($MILLION)
TABLE 06.BIRCH WATER MARKET FOR CARBONATED RASPBERRY, BY REGION, 2021-2031 ($MILLION)
TABLE 07.BIRCH WATER MARKET FOR CARBONATED APPLE GINGER, BY REGION, 2021-2031 ($MILLION)
TABLE 08.BIRCH WATER MARKET FOR CARBONATED LEMON, BY REGION, 2021-2031 ($MILLION)
TABLE 09.BIRCH WATER MARKET FOR CARBONATED UNFLAVORED, BY REGION, 2021-2031 ($MILLION)
TABLE 10.BIRCH WATER MARKET FOR CARBONATED OTHERS, BY REGION, 2021-2031 ($MILLION)
TABLE 11.BIRCH WATER MARKET FOR NON-CARBONATED , BY REGION, 2021-2031 ($MILLION)
TABLE 12.GLOBAL BIRCH WATER MARKET , BY NON-CARBONATED, 2021-2031 ($MILLION)
TABLE 13.BIRCH WATER MARKET FOR NON-CARBONATED STRAWBERRY, BY REGION, 2021-2031 ($MILLION)
TABLE 14.BIRCH WATER MARKET FOR NON-CARBONATED BLUEBERRY, BY REGION, 2021-2031 ($MILLION)
TABLE 15.BIRCH WATER MARKET FOR NON-CARBONATED RASPBERRY, BY REGION, 2021-2031 ($MILLION)
TABLE 16.BIRCH WATER MARKET FOR NON-CARBONATED APPLE GINGER, BY REGION, 2021-2031 ($MILLION)
TABLE 17.BIRCH WATER MARKET FOR NON-CARBONATED LEMON, BY REGION, 2021-2031 ($MILLION)
TABLE 18.BIRCH WATER MARKET FOR NON-CARBONATED UNFLAVORED, BY REGION, 2021-2031 ($MILLION)
TABLE 19.BIRCH WATER MARKET FOR NON-CARBONATED OTHERS, BY REGION, 2021-2031 ($MILLION)
TABLE 20.BIRCH WATER MARKET , BY APPLICATION, 2021-2031 ($MILLION)
TABLE 21.BIRCH WATER MARKET FOR FOOD & BEVERAGES, BY REGION, 2021-2031 ($MILLION)
TABLE 22.BIRCH WATER MARKET FOR NUTRACEUTICALS, BY REGION, 2021-2031 ($MILLION)
TABLE 23.BIRCH WATER MARKET FOR PHARMACEUTICALS, BY REGION, 2021-2031 ($MILLION)
TABLE 24.BIRCH WATER MARKET FOR PERSONAL CARE & COSMETICS, BY REGION, 2021-2031 ($MILLION)
TABLE 25.BIRCH WATER MARKET , BY NATURE, 2021-2031 ($MILLION)
TABLE 26.BIRCH WATER MARKET FOR ORGANIC, BY REGION, 2021-2031 ($MILLION)
TABLE 27.BIRCH WATER MARKET FOR CONVENTIONAL, BY REGION, 2021-2031 ($MILLION)
TABLE 28.BIRCH WATER MARKET , BY DISTRIBUTION CHANNEL, 2021-2031 ($MILLION)
TABLE 29.BIRCH WATER MARKET FOR DIRECT DISTRIBUTION, BY REGION, 2021-2031 ($MILLION)
TABLE 30.BIRCH WATER MARKET FOR RETAIL DISTRIBUTION, BY REGION, 2021-2031 ($MILLION)
TABLE 31.BIRCH WATER MARKET FOR MODERN TRADE, BY REGION, 2021-2031 ($MILLION)
TABLE 32.BIRCH WATER MARKET FOR CONVENIENCE STORES, BY REGION, 2021-2031 ($MILLION)
TABLE 33.BIRCH WATER MARKET FOR NON-CARBONATED RASPBERRY, BY REGION, 2021-2031 ($MILLION)
TABLE 34.BIRCH WATER MARKET FOR NON-CARBONATED APPLE GINGER, BY REGION, 2021-2031 ($MILLION)
TABLE 35.BIRCH WATER MARKET , BY REGION, 2021-2031 ($MILLION)
TABLE 36.NORTH AMERICA BIRCH WATER MARKET , BY TYPE, 2021-2031 ($MILLION)
TABLE 37.NORTH AMERICA BIRCH WATER MARKET , BY CARBONATED , BY FLAVOR, 2021-2031 ($MILLION)
TABLE 38.NORTH AMERICA BIRCH WATER MARKET , BY NON-CARBONATED, BY FLAVOR, 2021-2031 ($MILLION)
TABLE 39.NORTH AMERICA BIRCH WATER MARKET , BY APPLICATION, 2021-2031 ($MILLION)
TABLE 40.NORTH AMERICA BIRCH WATER MARKET , BY NATURE, 2021-2031 ($MILLION)
TABLE 41.NORTH AMERICA BIRCH WATER MARKET , BY DISTRIBUTION CHANNEL, 2021-2031 ($MILLION)
TABLE 42.NORTH AMERICA BIRCH WATER MARKET , BY NON-CARBONATED , 2021-2031 ($MILLION)
TABLE 43.NORTH AMERICA BIRCH WATER MARKET , BY COUNTRY, 2021-2031 ($MILLION)
TABLE 44.U.S. BIRCH WATER MARKET , BY TYPE, 2021-2031 ($MILLION)
TABLE 45.U.S. BIRCH WATER MARKET , BY APPLICATION, 2021-2031 ($MILLION)
TABLE 46.U.S. BIRCH WATER MARKET , BY NATURE, 2021-2031 ($MILLION)
TABLE 47.U.S. BIRCH WATER MARKET , BY DISTRIBUTION CHANNEL, 2021-2031 ($MILLION)
TABLE 48.CANADA BIRCH WATER MARKET , BY TYPE, 2021-2031 ($MILLION)
TABLE 49.CANADA BIRCH WATER MARKET , BY APPLICATION, 2021-2031 ($MILLION)
TABLE 50.CANADA BIRCH WATER MARKET , BY NATURE, 2021-2031 ($MILLION)
TABLE 51.CANADA BIRCH WATER MARKET , BY DISTRIBUTION CHANNEL, 2021-2031 ($MILLION)
TABLE 52.MEXICO BIRCH WATER MARKET , BY TYPE, 2021-2031 ($MILLION)
TABLE 53.MEXICO BIRCH WATER MARKET , BY APPLICATION, 2021-2031 ($MILLION)
TABLE 54.MEXICO BIRCH WATER MARKET , BY NATURE, 2021-2031 ($MILLION)
TABLE 55.MEXICO BIRCH WATER MARKET , BY DISTRIBUTION CHANNEL, 2021-2031 ($MILLION)
TABLE 56.EUROPE BIRCH WATER MARKET , BY TYPE, 2021-2031 ($MILLION)
TABLE 57.EUROPE BIRCH WATER MARKET , BY CARBONATED , 2021-2031 ($MILLION)
TABLE 58.EUROPE BIRCH WATER MARKET , BY NON-CARBONATED , 2021-2031 ($MILLION)
TABLE 59.EUROPE BIRCH WATER MARKET , BY APPLICATION, 2021-2031 ($MILLION)
TABLE 60.EUROPE BIRCH WATER MARKET , BY NATURE, 2021-2031 ($MILLION)
TABLE 61.EUROPE BIRCH WATER MARKET , BY DISTRIBUTION CHANNEL, 2021-2031 ($MILLION)
TABLE 62.EUROPE BIRCH WATER MARKET , BY NON-CARBONATED , 2021-2031 ($MILLION)
TABLE 63.EUROPE BIRCH WATER MARKET , BY COUNTRY, 2021-2031 ($MILLION)
TABLE 64.UK BIRCH WATER MARKET , BY TYPE, 2021-2031 ($MILLION)
TABLE 65.UK BIRCH WATER MARKET , BY APPLICATION, 2021-2031 ($MILLION)
TABLE 66.UK BIRCH WATER MARKET , BY NATURE, 2021-2031 ($MILLION)
TABLE 67.UK BIRCH WATER MARKET , BY DISTRIBUTION CHANNEL, 2021-2031 ($MILLION)
TABLE 68.GERMANY BIRCH WATER MARKET , BY TYPE, 2021-2031 ($MILLION)
TABLE 69.GERMANY BIRCH WATER MARKET , BY APPLICATION, 2021-2031 ($MILLION)
TABLE 70.GERMANY BIRCH WATER MARKET , BY NATURE, 2021-2031 ($MILLION)
TABLE 71.GERMANY BIRCH WATER MARKET , BY DISTRIBUTION CHANNEL, 2021-2031 ($MILLION)
TABLE 72.FRANCE BIRCH WATER MARKET , BY TYPE, 2021-2031 ($MILLION)
TABLE 73.FRANCE BIRCH WATER MARKET , BY APPLICATION, 2021-2031 ($MILLION)
TABLE 74.FRANCE BIRCH WATER MARKET , BY NATURE, 2021-2031 ($MILLION)
TABLE 75.FRANCE BIRCH WATER MARKET , BY DISTRIBUTION CHANNEL, 2021-2031 ($MILLION)
TABLE 76.ITALY BIRCH WATER MARKET , BY TYPE, 2021-2031 ($MILLION)
TABLE 77.ITALY BIRCH WATER MARKET , BY APPLICATION, 2021-2031 ($MILLION)
TABLE 78.ITALY BIRCH WATER MARKET , BY NATURE, 2021-2031 ($MILLION)
TABLE 79.ITALY BIRCH WATER MARKET , BY DISTRIBUTION CHANNEL, 2021-2031 ($MILLION)
TABLE 80.RUSSIA BIRCH WATER MARKET , BY TYPE, 2021-2031 ($MILLION)
TABLE 81.RUSSIA BIRCH WATER MARKET , BY APPLICATION, 2021-2031 ($MILLION)
TABLE 82.RUSSIA BIRCH WATER MARKET , BY NATURE, 2021-2031 ($MILLION)
TABLE 83.RUSSIA BIRCH WATER MARKET , BY DISTRIBUTION CHANNEL, 2021-2031 ($MILLION)
TABLE 84.SPAIN BIRCH WATER MARKET , BY TYPE, 2021-2031 ($MILLION)
TABLE 85.SPAIN BIRCH WATER MARKET , BY APPLICATION, 2021-2031 ($MILLION)
TABLE 86.SPAIN BIRCH WATER MARKET , BY NATURE, 2021-2031 ($MILLION)
TABLE 87.SPAIN BIRCH WATER MARKET , BY DISTRIBUTION CHANNEL, 2021-2031 ($MILLION)
TABLE 88.REST OF EUROPE BIRCH WATER MARKET , BY TYPE, 2021-2031 ($MILLION)
TABLE 89.REST OF EUROPE BIRCH WATER MARKET , BY APPLICATION, 2021-2031 ($MILLION)
TABLE 90.REST OF EUROPE BIRCH WATER MARKET , BY NATURE, 2021-2031 ($MILLION)
TABLE 91.REST OF EUROPE BIRCH WATER MARKET , BY DISTRIBUTION CHANNEL, 2021-2031 ($MILLION)
TABLE 92.ASIA-PACIFIC BIRCH WATER MARKET , BY TYPE, 2021-2031 ($MILLION)
TABLE 93.ASIA-PACIFIC BIRCH WATER MARKET , BY CARBONATED , 2021-2031 ($MILLION)
TABLE 94.ASIA-PACIFIC BIRCH WATER MARKET , BY NON-CARBONATED , 2021-2031 ($MILLION)
TABLE 95.ASIA-PACIFIC BIRCH WATER MARKET , BY APPLICATION, 2021-2031 ($MILLION)
TABLE 96.ASIA-PACIFIC BIRCH WATER MARKET , BY NATURE, 2021-2031 ($MILLION)
TABLE 97.ASIA-PACIFIC BIRCH WATER MARKET , BY DISTRIBUTION CHANNEL, 2021-2031 ($MILLION)
TABLE 98.ASIA-PACIFIC BIRCH WATER MARKET , BY NON-CARBONATED , 2021-2031 ($MILLION)
TABLE 99.ASIA-PACIFIC BIRCH WATER MARKET , BY COUNTRY, 2021-2031 ($MILLION)
TABLE 100.CHINA BIRCH WATER MARKET , BY TYPE, 2021-2031 ($MILLION)
TABLE 101.CHINA BIRCH WATER MARKET , BY APPLICATION, 2021-2031 ($MILLION)
TABLE 102.CHINA BIRCH WATER MARKET , BY NATURE, 2021-2031 ($MILLION)
TABLE 103.CHINA BIRCH WATER MARKET , BY DISTRIBUTION CHANNEL, 2021-2031 ($MILLION)
TABLE 104.JAPAN BIRCH WATER MARKET , BY TYPE, 2021-2031 ($MILLION)
TABLE 105.JAPAN BIRCH WATER MARKET , BY APPLICATION, 2021-2031 ($MILLION)
TABLE 106.JAPAN BIRCH WATER MARKET , BY NATURE, 2021-2031 ($MILLION)
TABLE 107.JAPAN BIRCH WATER MARKET , BY DISTRIBUTION CHANNEL, 2021-2031 ($MILLION)
TABLE 108.INDIA BIRCH WATER MARKET , BY TYPE, 2021-2031 ($MILLION)
TABLE 109.INDIA BIRCH WATER MARKET , BY APPLICATION, 2021-2031 ($MILLION)
TABLE 110.INDIA BIRCH WATER MARKET , BY NATURE, 2021-2031 ($MILLION)
TABLE 111.INDIA BIRCH WATER MARKET , BY DISTRIBUTION CHANNEL, 2021-2031 ($MILLION)
TABLE 112.SOUTH KOREA BIRCH WATER MARKET , BY TYPE, 2021-2031 ($MILLION)
TABLE 113.SOUTH KOREA BIRCH WATER MARKET , BY APPLICATION, 2021-2031 ($MILLION)
TABLE 114.SOUTH KOREA BIRCH WATER MARKET , BY NATURE, 2021-2031 ($MILLION)
TABLE 115.SOUTH KOREA BIRCH WATER MARKET , BY DISTRIBUTION CHANNEL, 2021-2031 ($MILLION)
TABLE 116.AUSTRALIA BIRCH WATER MARKET , BY TYPE, 2021-2031 ($MILLION)
TABLE 117.AUSTRALIA BIRCH WATER MARKET , BY APPLICATION, 2021-2031 ($MILLION)
TABLE 118.AUSTRALIA BIRCH WATER MARKET , BY NATURE, 2021-2031 ($MILLION)
TABLE 119.AUSTRALIA BIRCH WATER MARKET , BY DISTRIBUTION CHANNEL, 2021-2031 ($MILLION)
TABLE 120.REST OF ASIA-PACIFIC BIRCH WATER MARKET , BY TYPE, 2021-2031 ($MILLION)
TABLE 121.REST OF ASIA-PACIFIC BIRCH WATER MARKET , BY APPLICATION, 2021-2031 ($MILLION)
TABLE 122.REST OF ASIA-PACIFIC BIRCH WATER MARKET , BY NATURE, 2021-2031 ($MILLION)
TABLE 123.REST OF ASIA-PACIFIC BIRCH WATER MARKET , BY DISTRIBUTION CHANNEL, 2021-2031 ($MILLION)
TABLE 124.LAMEA BIRCH WATER MARKET , BY TYPE, 2021-2031 ($MILLION)
TABLE 125.LAMEA BIRCH WATER MARKET , BY CARBONATED , 2021-2031 ($MILLION)
TABLE 126.LAMEA BIRCH WATER MARKET , BY NON-CARBONATED , 2021-2031 ($MILLION)
TABLE 127.LAMEA BIRCH WATER MARKET , BY APPLICATION, 2021-2031 ($MILLION)
TABLE 128.LAMEA BIRCH WATER MARKET , BY NATURE, 2021-2031 ($MILLION)
TABLE 129.LAMEA BIRCH WATER MARKET , BY DISTRIBUTION CHANNEL, 2021-2031 ($MILLION)
TABLE 130.LAMEA BIRCH WATER MARKET , BY NON-CARBONATED , 2021-2031 ($MILLION)
TABLE 131.LAMEA BIRCH WATER MARKET , BY COUNTRY, 2021-2031 ($MILLION)
TABLE 132.BRAZIL BIRCH WATER MARKET , BY TYPE, 2021-2031 ($MILLION)
TABLE 133.BRAZIL BIRCH WATER MARKET , BY APPLICATION, 2021-2031 ($MILLION)
TABLE 134.BRAZIL BIRCH WATER MARKET , BY NATURE, 2021-2031 ($MILLION)
TABLE 135.BRAZIL BIRCH WATER MARKET , BY DISTRIBUTION CHANNEL, 2021-2031 ($MILLION)
TABLE 136.ARGENTINA BIRCH WATER MARKET , BY TYPE, 2021-2031 ($MILLION)
TABLE 137.ARGENTINA BIRCH WATER MARKET , BY APPLICATION, 2021-2031 ($MILLION)
TABLE 138.ARGENTINA BIRCH WATER MARKET , BY NATURE, 2021-2031 ($MILLION)
TABLE 139.ARGENTINA BIRCH WATER MARKET , BY DISTRIBUTION CHANNEL, 2021-2031 ($MILLION)
TABLE 140.SOUTH AFRICA BIRCH WATER MARKET , BY TYPE, 2021-2031 ($MILLION)
TABLE 141.SOUTH AFRICA BIRCH WATER MARKET , BY APPLICATION, 2021-2031 ($MILLION)
TABLE 142.SOUTH AFRICA BIRCH WATER MARKET , BY NATURE, 2021-2031 ($MILLION)
TABLE 143.SOUTH AFRICA BIRCH WATER MARKET , BY DISTRIBUTION CHANNEL, 2021-2031 ($MILLION)
TABLE 144.SAUDI ARABIA BIRCH WATER MARKET , BY TYPE, 2021-2031 ($MILLION)
TABLE 145.SAUDI ARABIA BIRCH WATER MARKET , BY APPLICATION, 2021-2031 ($MILLION)
TABLE 146.SAUDI ARABIA BIRCH WATER MARKET , BY NATURE, 2021-2031 ($MILLION)
TABLE 147.SAUDI ARABIA BIRCH WATER MARKET , BY DISTRIBUTION CHANNEL, 2021-2031 ($MILLION)
TABLE 148.COLOMBIA BIRCH WATER MARKET , BY TYPE, 2021-2031 ($MILLION)
TABLE 149.COLOMBIA BIRCH WATER MARKET , BY APPLICATION, 2021-2031 ($MILLION)
TABLE 150.COLOMBIA BIRCH WATER MARKET , BY NATURE, 2021-2031 ($MILLION)
TABLE 151.COLOMBIA BIRCH WATER MARKET , BY DISTRIBUTION CHANNEL, 2021-2031 ($MILLION)
TABLE 152.TURKEY BIRCH WATER MARKET , BY TYPE, 2021-2031 ($MILLION)
TABLE 153.TURKEY BIRCH WATER MARKET , BY APPLICATION, 2021-2031 ($MILLION)
TABLE 154.TURKEY BIRCH WATER MARKET , BY NATURE, 2021-2031 ($MILLION)
TABLE 155.TURKEY BIRCH WATER MARKET , BY DISTRIBUTION CHANNEL, 2021-2031 ($MILLION)
TABLE 156.REST OF LAMEA BIRCH WATER MARKET , BY TYPE, 2021-2031 ($MILLION)
TABLE 157.REST OF LAMEA BIRCH WATER MARKET , BY APPLICATION, 2021-2031 ($MILLION)
TABLE 158.REST OF LAMEA BIRCH WATER MARKET , BY NATURE, 2021-2031 ($MILLION)
TABLE 159.REST OF LAMEA BIRCH WATER MARKET , BY DISTRIBUTION CHANNEL, 2021-2031 ($MILLION)
TABLE 160.THE BIRCH FACTORY: KEY EXECUTIVES
TABLE 161.THE BIRCH FACTORY: COMPANY SNAPSHOT
TABLE 162.THE BIRCH FACTORY: PRODUCT PORTFOLIO
TABLE 163.ALASKA WILD HARVEST, LLC.: KEY EXECUTIVES
TABLE 164.ALASKA WILD HARVEST, LLC.: COMPANY SNAPSHOT
TABLE 165.ALASKA WILD HARVEST, LLC.: PRODUCT PORTFOLIO
TABLE 166.NORDIC KOIVU LTD.: KEY EXECUTIVES
TABLE 167.NORDIC KOIVU LTD.: COMPANY SNAPSHOT
TABLE 168.NORDIC KOIVU LTD.: PRODUCT PORTFOLIO
TABLE 169.VITALIFE LTD.: KEY EXECUTIVES
TABLE 170.VITALIFE LTD.: COMPANY SNAPSHOT
TABLE 171.VITALIFE LTD.: PRODUCT PORTFOLIO
TABLE 172.EMINENCE ORGANIC SKIN CARE: KEY EXECUTIVES
TABLE 173.EMINENCE ORGANIC SKIN CARE: COMPANY SNAPSHOT
TABLE 174.EMINENCE ORGANIC SKIN CARE: PRODUCT PORTFOLIO
TABLE 175.PROCTER & GAMBLE: KEY EXECUTIVES
TABLE 176.PROCTER & GAMBLE: COMPANY SNAPSHOT
TABLE 177.PROCTER & GAMBLE: PRODUCT PORTFOLIO
TABLE 178.TREO BRANDS LLC.: KEY EXECUTIVES
TABLE 179.TREO BRANDS LLC.: COMPANY SNAPSHOT
TABLE 180.TREO BRANDS LLC.: PRODUCT PORTFOLIO
TABLE 181.SUBLIME LIFE: KEY EXECUTIVES
TABLE 182.SUBLIME LIFE: COMPANY SNAPSHOT
TABLE 183.SUBLIME LIFE: PRODUCT PORTFOLIO
TABLE 184.JSC STRAIKAS.: KEY EXECUTIVES
TABLE 185.JSC STRAIKAS.: COMPANY SNAPSHOT
TABLE 186.JSC STRAIKAS: PRODUCT PORTFOLIO
TABLE 187.SIBBERI: KEY EXECUTIVES
TABLE 188.SIBBERI: COMPANY SNAPSHOT
TABLE 189.SIBBERI: PRODUCT PORTFOLIO
TABLE 190.BELSEVA: KEY EXECUTIVES
TABLE 191.BELSEVA: COMPANY SNAPSHOT
TABLE 192.BELSEVA: PRODUCT PORTFOLIO
TABLE 193.NATURE ON TAP LTD.: KEY EXECUTIVES
TABLE 194.NATURE ON TAP LTD.: COMPANY SNAPSHOT
TABLE 195.NATURE ON TAP LTD.: PRODUCT PORTFOLIO
LIST OF FIGURES
FIGURE 01.BIRCH WATER MARKET SNAPSHOT
FIGURE 02.BIRCH WATER MARKET SEGMENTATION
FIGURE 03.TOP INVESTMENT POCKETS, 2021–2031
FIGURE 04.HIGH BARGAINING POWER OF SUPPLIERS
FIGURE 05.MODERATE BARGAINING POWER OF BUYERS
FIGURE 06.HIGH THREAT OF NEW ENTRANTS
FIGURE 07.MODERATE THREAT OF SUBSTITUTION
FIGURE 08.MODERATE INTENSITY OF COMPETITIVE RIVALRY
FIGURE 09.MARKET PLAYER POSITIONING, 2021
FIGURE 10.BIRCH WATER MARKET: DRIVERS, RESTRAINTS, AND OPPORTUNITIES, 2021–2031
FIGURE 11.VALUE CHAIN ANALYSIS: BIRCH WATER MARKET
FIGURE 12.PARENT-PEER MARKET OUTLOOK, 2021
FIGURE 13.TOP IMPACTING FACTORS – BIRCH WATER MARKET, 2021 & 2031
FIGURE 14.MARKET SHARE ANALYSIS, BY TYPE, 2021 & 2031 (%)
FIGURE 15.MARKET SHARE ANALYSIS, BY APPLICATION, 2021 & 2031 (%)
FIGURE 16.MARKET SHARE ANALYSIS, BY NATURE, 2021 & 2031 (%)
FIGURE 17.MARKET SHARE ANALYSIS, BY DISTRIBUTION CHANNEL, 2021 & 2031 (%)
FIGURE 18.MARKET SHARE ANALYSIS, BY REGION, 2021 & 2031 (%)
FIGURE 19.BIRCH WATER MARKET, BY TYPE, 2021 (%)
FIGURE 20.COMPARATIVE SHARE ANALYSIS OF BIRCH WATER MARKET FOR CARBONATED , BY COUNTRY, 2021-2031 (%)
FIGURE 21.COMPARATIVE SHARE ANALYSIS OF BIRCH WATER MARKET FOR NON-CARBONATED, BY COUNTRY, 2021-2031 (%)
FIGURE 22.BIRCH WATER MARKET, BY APPLICATION, 2021 (%)
FIGURE 23.COMPARATIVE SHARE ANALYSIS OF BIRCH WATER MARKET FOR FOOD & BEVERAGES, BY COUNTRY, 2021-2031 (%)
FIGURE 24.COMPARATIVE SHARE ANALYSIS OF BIRCH WATER MARKET FOR NUTRACEUTICALS, BY COUNTRY, 2021-2031 (%)
FIGURE 25.COMPARATIVE SHARE ANALYSIS OF BIRCH WATER MARKET FOR PHARMACEUTICALS, BY COUNTRY, 2021-2031 (%)
FIGURE 26.COMPARATIVE SHARE ANALYSIS OF BIRCH WATER MARKET FOR PERSONAL CARE & COSMETICS, BY COUNTRY, 2021-2031 (%)
FIGURE 27.BIRCH WATER MARKET, BY NATURE, 2021 (%)
FIGURE 28.COMPARATIVE SHARE ANALYSIS OF BIRCH WATER MARKET FOR ORGANIC, BY COUNTRY, 2021-2031 (%)
FIGURE 29.COMPARATIVE SHARE ANALYSIS OF BIRCH WATER MARKET FOR CONVENTIONAL, BY COUNTRY, 2021-2031 (%)
FIGURE 30.BIRCH WATER MARKET, BY DISTRIBUTION CHANNEL, 2021 (%)
FIGURE 31.COMPARATIVE SHARE ANALYSIS OF BIRCH WATER MARKET FOR DIRECT DISTRIBUTION, BY COUNTRY, 2021-2031 (%)
FIGURE 32.COMPARATIVE SHARE ANALYSIS OF BIRCH WATER MARKET FOR RETAIL DISTRIBUTION, BY COUNTRY, 2021-2031 (%)
FIGURE 33.BIRCH WATER MARKET, BY REGION, 2021 (%)
FIGURE 34.U.S. BIRCH WATER MARKET, 2021–2031 ($MILLION)
FIGURE 35.CANADA BIRCH WATER MARKET, 2021–2031 ($MILLION)
FIGURE 36.MEXICO BIRCH WATER MARKET, 2021–2031 ($MILLION)
FIGURE 37.UK BIRCH WATER MARKET, 2021–2031 ($MILLION)
FIGURE 38.GERMANY BIRCH WATER MARKET, 2021–2031 ($MILLION)
FIGURE 39.FRANCE BIRCH WATER MARKET, 2021–2031 ($MILLION)
FIGURE 40.ITALY BIRCH WATER MARKET, 2021–2031 ($MILLION)
FIGURE 41.RUSSIA BIRCH WATER MARKET, 2021–2031 ($MILLION)
FIGURE 42.SPAIN BIRCH WATER MARKET, 2021–2031 ($MILLION)
FIGURE 43.REST OF EUROPE BIRCH WATER MARKET, 2021–2031 ($MILLION)
FIGURE 44.CHINA BIRCH WATER MARKET, 2021–2031 ($MILLION)
FIGURE 45.JAPAN BIRCH WATER MARKET, 2021–2031 ($MILLION)
FIGURE 46.INDIA BIRCH WATER MARKET, 2021–2031 ($MILLION)
FIGURE 47.SOUTH KOREA BIRCH WATER MARKET, 2021–2031 ($MILLION)
FIGURE 48.AUSTRALIA BIRCH WATER MARKET, 2021–2031 ($MILLION)
FIGURE 49.REST OF ASIA-PACIFIC BIRCH WATER MARKET, 2021–2031 ($MILLION)
FIGURE 50.BRAZIL BIRCH WATER MARKET, 2021–2031 ($MILLION)
FIGURE 51.ARGENTINA BIRCH WATER MARKET, 2021–2031 ($MILLION)
FIGURE 52.SOUTH AFRICA BIRCH WATER MARKET, 2021–2031 ($MILLION)
FIGURE 53.SAUDI ARABIA BIRCH WATER MARKET, 2021–2031 ($MILLION)
FIGURE 54.COLOMBIA BIRCH WATER MARKET, 2021–2031 ($MILLION)
FIGURE 55.TURKEY BIRCH WATER MARKET, 2021–2031 ($MILLION)
FIGURE 56.REST OF LAMEA BIRCH WATER MARKET, 2021–2031 ($MILLION)
FIGURE 57.COMPETITIVE DASHBOARD OF TOP 10 KEY PLAYERS
FIGURE 58.COMPETITIVE HEATMAP OF TOP 10 KEY PLAYERS
FIGURE 59.PRODUCT MAPPING OF TOP 10 KEY PLAYERS
Based on the insights of the CXOs, the global birch water market is expected to witness a strong growth in the near future owing to the rising preferences for vegan, non-GMO, preservative-free, gluten-free, and organic beverages among the health-conscious consumers. The growing demand for the functional and healthy food and beverages is a prominent driver of the birch water market. Moreover, the rising investments by the major players like Nature on Tap Ltd. and BelSeva on the introduction of tetra packaging to extend the shelf-life of the birch sap is expected to have a significant and positive impact on the growth of the birch water market in the foreseeable future. Furthermore, the rapidly growing popularity of the plant-based waters among the consumers is expected to fuel the demand for the birch sap owing to its nutritional and medicinal benefits.
The constant efforts by the various manufacturers in the pharmaceutical and cosmetics industry to introduce new and beneficial ingredients to manufacture innovative and organic products is fueling the demand for the birch water in nutraceuticals, pharmaceuticals, and personal care industries, globally. The ability of the birch water to treat hair loss, kidney stones, arthritis, and clarify skin is significantly boosting the demand for the birch water across various industry verticals.
A. The global birch water market size was valued at $1,223.9 million in 2021, and is estimated to reach $2,369.4 million by 2031, registering a CAGR of 7.6% from 2022 to 2031. Rising awareness among the consumers regarding the numerous health benefits of birch water is expected to boost the birch water market demand for direct consumption, during the forecast period.
A. The birch water market report is available on request on the website of Allied Market Research.
A. The forecast period considered in the global birch water market report is from 2022 to 2031. The report analyzes the market sizes from 2022 to 2031 along with the upcoming market trends and opportunities. The report also covers the key strategies adopted by the key players operating in the market.
A. The key players operating in the birch water industry includes The Birch Factory, Alaska Wild Harvest, LLC., Nordic Koivu Ltd, Vitalife Ltd, Eminence organic skin care, Procter & Gamble, Nature On Tap Ltd., Treo Brands LLC., Sublime life, JSC Straikas, Sibberi, and BelSeva.
A. According to the birch water market analysis, the birch water market is segregated based on type, application, nature, distribution channel, and region. By type, the market is segmented into carbonated and non-carbonated. Both the carbonated and non-carbonated segments as further bifurcated based on flavor into strawberry, blueberry, raspberry, apple ginger, lemon, unflavored, and others. Based on the application, it is segmented into food and beverages, nutraceuticals, pharmaceuticals, and personal care and cosmetics. Further, on the basis of nature, the market is bifurcated into organic and conventional segments. Depending on the distribution channel, the market is categorized into direct distribution and retail distribution. The retail distribution is further segmented into modern trade, convenience stores, online stores, and others. Region-wise, the birch water market is analyzed across North America, Europe, Asia-Pacific, and LAMEA (Latin America, Middle East, and Africa).
A. Asia-Pacific is expected to be the fastest-growing market during the forecast period. The market will grow at the highest CAGR of 8.2% owing to its huge population and rise in disposable income. Alon with these factors, rapid urbanization of the region and rising awareness towards the health benefit of birch water will also help the market to rise in the region.
A. Europe the dominated market with 39.8% of the revenue share, followed by North America with 33.3%. Europe comprises the UK, Germany, France, Italy, Russia, Spain, Rest of Europe. Europe has the major share of the birch water market and the consumption of birch water is increasing at a significant rate in Europe, owing to a rise in awareness of the health benefits of birch water.
Start reading instantly.
This Report and over 67,404+ more Reports, Available with Avenue Library. T&C*.
Enterprise
License/PDF
Library
Membership
*Taxes/Fees, if applicable will be added during checkout. All prices in USD
To ensure high-level data integrity, accurate analysis, and impeccable forecasts
For complete satisfaction
On-demand customization of scope of the report to exactly meet your needs
Targeted market view to provide pertinent information and save time of readers
Get insights on topics that are crucial for your business. Stay abreast of your interest areas.
Get Industry Data AlertsTo ensure high-level data integrity, accurate analysis, and impeccable forecasts
For complete satisfaction
On-demand customization of scope of the report to exactly meet your needs
Targeted market view to provide pertinent information and save time of readers