0
2022
Botulinum Toxin Market

Botulinum Toxin Market

by Product (Botulinum Toxin Type A, Botulinum Toxin Type B), by Application (Aesthetic, Therapeutic), by End User (Hospitals, Specialty and Dermatology Clinics, Others): Global Opportunity Analysis and Industry Forecast, 2021-2031

Report Code: A11935
Oct 2022 | Pages: 215
Tables: 141
Charts: 57
  • Formats*:

  • pdf

    Single User License, Five User
    License & Enterprise User License

  • xls

    Data Pack Excel License

  • ppt

    It comes with the additional cost
    of $2500.00 contact sales.


Botulinum Toxin Market Research, 2031

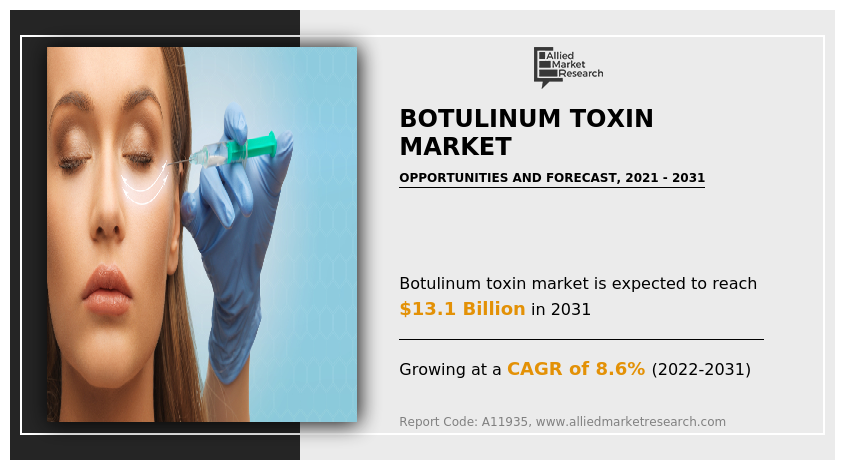
The global botulinum toxin market size was valued at $5.8 billion in 2021, and is projected to reach $13.1 billion by 2031, growing at a CAGR of 8.6% from 2022 to 2031. Botulinum toxin is a neurotoxin created by the anaerobic, gram-positive rod-shaped bacterium Clostridium botulinum, which is typically found on plants, in soil, water, and animal intestinal tracts. Botulinum toxin weakens striated muscles by preventing alpha motor neuron transmission at the neuromuscular junction. This has led to its use in diseases like dystonia that have overactive muscles. In addition, gamma neurons in muscle spindles are blocked during transmission, which may change the overactivity of reflexes. In addition, the toxin prevents all parasympathetic and cholinergic postganglionic sympathetic neurons from releasing acetylcholine. Furthermore, at present, it is one of the most common and widely performed aesthetic procedures in the world. The increase in concerns over aesthetic features in developed and developing regions have led to rise in the number of cosmetic procedures.

Non-essential procedures were cancelled due to the pandemic. Aesthetics procedures were considered non-emergency procedures that significantly hampered the revenue of aesthetic companies. In addition, a sudden sharp cut in monthly income of people had a negative impact on the growth of the botulinum toxin market.

Botulinum Toxin Market

Increase in demand for botulinum toxin is anticipated to increase globally during the forecast period, owing to the increase in geriatric population, rise in number of botulinum toxin procedure, and surge in self-awareness among people regarding aesthetic appearance. In addition, increase in investment by players in R&D, presence of robust pipeline candidates, rise in expenditure on the development of healthcare infrastructure and increasing affordability and amendments in reimbursement policies to cover botulinum injections further drive the botulinum toxin market growth. However, side effects associated with Botox procedures and high cost of procedures restrain the market growth in emerging countries. Conversely, growth potential of emerging economies is expected to offer lucrative growth opportunities for the key players in the market.

The botulinum toxin market size is segmented into Application, Product and End User. On the basis of product, the market is divided into botulinum toxin type A and botulinum toxin type B. On the basis of application, the botulinum toxin industry is classified into aesthetic and therapeutic. On the basis of end user, the market is classified into hospitals, Specialty and dermatology clinics and others. On the basis of region, the market is analyzed across North America, Europe, Asia-Pacific, and LAMEA.

By product, the botulinum toxin type A segment was the major revenue contributor in 2021, and is anticipated to continue this trend during the forecast period, owing to the rise in customer preference owing to advantages including minimal pain, no blood loss, and lack of scarring during the procedure. In addition, Botulinum toxin type-A has been increasingly utilized to treat chronic migraine, tension-type headache, and other primary neurological disorders which further boost the market growth. On the other side, botulinum toxin type B segment is projected to exhibit the fastest market growth during the forecast period, owing to the expansion of the therapeutic indication chronic sialorrhea, possible approval of the product in merging regions and growing research and development to study other possible therapeutic uses of Myobloc.

Botulinum Toxin Market

By application, the therapeutic segment garnered the major botulinum toxin market share in 2021, and is anticipated to continue this trend during the forecast period, owing to increase in R&D activities and various advantages of botulinum toxin to treat chronic disease such as chronic migraine and cervical dystonia are the key reasons for the growth of the market.

Botulinum Toxin Market

By end user, the specialty and dermatology clinics segment was the major revenue contributor in 2021, and is anticipated to continue this trend during the forecast period, owing to rise in prevalence of chronic disease and aesthetic problems such as frown lines, glabellar lines and crow’s feet. In addition, higher number of non-invasive cosmetic procedures performed in the specialty and dermatology clinics as compared to hospitals which further propel the segment growth.

Botulinum Toxin Market

By region, North America accounted for the major botulinum toxin market share in 2021, and is anticipated to maintain this trend during the forecast period owing to the rise in number of botulinum toxin procedures and increase in number of approvals for aesthetics products. In addition, presence of key players, and advancements in medical and aesthetic sector further boost the market growth. On the other hand, Asia Pacific is anticipated to register higher CAGR during botulinum toxin market forecast.

Botulinum Toxin Market

The major companies profiled in the botulinum toxin industry report include Merz Pharma GmbH And Co. Kgaa , Abbvie Inc (Allergan), Ipsen Group , Revance Therapeutics Inc, Medy-Tox, Inc., Hugel, Inc.,Galderma, Us Worldmed, Llc, Evolus Inc., and Daewoong Pharmaceutical.

Key Benefits For Stakeholders

  • This report provides a quantitative analysis of the market segments, current trends, estimations, and dynamics of the botulinum toxin market analysis from 2021 to 2031 to identify the prevailing botulinum toxin market opportunity.
  • The market research is offered along with information related to key drivers, restraints, and opportunities.
  • Porter's five forces analysis highlights the potency of buyers and suppliers to enable stakeholders make profit-oriented business decisions and strengthen their supplier-buyer network.
  • In-depth analysis of the botulinum toxin market segmentation assists to determine the prevailing market opportunities.
  • Major countries in each region are mapped according to their revenue contribution to the global market.
  • Market player positioning facilitates benchmarking and provides a clear understanding of the present position of the market players.
  • The report includes the analysis of the regional as well as global botulinum toxin market trends, key players, market segments, application areas, and market growth strategies.

Botulinum Toxin Market Report Highlights

Aspects Details
Market Size By 2031 USD 13.1 billion
Growth Rate CAGR of 8.6%
Forecast period 2021 - 2031
Report Pages 215
By Application
  • Aesthetic
  • Therapeutic
By Product
  • Botulinum Toxin Type A
  • Botulinum Toxin Type B
By End User
  • Hospitals
  • Specialty and Dermatology Clinics
  • Others
By Region
  • North America  (U.S., Canada, Mexico)
  • Europe  (Germany, France, UK, Italy, Spain, Rest of Europe)
  • Asia-Pacific  (Japan, China, Australia, India, South Korea, Rest of Asia-Pacific)
  • LAMEA  (Brazil, Saudi Arabia, South Africa, Rest of LAMEA)
Key Market Players Abbvie Inc (Allergan), Ipsen Group, Medy-Tox, Inc., GALDERMA, EVOLUS INC., MERZ PHARMA GMBH AND CO. KGAA, DAEWOONG PHARMACEUTICAL, REVANCE THERAPEUTICS INC, US WORLDMED, LLC, HUGEL, INC.
 
  • CHAPTER 1:INTRODUCTION

    • 1.1.Report description

    • 1.2.Key market segments

    • 1.3.Key benefits to the stakeholders

    • 1.4.Research Methodology

      • 1.4.1.Secondary research

      • 1.4.2.Primary research

      • 1.4.3.Analyst tools and models

  • CHAPTER 2:EXECUTIVE SUMMARY

    • 2.1.Key findings of the study

    • 2.2.CXO Perspective

  • CHAPTER 3:MARKET OVERVIEW

    • 3.1.Market definition and scope

    • 3.2.Key findings

      • 3.2.1.Top investment pockets

    • 3.3.Porter’s five forces analysis

    • 3.4.Top player positioning

    • 3.5.Market dynamics

      • 3.5.1.Drivers

      • 3.5.2.Restraints

      • 3.5.3.Opportunities

    • 3.6.COVID-19 Impact Analysis on the market

  • CHAPTER 4: BOTULINUM TOXIN MARKET, BY PRODUCT

    • 4.1 Overview

      • 4.1.1 Market size and forecast

    • 4.2 Botulinum Toxin Type A

      • 4.2.1 Key market trends, growth factors and opportunities

      • 4.2.2 Market size and forecast, by region

      • 4.2.3 Market share analysis by country

    • 4.3 Botulinum Toxin Type B

      • 4.3.1 Key market trends, growth factors and opportunities

      • 4.3.2 Market size and forecast, by region

      • 4.3.3 Market share analysis by country

  • CHAPTER 5: BOTULINUM TOXIN MARKET, BY APPLICATION

    • 5.1 Overview

      • 5.1.1 Market size and forecast

    • 5.2 Aesthetic

      • 5.2.1 Key market trends, growth factors and opportunities

      • 5.2.2 Market size and forecast, by region

      • 5.2.3 Market share analysis by country

    • 5.3 Therapeutic

      • 5.3.1 Key market trends, growth factors and opportunities

      • 5.3.2 Market size and forecast, by region

      • 5.3.3 Market share analysis by country

  • CHAPTER 6: BOTULINUM TOXIN MARKET, BY END USER

    • 6.1 Overview

      • 6.1.1 Market size and forecast

    • 6.2 Hospitals

      • 6.2.1 Key market trends, growth factors and opportunities

      • 6.2.2 Market size and forecast, by region

      • 6.2.3 Market share analysis by country

    • 6.3 Specialty and Dermatology Clinics

      • 6.3.1 Key market trends, growth factors and opportunities

      • 6.3.2 Market size and forecast, by region

      • 6.3.3 Market share analysis by country

    • 6.4 Others

      • 6.4.1 Key market trends, growth factors and opportunities

      • 6.4.2 Market size and forecast, by region

      • 6.4.3 Market share analysis by country

  • CHAPTER 7: BOTULINUM TOXIN MARKET, BY REGION

    • 7.1 Overview

      • 7.1.1 Market size and forecast

    • 7.2 North America

      • 7.2.1 Key trends and opportunities

      • 7.2.2 North America Market size and forecast, by Product

      • 7.2.3 North America Market size and forecast, by Application

      • 7.2.4 North America Market size and forecast, by End User

      • 7.2.5 North America Market size and forecast, by country

        • 7.2.5.1 U.S.
          • 7.2.5.1.1 Key market trends, growth factors and opportunities
          • 7.2.5.1.2 Market size and forecast, by Product
          • 7.2.5.1.3 Market size and forecast, by Application
          • 7.2.5.1.4 Market size and forecast, by End User
        • 7.2.5.2 Canada
          • 7.2.5.2.1 Key market trends, growth factors and opportunities
          • 7.2.5.2.2 Market size and forecast, by Product
          • 7.2.5.2.3 Market size and forecast, by Application
          • 7.2.5.2.4 Market size and forecast, by End User
        • 7.2.5.3 Mexico
          • 7.2.5.3.1 Key market trends, growth factors and opportunities
          • 7.2.5.3.2 Market size and forecast, by Product
          • 7.2.5.3.3 Market size and forecast, by Application
          • 7.2.5.3.4 Market size and forecast, by End User
    • 7.3 Europe

      • 7.3.1 Key trends and opportunities

      • 7.3.2 Europe Market size and forecast, by Product

      • 7.3.3 Europe Market size and forecast, by Application

      • 7.3.4 Europe Market size and forecast, by End User

      • 7.3.5 Europe Market size and forecast, by country

        • 7.3.5.1 Germany
          • 7.3.5.1.1 Key market trends, growth factors and opportunities
          • 7.3.5.1.2 Market size and forecast, by Product
          • 7.3.5.1.3 Market size and forecast, by Application
          • 7.3.5.1.4 Market size and forecast, by End User
        • 7.3.5.2 France
          • 7.3.5.2.1 Key market trends, growth factors and opportunities
          • 7.3.5.2.2 Market size and forecast, by Product
          • 7.3.5.2.3 Market size and forecast, by Application
          • 7.3.5.2.4 Market size and forecast, by End User
        • 7.3.5.3 UK
          • 7.3.5.3.1 Key market trends, growth factors and opportunities
          • 7.3.5.3.2 Market size and forecast, by Product
          • 7.3.5.3.3 Market size and forecast, by Application
          • 7.3.5.3.4 Market size and forecast, by End User
        • 7.3.5.4 Italy
          • 7.3.5.4.1 Key market trends, growth factors and opportunities
          • 7.3.5.4.2 Market size and forecast, by Product
          • 7.3.5.4.3 Market size and forecast, by Application
          • 7.3.5.4.4 Market size and forecast, by End User
        • 7.3.5.5 Spain
          • 7.3.5.5.1 Key market trends, growth factors and opportunities
          • 7.3.5.5.2 Market size and forecast, by Product
          • 7.3.5.5.3 Market size and forecast, by Application
          • 7.3.5.5.4 Market size and forecast, by End User
        • 7.3.5.6 Rest of Europe
          • 7.3.5.6.1 Key market trends, growth factors and opportunities
          • 7.3.5.6.2 Market size and forecast, by Product
          • 7.3.5.6.3 Market size and forecast, by Application
          • 7.3.5.6.4 Market size and forecast, by End User
    • 7.4 Asia-Pacific

      • 7.4.1 Key trends and opportunities

      • 7.4.2 Asia-Pacific Market size and forecast, by Product

      • 7.4.3 Asia-Pacific Market size and forecast, by Application

      • 7.4.4 Asia-Pacific Market size and forecast, by End User

      • 7.4.5 Asia-Pacific Market size and forecast, by country

        • 7.4.5.1 Japan
          • 7.4.5.1.1 Key market trends, growth factors and opportunities
          • 7.4.5.1.2 Market size and forecast, by Product
          • 7.4.5.1.3 Market size and forecast, by Application
          • 7.4.5.1.4 Market size and forecast, by End User
        • 7.4.5.2 China
          • 7.4.5.2.1 Key market trends, growth factors and opportunities
          • 7.4.5.2.2 Market size and forecast, by Product
          • 7.4.5.2.3 Market size and forecast, by Application
          • 7.4.5.2.4 Market size and forecast, by End User
        • 7.4.5.3 Australia
          • 7.4.5.3.1 Key market trends, growth factors and opportunities
          • 7.4.5.3.2 Market size and forecast, by Product
          • 7.4.5.3.3 Market size and forecast, by Application
          • 7.4.5.3.4 Market size and forecast, by End User
        • 7.4.5.4 India
          • 7.4.5.4.1 Key market trends, growth factors and opportunities
          • 7.4.5.4.2 Market size and forecast, by Product
          • 7.4.5.4.3 Market size and forecast, by Application
          • 7.4.5.4.4 Market size and forecast, by End User
        • 7.4.5.5 South Korea
          • 7.4.5.5.1 Key market trends, growth factors and opportunities
          • 7.4.5.5.2 Market size and forecast, by Product
          • 7.4.5.5.3 Market size and forecast, by Application
          • 7.4.5.5.4 Market size and forecast, by End User
        • 7.4.5.6 Rest of Asia-Pacific
          • 7.4.5.6.1 Key market trends, growth factors and opportunities
          • 7.4.5.6.2 Market size and forecast, by Product
          • 7.4.5.6.3 Market size and forecast, by Application
          • 7.4.5.6.4 Market size and forecast, by End User
    • 7.5 LAMEA

      • 7.5.1 Key trends and opportunities

      • 7.5.2 LAMEA Market size and forecast, by Product

      • 7.5.3 LAMEA Market size and forecast, by Application

      • 7.5.4 LAMEA Market size and forecast, by End User

      • 7.5.5 LAMEA Market size and forecast, by country

        • 7.5.5.1 Brazil
          • 7.5.5.1.1 Key market trends, growth factors and opportunities
          • 7.5.5.1.2 Market size and forecast, by Product
          • 7.5.5.1.3 Market size and forecast, by Application
          • 7.5.5.1.4 Market size and forecast, by End User
        • 7.5.5.2 Saudi Arabia
          • 7.5.5.2.1 Key market trends, growth factors and opportunities
          • 7.5.5.2.2 Market size and forecast, by Product
          • 7.5.5.2.3 Market size and forecast, by Application
          • 7.5.5.2.4 Market size and forecast, by End User
        • 7.5.5.3 South Africa
          • 7.5.5.3.1 Key market trends, growth factors and opportunities
          • 7.5.5.3.2 Market size and forecast, by Product
          • 7.5.5.3.3 Market size and forecast, by Application
          • 7.5.5.3.4 Market size and forecast, by End User
        • 7.5.5.4 Rest of LAMEA
          • 7.5.5.4.1 Key market trends, growth factors and opportunities
          • 7.5.5.4.2 Market size and forecast, by Product
          • 7.5.5.4.3 Market size and forecast, by Application
          • 7.5.5.4.4 Market size and forecast, by End User
  • CHAPTER 8: COMPANY LANDSCAPE

    • 8.1. Introduction

    • 8.2. Top winning strategies

    • 8.3. Product Mapping of Top 10 Player

    • 8.4. Competitive Dashboard

    • 8.5. Competitive Heatmap

    • 8.6. Key developments

  • CHAPTER 9: COMPANY PROFILES

    • 9.1 REVANCE THERAPEUTICS INC

      • 9.1.1 Company overview

      • 9.1.2 Company snapshot

      • 9.1.3 Operating business segments

      • 9.1.4 Product portfolio

      • 9.1.5 Business performance

      • 9.1.6 Key strategic moves and developments

    • 9.2 Medy-Tox, Inc.

      • 9.2.1 Company overview

      • 9.2.2 Company snapshot

      • 9.2.3 Operating business segments

      • 9.2.4 Product portfolio

      • 9.2.5 Business performance

      • 9.2.6 Key strategic moves and developments

    • 9.3 galderma

      • 9.3.1 Company overview

      • 9.3.2 Company snapshot

      • 9.3.3 Operating business segments

      • 9.3.4 Product portfolio

      • 9.3.5 Business performance

      • 9.3.6 Key strategic moves and developments

    • 9.4 US WORLDMED, LLC

      • 9.4.1 Company overview

      • 9.4.2 Company snapshot

      • 9.4.3 Operating business segments

      • 9.4.4 Product portfolio

      • 9.4.5 Business performance

      • 9.4.6 Key strategic moves and developments

    • 9.5 Abbvie Inc (Allergan)

      • 9.5.1 Company overview

      • 9.5.2 Company snapshot

      • 9.5.3 Operating business segments

      • 9.5.4 Product portfolio

      • 9.5.5 Business performance

      • 9.5.6 Key strategic moves and developments

    • 9.6 DAEWOONG PHARMACEUTICAL

      • 9.6.1 Company overview

      • 9.6.2 Company snapshot

      • 9.6.3 Operating business segments

      • 9.6.4 Product portfolio

      • 9.6.5 Business performance

      • 9.6.6 Key strategic moves and developments

    • 9.7 Ipsen Group

      • 9.7.1 Company overview

      • 9.7.2 Company snapshot

      • 9.7.3 Operating business segments

      • 9.7.4 Product portfolio

      • 9.7.5 Business performance

      • 9.7.6 Key strategic moves and developments

    • 9.8 MERZ PHARMA GMBH AND CO. KGAA

      • 9.8.1 Company overview

      • 9.8.2 Company snapshot

      • 9.8.3 Operating business segments

      • 9.8.4 Product portfolio

      • 9.8.5 Business performance

      • 9.8.6 Key strategic moves and developments

    • 9.9 HUGEL, INC.

      • 9.9.1 Company overview

      • 9.9.2 Company snapshot

      • 9.9.3 Operating business segments

      • 9.9.4 Product portfolio

      • 9.9.5 Business performance

      • 9.9.6 Key strategic moves and developments

    • 9.10 EVOLUS INC.

      • 9.10.1 Company overview

      • 9.10.2 Company snapshot

      • 9.10.3 Operating business segments

      • 9.10.4 Product portfolio

      • 9.10.5 Business performance

      • 9.10.6 Key strategic moves and developments

  • LIST OF TABLES

  • TABLE 1. GLOBAL BOTULINUM TOXIN MARKET, BY PRODUCT, 2021-2031 (REVENUE, $MILLION)
    TABLE 2. BOTULINUM TOXIN MARKET FOR BOTULINUM TOXIN TYPE A, BY REGION, 2021-2031 (REVENUE, $MILLION)
    TABLE 3. BOTULINUM TOXIN MARKET FOR BOTULINUM TOXIN TYPE A, BY COUNTRY, 2021-2031 (REVENUE, $MILLION)
    TABLE 4. BOTULINUM TOXIN MARKET FOR BOTULINUM TOXIN TYPE B, BY REGION, 2021-2031 (REVENUE, $MILLION)
    TABLE 5. BOTULINUM TOXIN MARKET FOR BOTULINUM TOXIN TYPE B, BY COUNTRY, 2021-2031 (REVENUE, $MILLION)
    TABLE 6. GLOBAL BOTULINUM TOXIN MARKET, BY APPLICATION, 2021-2031 (REVENUE, $MILLION)
    TABLE 7. BOTULINUM TOXIN MARKET FOR AESTHETIC, BY REGION, 2021-2031 (REVENUE, $MILLION)
    TABLE 8. BOTULINUM TOXIN MARKET FOR AESTHETIC, BY COUNTRY, 2021-2031 (REVENUE, $MILLION)
    TABLE 9. BOTULINUM TOXIN MARKET FOR THERAPEUTIC, BY REGION, 2021-2031 (REVENUE, $MILLION)
    TABLE 10. BOTULINUM TOXIN MARKET FOR THERAPEUTIC, BY COUNTRY, 2021-2031 (REVENUE, $MILLION)
    TABLE 11. GLOBAL BOTULINUM TOXIN MARKET, BY END USER, 2021-2031 (REVENUE, $MILLION)
    TABLE 12. BOTULINUM TOXIN MARKET FOR HOSPITALS, BY REGION, 2021-2031 (REVENUE, $MILLION)
    TABLE 13. BOTULINUM TOXIN MARKET FOR HOSPITALS, BY COUNTRY, 2021-2031 (REVENUE, $MILLION)
    TABLE 14. BOTULINUM TOXIN MARKET FOR SPECIALTY AND DERMATOLOGY CLINICS, BY REGION, 2021-2031 (REVENUE, $MILLION)
    TABLE 15. BOTULINUM TOXIN MARKET FOR SPECIALTY AND DERMATOLOGY CLINICS, BY COUNTRY, 2021-2031 (REVENUE, $MILLION)
    TABLE 16. BOTULINUM TOXIN MARKET FOR OTHERS, BY REGION, 2021-2031 (REVENUE, $MILLION)
    TABLE 17. BOTULINUM TOXIN MARKET FOR OTHERS, BY COUNTRY, 2021-2031 (REVENUE, $MILLION)
    TABLE 18. BOTULINUM TOXIN MARKET, BY REGION, 2021-2031 (REVENUE, $MILLION)
    TABLE 19. NORTH AMERICA BOTULINUM TOXIN MARKET, BY PRODUCT, 2021-2031 (REVENUE, $MILLION)
    TABLE 20. NORTH AMERICA BOTULINUM TOXIN MARKET, BY APPLICATION, 2021-2031 (REVENUE, $MILLION)
    TABLE 21. NORTH AMERICA BOTULINUM TOXIN MARKET, BY END USER, 2021-2031 (REVENUE, $MILLION)
    TABLE 22. NORTH AMERICA BOTULINUM TOXIN MARKET, BY COUNTRY, 2021-2031 (REVENUE, $MILLION)
    TABLE 23. U.S. BOTULINUM TOXIN MARKET, BY PRODUCT, 2021-2031 (REVENUE, $MILLION)
    TABLE 24. U.S. BOTULINUM TOXIN MARKET, BY APPLICATION, 2021-2031 (REVENUE, $MILLION)
    TABLE 25. U.S. BOTULINUM TOXIN MARKET, BY END USER, 2021-2031 (REVENUE, $MILLION)
    TABLE 26. CANADA BOTULINUM TOXIN MARKET, BY PRODUCT, 2021-2031 (REVENUE, $MILLION)
    TABLE 27. CANADA BOTULINUM TOXIN MARKET, BY APPLICATION, 2021-2031 (REVENUE, $MILLION)
    TABLE 28. CANADA BOTULINUM TOXIN MARKET, BY END USER, 2021-2031 (REVENUE, $MILLION)
    TABLE 29. MEXICO BOTULINUM TOXIN MARKET, BY PRODUCT, 2021-2031 (REVENUE, $MILLION)
    TABLE 30. MEXICO BOTULINUM TOXIN MARKET, BY APPLICATION, 2021-2031 (REVENUE, $MILLION)
    TABLE 31. MEXICO BOTULINUM TOXIN MARKET, BY END USER, 2021-2031 (REVENUE, $MILLION)
    TABLE 32. EUROPE BOTULINUM TOXIN MARKET, BY PRODUCT, 2021-2031 (REVENUE, $MILLION)
    TABLE 33. EUROPE BOTULINUM TOXIN MARKET, BY APPLICATION, 2021-2031 (REVENUE, $MILLION)
    TABLE 34. EUROPE BOTULINUM TOXIN MARKET, BY END USER, 2021-2031 (REVENUE, $MILLION)
    TABLE 35. EUROPE BOTULINUM TOXIN MARKET, BY COUNTRY, 2021-2031 (REVENUE, $MILLION)
    TABLE 36. GERMANY BOTULINUM TOXIN MARKET, BY PRODUCT, 2021-2031 (REVENUE, $MILLION)
    TABLE 37. GERMANY BOTULINUM TOXIN MARKET, BY APPLICATION, 2021-2031 (REVENUE, $MILLION)
    TABLE 38. GERMANY BOTULINUM TOXIN MARKET, BY END USER, 2021-2031 (REVENUE, $MILLION)
    TABLE 39. FRANCE BOTULINUM TOXIN MARKET, BY PRODUCT, 2021-2031 (REVENUE, $MILLION)
    TABLE 40. FRANCE BOTULINUM TOXIN MARKET, BY APPLICATION, 2021-2031 (REVENUE, $MILLION)
    TABLE 41. FRANCE BOTULINUM TOXIN MARKET, BY END USER, 2021-2031 (REVENUE, $MILLION)
    TABLE 42. UK BOTULINUM TOXIN MARKET, BY PRODUCT, 2021-2031 (REVENUE, $MILLION)
    TABLE 43. UK BOTULINUM TOXIN MARKET, BY APPLICATION, 2021-2031 (REVENUE, $MILLION)
    TABLE 44. UK BOTULINUM TOXIN MARKET, BY END USER, 2021-2031 (REVENUE, $MILLION)
    TABLE 45. ITALY BOTULINUM TOXIN MARKET, BY PRODUCT, 2021-2031 (REVENUE, $MILLION)
    TABLE 46. ITALY BOTULINUM TOXIN MARKET, BY APPLICATION, 2021-2031 (REVENUE, $MILLION)
    TABLE 47. ITALY BOTULINUM TOXIN MARKET, BY END USER, 2021-2031 (REVENUE, $MILLION)
    TABLE 48. SPAIN BOTULINUM TOXIN MARKET, BY PRODUCT, 2021-2031 (REVENUE, $MILLION)
    TABLE 49. SPAIN BOTULINUM TOXIN MARKET, BY APPLICATION, 2021-2031 (REVENUE, $MILLION)
    TABLE 50. SPAIN BOTULINUM TOXIN MARKET, BY END USER, 2021-2031 (REVENUE, $MILLION)
    TABLE 51. REST OF EUROPE BOTULINUM TOXIN MARKET, BY PRODUCT, 2021-2031 (REVENUE, $MILLION)
    TABLE 52. REST OF EUROPE BOTULINUM TOXIN MARKET, BY APPLICATION, 2021-2031 (REVENUE, $MILLION)
    TABLE 53. REST OF EUROPE BOTULINUM TOXIN MARKET, BY END USER, 2021-2031 (REVENUE, $MILLION)
    TABLE 54. ASIA-PACIFIC BOTULINUM TOXIN MARKET, BY PRODUCT, 2021-2031 (REVENUE, $MILLION)
    TABLE 55. ASIA-PACIFIC BOTULINUM TOXIN MARKET, BY APPLICATION, 2021-2031 (REVENUE, $MILLION)
    TABLE 56. ASIA-PACIFIC BOTULINUM TOXIN MARKET, BY END USER, 2021-2031 (REVENUE, $MILLION)
    TABLE 57. ASIA-PACIFIC BOTULINUM TOXIN MARKET, BY COUNTRY, 2021-2031 (REVENUE, $MILLION)
    TABLE 58. JAPAN BOTULINUM TOXIN MARKET, BY PRODUCT, 2021-2031 (REVENUE, $MILLION)
    TABLE 59. JAPAN BOTULINUM TOXIN MARKET, BY APPLICATION, 2021-2031 (REVENUE, $MILLION)
    TABLE 60. JAPAN BOTULINUM TOXIN MARKET, BY END USER, 2021-2031 (REVENUE, $MILLION)
    TABLE 61. CHINA BOTULINUM TOXIN MARKET, BY PRODUCT, 2021-2031 (REVENUE, $MILLION)
    TABLE 62. CHINA BOTULINUM TOXIN MARKET, BY APPLICATION, 2021-2031 (REVENUE, $MILLION)
    TABLE 63. CHINA BOTULINUM TOXIN MARKET, BY END USER, 2021-2031 (REVENUE, $MILLION)
    TABLE 64. AUSTRALIA BOTULINUM TOXIN MARKET, BY PRODUCT, 2021-2031 (REVENUE, $MILLION)
    TABLE 65. AUSTRALIA BOTULINUM TOXIN MARKET, BY APPLICATION, 2021-2031 (REVENUE, $MILLION)
    TABLE 66. AUSTRALIA BOTULINUM TOXIN MARKET, BY END USER, 2021-2031 (REVENUE, $MILLION)
    TABLE 67. INDIA BOTULINUM TOXIN MARKET, BY PRODUCT, 2021-2031 (REVENUE, $MILLION)
    TABLE 68. INDIA BOTULINUM TOXIN MARKET, BY APPLICATION, 2021-2031 (REVENUE, $MILLION)
    TABLE 69. INDIA BOTULINUM TOXIN MARKET, BY END USER, 2021-2031 (REVENUE, $MILLION)
    TABLE 70. SOUTH KOREA BOTULINUM TOXIN MARKET, BY PRODUCT, 2021-2031 (REVENUE, $MILLION)
    TABLE 71. SOUTH KOREA BOTULINUM TOXIN MARKET, BY APPLICATION, 2021-2031 (REVENUE, $MILLION)
    TABLE 72. SOUTH KOREA BOTULINUM TOXIN MARKET, BY END USER, 2021-2031 (REVENUE, $MILLION)
    TABLE 73. REST OF ASIA-PACIFIC BOTULINUM TOXIN MARKET, BY PRODUCT, 2021-2031 (REVENUE, $MILLION)
    TABLE 74. REST OF ASIA-PACIFIC BOTULINUM TOXIN MARKET, BY APPLICATION, 2021-2031 (REVENUE, $MILLION)
    TABLE 75. REST OF ASIA-PACIFIC BOTULINUM TOXIN MARKET, BY END USER, 2021-2031 (REVENUE, $MILLION)
    TABLE 76. LAMEA BOTULINUM TOXIN MARKET, BY PRODUCT, 2021-2031 (REVENUE, $MILLION)
    TABLE 77. LAMEA BOTULINUM TOXIN MARKET, BY APPLICATION, 2021-2031 (REVENUE, $MILLION)
    TABLE 78. LAMEA BOTULINUM TOXIN MARKET, BY END USER, 2021-2031 (REVENUE, $MILLION)
    TABLE 79. LAMEA BOTULINUM TOXIN MARKET, BY COUNTRY, 2021-2031 (REVENUE, $MILLION)
    TABLE 80. BRAZIL BOTULINUM TOXIN MARKET, BY PRODUCT, 2021-2031 (REVENUE, $MILLION)
    TABLE 81. BRAZIL BOTULINUM TOXIN MARKET, BY APPLICATION, 2021-2031 (REVENUE, $MILLION)
    TABLE 82. BRAZIL BOTULINUM TOXIN MARKET, BY END USER, 2021-2031 (REVENUE, $MILLION)
    TABLE 83. SAUDI ARABIA BOTULINUM TOXIN MARKET, BY PRODUCT, 2021-2031 (REVENUE, $MILLION)
    TABLE 84. SAUDI ARABIA BOTULINUM TOXIN MARKET, BY APPLICATION, 2021-2031 (REVENUE, $MILLION)
    TABLE 85. SAUDI ARABIA BOTULINUM TOXIN MARKET, BY END USER, 2021-2031 (REVENUE, $MILLION)
    TABLE 86. SOUTH AFRICA BOTULINUM TOXIN MARKET, BY PRODUCT, 2021-2031 (REVENUE, $MILLION)
    TABLE 87. SOUTH AFRICA BOTULINUM TOXIN MARKET, BY APPLICATION, 2021-2031 (REVENUE, $MILLION)
    TABLE 88. SOUTH AFRICA BOTULINUM TOXIN MARKET, BY END USER, 2021-2031 (REVENUE, $MILLION)
    TABLE 89. REST OF LAMEA BOTULINUM TOXIN MARKET, BY PRODUCT, 2021-2031 (REVENUE, $MILLION)
    TABLE 90. REST OF LAMEA BOTULINUM TOXIN MARKET, BY APPLICATION, 2021-2031 (REVENUE, $MILLION)
    TABLE 91. REST OF LAMEA BOTULINUM TOXIN MARKET, BY END USER, 2021-2031 (REVENUE, $MILLION)
    TABLE 92.REVANCE THERAPEUTICS INC: COMPANY SNAPSHOT
    TABLE 93.REVANCE THERAPEUTICS INC: OPERATING SEGMENTS
    TABLE 94.REVANCE THERAPEUTICS INC: PRODUCT PORTFOLIO
    TABLE 95.REVANCE THERAPEUTICS INC: NET SALES
    TABLE 96.REVANCE THERAPEUTICS INC: KEY STRATERGIES
    TABLE 97.MEDY-TOX, INC.: COMPANY SNAPSHOT
    TABLE 98.MEDY-TOX, INC.: OPERATING SEGMENTS
    TABLE 99.MEDY-TOX, INC.: PRODUCT PORTFOLIO
    TABLE 100.MEDY-TOX, INC.: NET SALES
    TABLE 101.MEDY-TOX, INC.: KEY STRATERGIES
    TABLE 102.GALDERMA: COMPANY SNAPSHOT
    TABLE 103.GALDERMA: OPERATING SEGMENTS
    TABLE 104.GALDERMA: PRODUCT PORTFOLIO
    TABLE 105.GALDERMA: NET SALES
    TABLE 106.GALDERMA: KEY STRATERGIES
    TABLE 107.US WORLDMED, LLC: COMPANY SNAPSHOT
    TABLE 108.US WORLDMED, LLC: OPERATING SEGMENTS
    TABLE 109.US WORLDMED, LLC: PRODUCT PORTFOLIO
    TABLE 110.US WORLDMED, LLC: NET SALES
    TABLE 111.US WORLDMED, LLC: KEY STRATERGIES
    TABLE 112.ABBVIE INC (ALLERGAN): COMPANY SNAPSHOT
    TABLE 113.ABBVIE INC (ALLERGAN): OPERATING SEGMENTS
    TABLE 114.ABBVIE INC (ALLERGAN): PRODUCT PORTFOLIO
    TABLE 115.ABBVIE INC (ALLERGAN): NET SALES
    TABLE 116.ABBVIE INC (ALLERGAN): KEY STRATERGIES
    TABLE 117.DAEWOONG PHARMACEUTICAL: COMPANY SNAPSHOT
    TABLE 118.DAEWOONG PHARMACEUTICAL: OPERATING SEGMENTS
    TABLE 119.DAEWOONG PHARMACEUTICAL: PRODUCT PORTFOLIO
    TABLE 120.DAEWOONG PHARMACEUTICAL: NET SALES
    TABLE 121.DAEWOONG PHARMACEUTICAL: KEY STRATERGIES
    TABLE 122.IPSEN GROUP: COMPANY SNAPSHOT
    TABLE 123.IPSEN GROUP: OPERATING SEGMENTS
    TABLE 124.IPSEN GROUP: PRODUCT PORTFOLIO
    TABLE 125.IPSEN GROUP: NET SALES
    TABLE 126.IPSEN GROUP: KEY STRATERGIES
    TABLE 127.MERZ PHARMA GMBH AND CO. KGAA: COMPANY SNAPSHOT
    TABLE 128.MERZ PHARMA GMBH AND CO. KGAA: OPERATING SEGMENTS
    TABLE 129.MERZ PHARMA GMBH AND CO. KGAA: PRODUCT PORTFOLIO
    TABLE 130.MERZ PHARMA GMBH AND CO. KGAA: NET SALES
    TABLE 131.MERZ PHARMA GMBH AND CO. KGAA: KEY STRATERGIES
    TABLE 132.HUGEL, INC.: COMPANY SNAPSHOT
    TABLE 133.HUGEL, INC.: OPERATING SEGMENTS
    TABLE 134.HUGEL, INC.: PRODUCT PORTFOLIO
    TABLE 135.HUGEL, INC.: NET SALES
    TABLE 136.HUGEL, INC.: KEY STRATERGIES
    TABLE 137.EVOLUS INC.: COMPANY SNAPSHOT
    TABLE 138.EVOLUS INC.: OPERATING SEGMENTS
    TABLE 139.EVOLUS INC.: PRODUCT PORTFOLIO
    TABLE 140.EVOLUS INC.: NET SALES
    TABLE 141.EVOLUS INC.: KEY STRATERGIES
  • LIST OF FIGURES

  • FIGURE 1.BOTULINUM TOXIN MARKET SEGMENTATION
    FIGURE 2.BOTULINUM TOXIN MARKET,2021-2031
    FIGURE 3.BOTULINUM TOXIN MARKET,2021-2031
    FIGURE 4. TOP INVESTMENT POCKETS, BY REGION
    FIGURE 5.PORTER FIVE-1
    FIGURE 6.PORTER FIVE-2
    FIGURE 7.PORTER FIVE-3
    FIGURE 8.PORTER FIVE-4
    FIGURE 9.PORTER FIVE-5
    FIGURE 10.TOP PLAYER POSITIONING
    FIGURE 11.BOTULINUM TOXIN MARKET:DRIVERS, RESTRAINTS AND OPPORTUNITIES
    FIGURE 12.BOTULINUM TOXIN MARKET,BY PRODUCT,2021(%)
    FIGURE 13.COMPARATIVE SHARE ANALYSIS OF BOTULINUM TOXIN TYPE A BOTULINUM TOXIN MARKET,2021-2031(%)
    FIGURE 14.COMPARATIVE SHARE ANALYSIS OF BOTULINUM TOXIN TYPE B BOTULINUM TOXIN MARKET,2021-2031(%)
    FIGURE 15.BOTULINUM TOXIN MARKET,BY APPLICATION,2021(%)
    FIGURE 16.COMPARATIVE SHARE ANALYSIS OF AESTHETIC BOTULINUM TOXIN MARKET,2021-2031(%)
    FIGURE 17.COMPARATIVE SHARE ANALYSIS OF THERAPEUTIC BOTULINUM TOXIN MARKET,2021-2031(%)
    FIGURE 18.BOTULINUM TOXIN MARKET,BY END USER,2021(%)
    FIGURE 19.COMPARATIVE SHARE ANALYSIS OF HOSPITALS BOTULINUM TOXIN MARKET,2021-2031(%)
    FIGURE 20.COMPARATIVE SHARE ANALYSIS OF SPECIALTY AND DERMATOLOGY CLINICS BOTULINUM TOXIN MARKET,2021-2031(%)
    FIGURE 21.COMPARATIVE SHARE ANALYSIS OF OTHERS BOTULINUM TOXIN MARKET,2021-2031(%)
    FIGURE 22.BOTULINUM TOXIN MARKET BY REGION,2021
    FIGURE 23.U.S. BOTULINUM TOXIN MARKET,2021-2031($MILLION)
    FIGURE 24.CANADA BOTULINUM TOXIN MARKET,2021-2031($MILLION)
    FIGURE 25.MEXICO BOTULINUM TOXIN MARKET,2021-2031($MILLION)
    FIGURE 26.GERMANY BOTULINUM TOXIN MARKET,2021-2031($MILLION)
    FIGURE 27.FRANCE BOTULINUM TOXIN MARKET,2021-2031($MILLION)
    FIGURE 28.UK BOTULINUM TOXIN MARKET,2021-2031($MILLION)
    FIGURE 29.ITALY BOTULINUM TOXIN MARKET,2021-2031($MILLION)
    FIGURE 30.SPAIN BOTULINUM TOXIN MARKET,2021-2031($MILLION)
    FIGURE 31.REST OF EUROPE BOTULINUM TOXIN MARKET,2021-2031($MILLION)
    FIGURE 32.JAPAN BOTULINUM TOXIN MARKET,2021-2031($MILLION)
    FIGURE 33.CHINA BOTULINUM TOXIN MARKET,2021-2031($MILLION)
    FIGURE 34.AUSTRALIA BOTULINUM TOXIN MARKET,2021-2031($MILLION)
    FIGURE 35.INDIA BOTULINUM TOXIN MARKET,2021-2031($MILLION)
    FIGURE 36.SOUTH KOREA BOTULINUM TOXIN MARKET,2021-2031($MILLION)
    FIGURE 37.REST OF ASIA-PACIFIC BOTULINUM TOXIN MARKET,2021-2031($MILLION)
    FIGURE 38.BRAZIL BOTULINUM TOXIN MARKET,2021-2031($MILLION)
    FIGURE 39.SAUDI ARABIA BOTULINUM TOXIN MARKET,2021-2031($MILLION)
    FIGURE 40.SOUTH AFRICA BOTULINUM TOXIN MARKET,2021-2031($MILLION)
    FIGURE 41.REST OF LAMEA BOTULINUM TOXIN MARKET,2021-2031($MILLION)
    FIGURE 42. TOP WINNING STRATEGIES, BY YEAR
    FIGURE 43. TOP WINNING STRATEGIES, BY DEVELOPMENT
    FIGURE 44. TOP WINNING STRATEGIES, BY COMPANY
    FIGURE 45.PRODUCT MAPPING OF TOP 10 PLAYERS
    FIGURE 46.COMPETITIVE DASHBOARD
    FIGURE 47.COMPETITIVE HEATMAP OF TOP 10 KEY PLAYERS
    FIGURE 48.REVANCE THERAPEUTICS INC.: NET SALES ($MILLION)
    FIGURE 49.MEDY-TOX, INC..: NET SALES ($MILLION)
    FIGURE 50.GALDERMA.: NET SALES ($MILLION)
    FIGURE 51.US WORLDMED, LLC.: NET SALES ($MILLION)
    FIGURE 52.ABBVIE INC (ALLERGAN).: NET SALES ($MILLION)
    FIGURE 53.DAEWOONG PHARMACEUTICAL.: NET SALES ($MILLION)
    FIGURE 54.IPSEN GROUP.: NET SALES ($MILLION)
    FIGURE 55.MERZ PHARMA GMBH AND CO. KGAA.: NET SALES ($MILLION)
    FIGURE 56.HUGEL, INC..: NET SALES ($MILLION)
    FIGURE 57.EVOLUS INC..: NET SALES ($MILLION)


This section provides various opinions of the top-level CXOs in the botulinum toxin industry. In accordance with several interviews conducted, the utilization of botulinum toxin is expected to witness a significant rise owing to increase in non-invasive cosmetic procedures in both developed and developing economies.

Furthermore, the global botulinum toxin market growth is propelled by surge in geriatric population, increase in collaboration between pharmaceutical companies for development of botulinum toxin products, and rise in awareness associated with physical appearance.

North America accounted for the highest market share in 2021, due to growing number of cosmetic procedures, and heavy expenditure by the government on healthcare, followed by Europe and Asia-Pacific. Asia-Pacific is expected to exhibit fastest market growth due to increase in geriatric population. Pharmaceutical companies have focused on expanding their presence in emerging economies, which is anticipated to drive the market growth.

PURCHASE OPTIONS

Call or Email us

U.S.-Canada Toll-free: +1-800-792-5285
Int'l : +1-503-894-6022
Europe : +44-845-528-1300
Email : help@alliedmarketresearch.com
 
FREQUENTLY ASKED QUESTIONS?

A. The top companies that hold the market share in botulinum toxin market are Merz Pharma GmbH And Co. Kgaa , Abbvie Inc (Allergan) ,Ipsen Group , Revance Therapeutics Inc.,Us Worldmed

A. The key trends in the botulinum toxin Market are increase in investment by players in R&D, the presence of robust pipeline candidates, rise in expenditure on the development of healthcare infrastructure and increasing affordability and amendments in reimbursement policies to cover botulinum injections.

A. The forecast period in the report is from 2022 to 2031

A. North America is the largest regional market for Botulinum Toxin

A. The total market value of botulinum toxin market is $13132.72 Million in 2031

Looking for Customization?

 Customization Request

Have a Question?

 Speak with Analyst

Any Confusion?

 Inquire Before Buying

Have a glance of the Report

  Request Sample
RELATED TAGS

Purchase Full Report of
Botulinum Toxin Market

Start reading instantly.
This Report and over 68,113+ more Reports, Available with Avenue Library. T&C*.

  • Online Only
  • $3,570
  • Online cloud access only
  • Restricted print, copy, paste & download
  • Read only
  • Free industry update
    (Within 180 days)
  • Free report update in next update cycle
    (Oct 2023 - Oct 2024)
  • Data Pack
  • $3,840
  • Restricted to one authorized user
  • One print only
  • Available in
    Excel
  • Free industry update
    (Within 180 days)
  •   Free report update in next update cycle
    (Oct 2023 - Oct 2024)
  • Single User
  • $5,730
  • Restricted to one authorized user
  • One print only
  • Available in
    PDF
  • Free industry update
    (Within 180 days)
  •   Free report update in next update cycle
    (Oct 2023 - Oct 2024)
  • Five Users
  • $6,450
  • Limited to five authorized users
  • Print upto five copies
  • Available in
    PDF
  • Free industry update
    (Within 180 days)
  •   Free report update in next update cycle
    (Oct 2023 - Oct 2024)
  • Enterprise
    License/PDF

  • $9,600
  • Unlimited
    within
    company/enterprise
  • Available in Excel & PDF
  • Free industry update
    (Within 180 days)
  •   Free report update in next update cycle
    (Oct 2023 - Oct 2024)
  • Library
    Membership

  • $999 $ 1,175
    Per User/ Per month/ Billed annually
  • Published Content
    E-access
  • Company Profiles
    E-access
  • Newly Added Content Access
  • 10 PDF
    Downloads
  • 5 Excel Data
    Pack Downloads
  • 250 Company Profiles PDF Downloads
  • Buy Now

*Taxes/Fees, if applicable will be added during checkout. All prices in USD

RELATED REPORTS
 

Why Allied Market Research?


Infallible Methodology

To ensure high-level data integrity, accurate analysis, and impeccable forecasts

Analyst Support

For complete satisfaction

Customization

On-demand customization of scope of the report to exactly meet your needs

TARGETED MARKET VIEW

Targeted market view to provide pertinent information and save time of readers

Get fresh content delivered

Get insights on topics that are crucial for your business. Stay abreast of your interest areas.

Get Industry Data Alerts

Why Allied Market Research?

Infallible Methodology

To ensure high-level data integrity, accurate analysis, and impeccable forecasts

Analyst Support

For complete satisfaction

Customization

On-demand customization of scope of the report to exactly meet your needs

TARGETED MARKET VIEW

Targeted market view to provide pertinent information and save time of readers