
Bubble Tea Market Summary
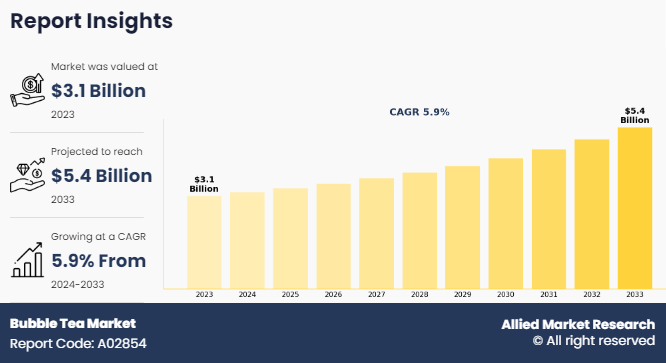
The global bubble tea market size was valued at $3.1 billion in 2023, and is projected to reach $5.4 billion by 2033, growing at a CAGR of 5.9% from 2024 to 2033. Increasing consumer demand for customizable beverages, expansion of specialty tea chains, rising urbanization, and continuous flavor innovation are key factors driving the growth of the bubble tea market.
Key Market Trends and Insights
Region wise, Asia-Pacific generated the highest revenue in 2023.
The global bubble tea market share was dominated by the millennials segment in 2023 and is expected to maintain its dominance in the upcoming years
The black tea segment is expected to witness the highest growth during the forecast
Market Size & Forecast
- 2023 Market Size: USD 3.1 Billion
- 2033 Projected Market Size: USD 5.4 Billion
- Compound Annual Growth Rate (CAGR) (2024-2033): 5.9%
- Asia-Pacific: Generated the highest revenue in 2023
Report Overview and Definition
The bubble tea market comprises the production, distribution, and sale of tea-based beverages typically made with brewed tea, milk or fruit flavors, sweeteners, and chewy toppings such as tapioca pearls, fruit jellies, popping boba, and pudding. Bubble tea, also known as boba tea, originated in Taiwan and has gained global popularity, particularly among younger consumers seeking unique, visually appealing, and customizable drink experiences. The market includes specialty bubble tea chains, independent beverage shops, café franchises, and ready-to-drink (RTD) packaged bubble tea products sold through on-trade (cafés, tea shops, restaurants) and off-trade (retail stores, supermarkets, convenience stores, and e-commerce) channels.
Bubble tea production involves tea brewing, ingredient mixing, flavor infusion, topping preparation, and packaging to ensure consistent taste, texture, and quality. Advanced beverage equipment such as automated sealing machines, tapioca pearl cookers, and standardized mixing systems help maintain product consistency and operational efficiency. Cold-chain storage and controlled preparation processes are also important to preserve freshness and texture, particularly for tapioca pearls and dairy-based ingredients. Continuous product innovation has led to the introduction of plant-based milk options, low-sugar formulations, organic tea bases, and functional ingredients such as collagen, vitamins, and probiotics.
Growing café culture, increasing social media influence, and rising consumer interest in experiential beverages are contributing significantly to market expansion. Rapid franchise development, international expansion of bubble tea brands, and collaborations with foodservice chains and retailers are further shaping competitive dynamics. In addition, packaging innovation and sustainability initiatives—such as biodegradable straws and recyclable cups—are becoming increasingly important as environmental awareness rises.
As consumer preferences continue to shift toward premium, customizable, and visually distinctive beverages, the bubble tea market size is projected to witness steady growth between 2024 and 2033, supported by flavor diversification, technological advancements in beverage preparation, and expanding global distribution networks.
Drivers
The bubble tea market is primarily driven by changing consumer preferences for personalized and premium beverage experiences. Consumers increasingly seek drinks that allow customization of sweetness levels, tea bases, milk types, and toppings such as tapioca pearls, fruit jellies, and popping boba. This high degree of customization has contributed to the rapid expansion of specialty bubble tea chains and independent beverage outlets.
Product innovation is another significant growth driver. Brands are introducing new flavors, seasonal offerings, plant-based milk alternatives, and functional ingredients such as collagen, probiotics, and vitamins to appeal to health-conscious consumers. Technological advancements in beverage preparation equipment, automated cup sealing machines, and standardized brewing systems help maintain product consistency and operational efficiency across franchise networks.
Furthermore, strong marketing strategies leveraging digital platforms, influencer collaborations, and visually engaging social media content are expanding brand visibility and consumer engagement. Rising disposable incomes, particularly among younger demographics in regions such as Asia-Pacific, North America, and Europe, are also contributing to increased spending on premium specialty beverages.
Restraints
Despite strong growth potential, the bubble tea market faces certain challenges. Health concerns related to high sugar content and calorie levels in traditional bubble tea beverages may discourage consumption among health-conscious consumers. Regulatory scrutiny regarding sugar content, food labeling, and beverage taxation in some regions can also impact market growth.
In addition, fluctuations in raw material prices including tea leaves, tapioca starch, dairy products, and flavoring ingredients can influence production costs. Operational challenges such as maintaining consistent quality of tapioca pearls and managing short shelf-life ingredients may affect supply chain efficiency. Intense competition among numerous local and international bubble tea brands can also create pricing pressure and affect profit margins.
Opportunities
The bubble tea market offers significant growth opportunities driven by innovation, health-focused product development, and global expansion of specialty beverage chains. The increasing demand for low-sugar, organic, and plant-based beverage options is encouraging manufacturers to introduce healthier alternatives without compromising taste and texture.
Sustainable packaging initiatives, including biodegradable cups, paper straws, and environmentally friendly materials, are gaining importance as consumers become more environmentally conscious. The rapid expansion of franchise models and international bubble tea brands into emerging markets is further accelerating market penetration.
Additionally, the growth of ready-to-drink packaged bubble tea products in supermarkets, convenience stores, and online platforms is expanding distribution channels beyond traditional tea shops. As consumer demand for unique, customizable, and visually appealing beverages continues to rise, the market is expected to experience steady growth between 2024 and 2033, supported by flavor innovation, brand expansion, and evolving retail ecosystems.
Key Takeaways
The bubble tea market report analyzes 20 countries, providing detailed segment-level evaluation for each nation based on market value (US$ Billion) over the forecast period of 2023–2034.
To develop comprehensive and reliable industry insights, more than 1,500 product documents, company publications, press releases, annual reports, and related materials from leading bubble tea industry participants were examined. In addition, credible industry journals, trade association publications, and official government sources were thoroughly reviewed to ensure data accuracy and relevance.
The study combines robust quantitative data with expert opinions, in-depth analysis, and independent viewpoints. This structured research methodology is designed to present a well-rounded assessment of the global bubble tea market, enabling stakeholders to make informed strategic decisions and effectively pursue their long-term growth ambitions.
Key Market Dynamics
The bubble tea market is influenced by evolving consumer lifestyles, rising demand for customizable beverages, expanding café and quick-service beverage chains, and continuous product innovation. Increasing urbanization, growing youth populations, and the popularity of social and experiential dining are significantly shaping market growth.
Bubble tea, popularly known as boba tea, is a Taiwanese drink invented in Tainan and Taichung in the 1980s. It is prepared with tea or milk as the base component. This tea is glazed with boba, which are soft, chewy, and gummy tapioca pearls extracted from cassava root. Other ingredients, such as jelly and fruit balls, are used to enhance the texture of the tea. Bubble tea is served in a hot or cold form, according to the preference of consumers and a fat straw is used through which the pearls can be easily eaten by consumers. The adoption of bubble tea has been quite high in developed regions such as the U.S., Canada, and Germany while emerging countries such as China, Brazil, and India have caught up quickly.
Changing consumer preferences has played a pivotal role in the remarkable bubble tea market growth. One of the key indicators of shifting preferences is the rising demand for diverse flavors and innovative concoctions. Traditional tea flavors have given way to exotic and adventurous choices such as taro, lychee, matcha, and various fruit infusions, expanding the market's appeal. Moreover, the customization aspect, where customers can choose their sugar levels, toppings, and even dairy alternatives, reflects a consumer-driven trend towards personalized, health-conscious choices.
The success of bubble tea also aligns with the Millennial and Gen Z generations, who prioritize experiences and shareable moments. The visual appeal of bubble tea with its colorful pearls and Instagram-worthy aesthetics has made it a staple in social media culture. Consequently, as consumer preferences continue to evolve, bubble tea's adaptability and innovation remain pivotal drivers of its market success.
Franchising and business expansion have played a pivotal role in the remarkable growth of the bubble tea market. This trend is exemplified by the rapid expansion of well-known bubble tea brands such as Chatime and Gong Cha, which have successfully adopted franchising models. For instance, Chatime, operates over 2,500 outlets across 38 countries, highlighting the global appeal of bubble tea. Gong Cha has expanded its footprint to more than 50 countries. These franchises provide a template for aspiring entrepreneurs, simplifying the process of entering the market. Franchisors offer comprehensive support, including operational guidance, marketing strategies, and access to established supply chains, making it easier for new outlets to maintain quality and consistency. This expansion has not only fueled the market's growth but also diversified the industry's reach, making bubble tea a familiar and accessible option for consumers worldwide. As the franchise model continues to be embraced, it further cements the industry's position as a global beverage phenomenon.
However, health and safety regulations in the market have become increasingly stringent, impacting its growth in several ways. Firstly, the heightened scrutiny of food safety standards, particularly in the post-COVID-19 era, has necessitated additional investments in sanitation and hygiene measures. Bubble tea shops have had to allocate resources for increased cleaning and sanitation practices, which can strain their operational budgets and reduce profitability. Moreover, stricter regulations have led to more rigorous inspections, often resulting in closures or fines for non-compliance, which can be financially burdensome for smaller businesses. Additionally, social distancing and capacity restrictions have affected foot traffic and the in-store dining experience, further hindering sales. Furthermore, the enforcement of contactless payment methods and online ordering to reduce physical contact has imposed additional technology and infrastructure costs. In summary, while health and safety regulations are essential, their stringent nature can impose financial burdens and operational challenges that may slow down market growth, particularly for small and medium-sized bubble tea businesses.
The global market has witnessed significant growth over the years and is expected to grow at a steady pace during the forecast period. This is attributed to the growth in health awareness and the rise in adoption of bubble tea, owing to its health benefits and popularity among health-conscious consumers and the young generation. The availability of bubble tea at lower prices and the introduction of additional healthy ingredients in it by different market players drive the global bubble tea market growth.
In addition, the rise in the number of vegan people helps to drive the growth of the market. However, excess sugar content in these drinks leads to health issues, and the trend of coffee consumption is expected to restrict the market growth. In addition, consumers have changed their preference toward organic beverages, due to the presence of artificial preservatives in bubble tea, which hampers the growth of the global market. On the contrary, the introduction of various new flavors and blends is expected to provide bubble tea market opportunities for expansion.
Expanding into new markets presents a compelling opportunity for the bubble tea industry, which is driven by several key factors. Firstly, the global appeal of bubble tea is evident from its growing presence in various countries. For instance, in the U.S., the number of bubble tea shops increased by over 15% from 2016 to 2021, demonstrating a strong market presence. This trend is mirrored in regions such as Europe, where bubble tea has gained popularity among a diverse customer base. Additionally, Asian countries, where bubble tea originated, continue to be robust markets with a high degree of consumer acceptance and demand. As a testament to this, China, one of the largest markets, has seen a surge in the number of outlets. Furthermore, the flexibility of bubble tea recipes allows for adaptation to local tastes, such as adding regional fruits and flavors, making it well-suited for international expansion. This adaptability, coupled with consumer curiosity and a preference for unique beverages, is driving the industry favorably for a successful expansion into new and emerging markets.
Digital transformation presents a compelling opportunity for the bubble tea market. In an era where convenience and technology are integral to consumer experiences, leveraging digital tools can significantly enhance the industry. As evidenced by the rise of mobile apps and online ordering platforms, digital transformation streamlines the ordering and delivery processes, making it more convenient for customers to access their favorite bubble tea. Moreover, it enables businesses to collect and analyze customer data, which can be used to personalize marketing efforts and enhance customer loyalty programs. Many successful bubble tea chains have embraced mobile apps, allowing customers to place orders, earn rewards, and receive promotions, thus fostering customer engagement and increasing sales. This digital shift aligns with the expectations of today's tech-savvy consumers and offers the industry a competitive edge in an increasingly digital marketplace.
Segment Overview
The bubble tea market size is segmented on the basis of flavor, base ingredient, component, end user, and region. On the basis of flavor, it is categorized into original flavor, coffee flavor, fruit flavor, chocolate flavor, milk flavor, and others. On the basis of base ingredient, it is divided into black tea, green tea, oolong tea, and white tea. On the basis of component, it is classified into flavor, creamer, sweetener, liquid, toppings, and others. On the basis of end user, it is segregated into generation Z, millennials, and generation X. On the basis of region, it is analyzed across North America, Europe, Asia-Pacific, and LAMEA.
By Flavor
The bubble tea market exhibits varied growth patterns across its key segments. By flavor, the fruit flavor segment is expected to account for the largest revenue in 2023 and is projected to grow at a CAGR of 6.3% during the forecast period. The market for fruit-flavored bubble tea is growing quickly due to consumer demand for novel flavors and healthier options. Mango, strawberry, lychee, and passion fruit are popular options. However, the chocolate flavor segment is projected to experience the fastest growth during the forecast period. This growth can be attributed to the increasing popularity of chocolate-flavored beverages across all age groups, along with rising consumer awareness of the potential health benefits associated with cocoa-based products.

By Base Ingredient
By base ingredient, the black tea segment accounted for the highest revenue in 2023 and is expected to maintain its leading position throughout the forecast period. The green tea segment is estimated to reach $1,632.7 million by 2033, at a significant CAGR of 6.3% during the forecast period. The widespread global popularity of traditional bubble tea prepared with black tea as the base contributes significantly to this trend. In contrast, the green tea segment is anticipated to register the highest CAGR during the forecast period, driven by the growing number of health-conscious consumers who prefer beverages perceived as healthier and richer in antioxidants.

By Component
By component, the liquid segment was the highest revenue contributor to the bubble tea market share, with $1,155.8 million in 2023, and is estimated to reach $2,099.6 million by 2033, with a CAGR of 6.3%. This dominance is largely due to the wide variety of liquid bases available, including different tea infusions, milk options, fruit juices, and flavored syrups that allow extensive customization. Meanwhile, the sweeteners segment is expected to record the fastest growth during the forecast period, supported by the increasing global demand for sweet and flavored beverages.

By End User
By end user, the millennials segment was the highest revenue contributor to the market, with $1,407.8 million in 2023, and is estimated to reach $2,427.9 million by 2033, with a CAGR of 5.8%. The strong interest of millennials in unique flavors, visually appealing beverages, and highly customizable drink options has significantly fueled bubble tea market demand. Bubble tea’s combination of creativity and tradition strongly resonates with this demographic, which values experiential food and beverage consumption as well as healthier lifestyle choices. In addition, social media influence and digital trends have further amplified the popularity of bubble tea among millennials.

By Region
By region, Asia-Pacific was the highest revenue contributor, accounting for $1,156.8 million in 2023, and is estimated to reach $2,219.9 million by 2033, with a CAGR of 6.9%. North America is estimated to reach $1,499.7 million by 2033, at a significant CAGR of 4.5%. This growth is attributed to increasing awareness of healthier lifestyle choices and the growing preference for innovative beverage options among health-conscious consumers. Higher consumer spending on specialty drinks has also contributed to the increasing popularity of bubble tea in the region. However, Europe is expected to register the highest CAGR during the forecast period, driven by aggressive marketing campaigns, celebrity endorsements, and rising consumer awareness of bubble tea across the region.

Key Findings of the Study
• On the basis of flavor, the fruit flavor segment is the fastest-growing segment with a 6.3% CAGR.
• On the basis of base ingredient, the black tea segment was the largest in the market in 2023.
• On the basis of component, the flavor segment is the fastest-growing segment with a 6.6% CAGR.
• On the basis of end user, the millennials segment was the largest in the market in 2023.
• Region-wise, Asia-Pacific was the highest revenue contributor to the market in 2023.
Which consumer groups are primarily driving demand in the market?
The growth of the bubble tea market is largely driven by millennials, Generation Z consumers, and urban working professionals. Millennials represent a major consumer base due to their strong interest in customizable beverages, innovative flavors, and visually appealing drinks that align with modern café culture. Generation Z consumers contribute significantly through their engagement with social media trends and preference for unique, shareable beverage experiences. Urban professionals also support market growth as bubble tea outlets and specialty beverage cafés expand in commercial and metropolitan areas, offering convenient and premium drink options that fit into fast-paced lifestyles.
What key trends are influencing the development of the bubble tea industry?
A major trend shaping the bubble tea market share is the growing demand for highly customizable beverages, allowing consumers to select tea bases, sweetness levels, toppings, and milk alternatives according to personal preferences. Another important trend is the introduction of healthier product variants, including low-sugar, organic, and plant-based options. The rapid expansion of specialty bubble tea chains and franchise models across global markets is also strengthening industry growth. In addition, the strong influence of social media marketing, visually appealing drink presentations, and limited-edition seasonal flavors continues to attract younger consumers and boost brand visibility.
How is technology influencing the market?
Technology is playing an important role in improving operational efficiency and enhancing customer experience in the bubble tea market. Automated beverage preparation equipment, digital ordering systems, and automated cup-sealing machines help ensure consistent product quality and faster service. Many bubble tea chains are also integrating mobile ordering platforms, self-service kiosks, and delivery applications to streamline the purchasing process. Data analytics and customer relationship management tools allow companies to track consumer preferences, optimize menu offerings, and personalize promotions, helping brands strengthen customer engagement and loyalty.
What technological advancements are supporting the growth of the market?
Technological advancements in the bubble tea market mainly focus on beverage preparation equipment, ingredient processing, and supply chain management. Modern tea brewing systems, tapioca pearl cooking machines, and automated sealing devices improve production speed and maintain consistent taste and texture across outlets. Innovations in ingredient preservation and cold-chain logistics help maintain the freshness of dairy products, fruit syrups, and toppings. In addition, digital point-of-sale systems, inventory management platforms, and online delivery integration enable efficient operations, better demand forecasting, and improved customer service for bubble tea retailers worldwide.
Competitve Analysis
The bubble tea market analysis comprises a mix of international beverage brands, specialty tea chains, ingredient suppliers, and franchise-based café operators. Major players in this market include Lollicup USA, Inc., CuppoTee Company, Bubble Tea House Company, Ten Ren's Tea Time, Boba Box Limited, Sumos Sdn Bhd, Gong Cha USA, Boba Tea Company, Troika JC. (Qbubble), and Fokus Inc. Other notable participants operating in the global market include Bubble Tea Supply Inc., ChaTime, CoCo Fresh, Quickly, Kung Fu Tea, Boba Loca, Happy Lemon, ShareTea, T Bun International, Fanale Drinks, Grand Chainly, and Huey-Yuhe Enterprise.
These organizations offer a wide range of bubble tea products, including ready-to-drink beverages, flavored syrups, tapioca pearls, popping boba, tea bases, and beverage preparation equipment. Market participants focus on product innovation, menu diversification, franchise expansion, and strategic partnerships to strengthen their global presence. Companies are also investing in digital ordering platforms, supply chain optimization, and sustainable packaging solutions to enhance customer experience, operational efficiency, and brand competitiveness in the rapidly expanding bubble tea industry.
Recent Industry Developments
In 2023, Gong Cha USA accelerated its global expansion strategy by opening new franchise outlets across North America and Europe to increase brand visibility and market penetration. Similarly, in 2022, ChaTime focused on international expansion by launching new stores in emerging markets and strengthening its presence in Europe and Southeast Asia through franchise partnerships.
In 2023, Kung Fu Tea introduced new seasonal flavors and limited-edition beverages to attract younger consumers and increase repeat purchases. CoCo Fresh also emphasized menu innovation in 2022 by introducing new fruit-based and plant-based milk bubble tea options to cater to health-conscious consumers.
In 2022, Happy Lemon implemented digital ordering and delivery integration in 2021–2022 to enhance customer convenience and improve operational efficiency across its global outlets. Lollicup USA, Inc. has focused on strengthening its supply chain and expanding its range of bubble tea ingredients and beverage solutions for foodservice operators.
Key Benefits for Stakeholders
This report presents a detailed quantitative assessment of bubble tea market segmentation, current trends, forecasts, and dynamics of the bubble tea market forecast from 2023 to 2033, helping identify key growth opportunities within the industry.
The study provides comprehensive market insights along with an evaluation of major drivers, restraints, and emerging opportunities influencing market development.
Porter’s Five Forces analysis is included to assess the bargaining power of buyers and suppliers, enabling stakeholders to make informed, profit-oriented decisions and strengthen their supply chain relationships.
A comprehensive segmentation analysis of the market helps identify existing and potential growth opportunities across different market segments.
Key countries across various regions are analyzed based on their contribution to global bubble tea market revenue.
Market player positioning analysis enables benchmarking and offers a clear perspective on the competitive landscape and the current standing of major companies.
The report also covers an in-depth analysis of regional and global bubble tea market trends, leading market participants, segmentation, application areas, and key strategies adopted for bubble tea market growth.
Bubble Tea Market Report Highlights
| Aspects | Details |
| Market Size By 2033 | USD 5.4 billion |
| Growth Rate | CAGR of 5.9% |
| Forecast period | 2023 - 2033 |
| Report Pages | 250 |
| By Flavor |
|
| By Base Ingredient |
|
| By Component |
|
| By End User |
|
| By Region |
|
| Key Market Players | Bubble Tea House Company, Boba Box Limited, KF Tea Franchising LLC, TP Tea, Cuppo Tee Company Limited, Bubbleology, Gong cha Global Ltd, Tbaar Inc., Sumo's (M) Sdn Bhd, Chatime Global LLC |
Analyst Review
The global bubble tea market holds a substantial scope for growth during the forecast period. Presently, the market has moved toward the growing stage and is expected to garner steady growth in major markets, which include the U.S., Germany, China, India, and Brazil.
CXOs from the leading companies perceive that product innovation, the development of newer flavors, and the use of organic preservatives & color in the manufacturing process are the major areas of growth for the bubble tea market. Moreover, an increase in disposable income and economic growth in advanced & emerging economies support the market growth. According to the CXOs, Europe is projected to register significant growth as compared to Asia-Pacific and North America due to rapid urbanization, a rise in consumption of healthy beverages, and the low price of bubble tea. Moreover, as per research conducted by different reputed organizations, tea is proven to prevent different types of cancers, lower cholesterol, help boost immunity, facilitate weight loss, and prevent neurological diseases. This indicates that the health benefits associated with bubble tea are anticipated to drive the overall market.
The global bubble tea market size was valued at USD 3.1 billion in 2023, and is projected to reach USD 5.4 billion by 2033
The global bubble tea market is projected to grow at a compound annual growth rate of 5.9% from 2024-2033 to reach USD 5.4 billion by 2033
The key players profiled in the reports includes Lollicup USA, Inc., CuppoTee Company, Bubble Tea House Company, Ten Ren's Tea Time, Boba Box Limited, Sumos Sdn Bhd, Gong Cha USA, Boba Tea Company, Troika JC. (Qbubble), and Fokus Inc. The other players operating in the global bubble tea market are Bubble Tea Supply Inc., ChaTime, CoCo Fresh, Quickly, Kung Fu Tea, Boba Loca, Happylemon, Share Tea, T Bun International, Fanale Drinks, Grand Chainly, and Huey-Yuhe Enterprise.
Asia-Pacific dominated in 2023 and is projected to maintain its leading position throughout the forecast period.
Changing Consumer Preferences, Appeal to Millennial and Gen Z Generations, Franchising and Business Expansion, Health Benefits and Popularity Among Health-Conscious Consumers majorly contribute toward the growth of the market.
Loading Table Of Content...
Loading Research Methodology...

