0
2020
Building Automation And Controls Market

Building Automation and Controls Market

By Product Type (HVAC Control, Lighting Control, and Security & Access Control), Offering (Integration and Services), and Industry Vertical (Residential, Enterprise, Industrial, Hospitality, Retail, and Others): Global Opportunity Analysis and Industry Forecast, 2020-2027

Report Code: A00808
Dec 2020 | Pages: 271
Tables: 113
Charts: 81
  • Formats*:

  • pdf

    Single User License, Five User
    License & Enterprise User License

  • xls

    Data Pack Excel License

  • ppt

    It comes with the additional cost
    of $2500.00 contact sales.


COVID-19

Pandemic disrupted the entire world and affected many industries.

Get detailed COVID-19 impact analysis on the Building Automation And Controls Market

Request Now !

Building Automation and Controls Market Outlook-2027 

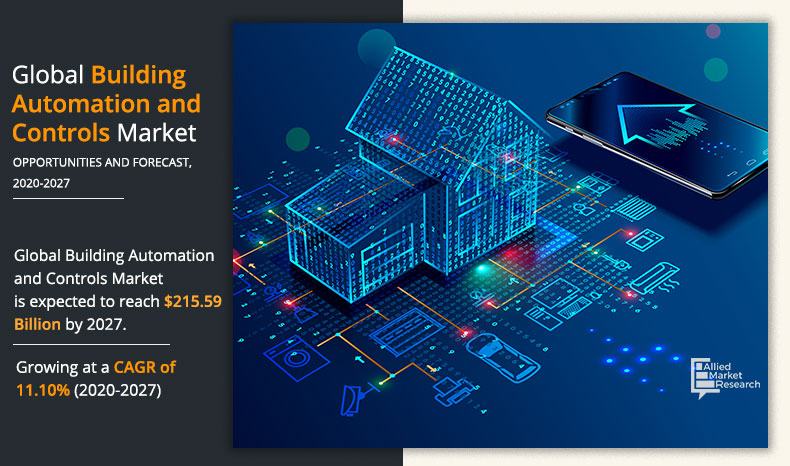
The global building automation and controls market size was valued at $101.91 billion in 2019, and is expected to reach $215.59 billion by 2027 growing at a CAGR of 11.10% from 2020 to 2027. Building automation and controls system is the automatic centralized control for heating, ventilation, & air conditioning; lighting; and security & access control systems.

COVID-19 scenario to impact enterprise segment in the Building Automation and Control Market negatively

The building automation and controls system uses sensors, detectors, relays, and other smart components integrated with intelligent electronics, which give access to central computing system to operate. They are used in various industry verticals such as industrial, enterprises, retail, hospitality, residential, and others. Some of the companies operating in the building automation and controls market are Siemensand Honeywell.

Building Automation and Controls Market


The growing deployment of building automation systems in large office buildings, shopping complexes, and public transport areas, such as railway stations and airports, is expected to drive the market growth for building automation and controls system. In addition, lighting controls, HVAC control, and security & access control systems are the major products used in residential, enterprise, and commercial sectors.

However, security & access control systems have become the essential part of several industry verticals, owing to rising security concerns in every sector. Furthermore, surging need for HVAC control, energy-efficient lighting control, and improved standard of living are expected to boost the growthof the building automation and controls market globally.

The global building automation and controls market size is expected to witness significant growth during the forecast period, owing to the rising need for advanced energy-efficient interventions. Smart building solutions help engineers optimize the base load of the building to monitor power consumption by the major building systems, such as HVAC or lighting and others, which improve the energy efficiency of buildings. 

Some of the leading countries have witnessed increase in adoption of IoT and AI integrated electronics and computing systems. IoT technology when integrated in an electronic system provides remote access to the user. The integration of AI provides the device with intelligence, giving it the ability to create an automated environment. These technologies when integrated in building management and controls systems provide users with the convenience of hassle-free and worry-less experience. 

Moreover,constant development of a supportive regulatory structure and legislative requirements fuel the demand for intelligent building solutions. In addition, development of smart cities in emerging countries and government initiatives are expected to boost the building automation and controls market growth in the coming years. However, lack of interoperability between devices hampers the growth of the market. 

Building Automation and Controls Market
By Product Type

Your browser does not support the canvas element.

HVAC Control segment is projected to be the most lucrative segment

Get more information on this report : Request Sample Pages


The global building automation and controls market is segmented on the basis of product type, offering, industrial vertical, and region. On the basis of product type, the market is divided into HVAC control, lighting control, and security & access control. Based on offering, it is bifurcated into integration and services. Depending on industry vertical, it is classified into residential, enterprise, industrial, hospitality, retail, and others.

Building Automation and Controls Market
By Offering

Your browser does not support the canvas element.

Integration segment will maintain the lead throughout the forecast period

Get more information on this report : Request Sample Pages


Region-wise, the building automation and controls markettrends are analyzed across North America (the U.S., Canada, and Mexico), Europe (Germany, the UK, France, Italy, and Rest of Europe), Asia-Pacific (China, Japan, India, South Korea, and Rest of Asia-Pacific), and LAMEA (Latin America, the Middle East, and Africa).Europe accounted for the highest share, owing to the development of wireless technology and increase in construction of smart cities.

Building Automation and Controls Market
By Industry Vertical

Your browser does not support the canvas element.

Industrial segment will dominate the market during 2020 - 2027

Get more information on this report : Request Sample Pages


Top Impacting Factors

The prominent factors that drive the growth of the building automation and controls market include rising need for advanced energy-efficient interventions, growing deployment of building automation systems, and rise in demand for convenient user experience. However, lack of interoperability between devices hampers the growth of the market.Conversely, development of smart cities in emerging countries and government initiatives are expected to create lucrative opportunities for the building automation and controls industry.

Building Automation and Controls Market
By Region

2027
Europe 
North America
Asia-Pacific
LAMEA

Asia-Pacific region would exhibit the highest CAGR of 13.20% during 2020 - 2027

Get more information on this report : Request Sample Pages


Competition Analysis

Competitive analysis and profiles of the major building automation and controls market leaders, such as Honeywell International, Beijer Electronics, ABB, Siemens AG, Johnson Controls, Schneider Electric, General Electric, Legrand, Lutron Electronics Co., and Control4 Corporation,are provided in this report. These key players have adopted various strategies, such as product portfolio expansion, mergers & acquisitions, agreements, geographical expansion, and collaborations, to increase their market penetration and strengthen their foothold in the industry.

COVID-19 Analysis

The building automation and controls market has been significantly impacted by the COVID-19 outbreak. At the start of the outbreak, the main impact faced by many manufacturers was supply problems, owing to halted production. Attributed to lockdown measuresand halt of non-essential businesses, the demand for residential, enterprise, & industrial use of building automation system has been decreased. Consequently, the manufacturing & supply of building automation and controls system is returning to normal levels.

Attributed to the ongoing COVID-19 crises, the construction market is expected to witness abrupt downturn this year. However, a slow recovery is anticipated to begin next year. It is also estimated that the construction market will face a lot of challenges leading to the COVID-19 crisis with stagnation trends in many countries. Moreover, the ongoing crisis is expected to have a huge negative impact on the construction industry across the globe. However, Europe is estimated to witness positive growth rates next year and normalization in 2022.

Key BenefitsFor Stakeholders:

  • This study comprises analytical depiction of the global market along with the current trends and future estimations to depict the imminent investment pockets.
  • The overall building automation and controls market analysis is determined to understand the profitable trends to gain a stronger foothold.
  • The report presents information related to key drivers, restraints, and market opportunities with a detailed impact analysis.
  • The current building automation and controls market forecast is quantitatively analyzed from 2019 to 2027 to benchmark the financial competency.
  • Porter’s five forces analysis illustrates the potency of the buyers and the building automation and controls market share of key vendors.
  • The report includes the market trends and the market share of key vendors.

Building Automation and Controls Market Report Highlights

Aspects Details
By Product Type
  • HVAC Controls
  • Lighting Controls
  • Security & Access Controls
By Offering
  • Integration
  • Services
By Industry Vertical
  • Residential
  • Enterprise
  • Industrial
  • Hospitality
  • Retail
  • Others
By Region
  • North America  (U.S., Canada, Mexico)
  • Europe  (Germany, UK, France, Italy, Rest of Europe)
  • Asia-Pacific  (China, Japan, India, .South Korea, Rest of Asia-Pacific)
  • LAMEA  (Latin America, Middle East, Africa)
Key Market Players Legrand, Control4, BEIJER ELECTRONICS, HONEYWELL INTERNATIONAL INC., Johnson Controls, SIEMENS AG, Lutron Electronics Co., Inc, ABB, Ltd., GENERAL ELECTRIC, SCHNEIDER ELECTRIC
 

CHAPTER 1:  INTRODUCTION

1.1.Report description
1.2.Key benefits for stakeholders
1.3.Key market segments
1.4.Research methodology

1.4.1. Primary research
1.4.2.Secondary research
1.4.3.Analyst tools and models

CHAPTER 2:EXECUTIVE SUMMARY

2.1.CXO perspective              

CHAPTER 3:MARKET OVERVIEW

3.1.Market definition and scope
3.2.Key findings

3.2.1. Top impacting factors
3.2.2.Top investment pockets

3.3.Porter’s five forces analysis
3.4.Patent analysis

3.4.1.By Region (2012-2020)
3.4.2.By applicant (2012-2020)

3.5. Market dynamics

3.5.1. Drivers

3.5.1.1.Surging need for advanced energy-efficient interventions
3.5.1.2.Growing deployment of building automation systems
3.5.1.3.Rise in demand for convenient user experience

3.5.2.Restraint

3.5.2.1.Lack of interoperability between devices

3.5.3. Opportunities

3.5.3.1.Government initiatives
3.5.3.2.Increase in development of smart cities in emerging countries

3.6.COVID-19 Impact Analysis

3.6.1.COVID-19 Outbreak
3.6.2.Impact on market size

CHAPTER 4: GLOBAL BUILDING AUTOMATION AND CONTROLS MARKET, BY PRODUCT TYPE

4.1.Overview
4.2.HVAC Controls

4.2.1.Key market trends, growth factors, and opportunities
4.2.2.Market size and forecast, by region
4.2.3. Market size and forecast, by country

4.3. Lighting Controls

4.3.1.Key market trends, growth factors, and opportunities
4.3.2. Market size and forecast, by region
4.3.3. Market size and forecast, by country

4.4.Security & Access Controls

4.4.1.Key market trends, growth factors, and opportunities
4.4.2.Market size and forecast, by region
4.4.3.Market size and forecast, by country

CHAPTER 5:GLOBAL BUILDING AUTOMATION AND CONTROLS MARKET, BY OFFERING

5.1.Overview
5.2.Integration

5.2.1.Key market trends, growth factors, and opportunities
5.2.2. Market size and forecast, by region
5.2.3.Market size and forecast, by country

5.3.Services

5.3.1.Key market trends, growth factors, and opportunities
5.3.2.Market size and forecast, by region
5.3.3.Market size and forecast, by country

CHAPTER 6: GLOBAL BUILDING AUTOMATION AND CONTROLS MARKET, BY INDUSTRY VERTICAL

6.1.Overview
6.2.Residential

6.2.1.Key market trends, growth factors, and opportunities
6.2.2.Market size and forecast, by region
6.2.3.Market size and forecast, by country

6.3.Enterprise

6.3.1. Key market trends, growth factors, and opportunities
6.3.2. Market size and forecast, by region
6.3.3.Market size and forecast, by country

6.4.Industrial

6.4.1.Key market trends, growth factors, and opportunities
6.4.2.Market size and forecast, by region
6.4.3.Market size and forecast, by country

6.5.Hospitality

6.5.1.Key market trends, growth factors, and opportunities
6.5.2.Market size and forecast, by region
6.5.3.Market size and forecast, by country

6.6.Retail

6.6.1.Key market trends, growth factors, and opportunities
6.6.2.Market size and forecast, by region
6.6.3.Market size and forecast, by country

6.7.Others

6.7.1.Key market trends, growth factors, and opportunities
6.7.2.Market size and forecast, by region
6.7.3.Market size and forecast, by country

CHAPTER 7:BUILDING AUTOMATION AND CONTROLS MARKET, BY REGION

7.1.Overview
7.2.North America

7.2.1.Key market trends, growth factors, and opportunities
7.2.2.Market size and forecast, by product type
7.2.3.Market size and forecast, by offering
7.2.4.Market size and forecast, by industry vertical
7.2.5.Market analysis, by country

7.2.5.1. U.S.

7.2.5.1.1.Market size and forecast, by product type
7.2.5.1.2.Market size and forecast, by offering
7.2.5.1.3.Market size and forecast, by industry vertical

7.2.5.2. Canada

7.2.5.2.1.Market size and forecast, by product type
7.2.5.2.2.Market size and forecast, by offering
7.2.5.2.3.Market size and forecast, by industry vertical

7.2.5.3.Mexico

7.2.5.3.1.Market size and forecast, by product type
7.2.5.3.2.Market size and forecast, by offering
7.2.5.3.3.Market size and forecast, by industry vertical

7.3.Europe

7.3.1.Key market trends, growth factors, and opportunities
7.3.2.Market size and forecast, by product type
7.3.3.Market size and forecast, by offering
7.3.4.Market size and forecast, by industry vertical
7.3.5.Market analysis, by country

7.3.5.2.Germany

7.3.5.2.1.Market size and forecast, by product type
7.3.5.2.2.Market size and forecast, by offering
7.3.5.2.3.Market size and forecast, by industry vertical

7.3.5.3.UK

7.3.5.3.1.Market size and forecast, by product type
7.3.5.3.2.Market size and forecast, by offering
7.3.5.3.3.Market size and forecast, by industry vertical

7.3.5.4.France

7.3.5.4.1.Market size and forecast, by product type
7.3.5.4.2.Market size and forecast, by offering
7.3.5.4.3.Market size and forecast, by industry vertical

7.3.5.5.Italy

7.3.5.5.1.Market size and forecast, by product type
7.3.5.5.2.Market size and forecast, by offering
7.3.5.5.3.Market size and forecast, by industry vertical

7.3.5.6.Rest of Europe

7.3.5.6.1.Market size and forecast, by product type
7.3.5.6.2.Market size and forecast, by offering
7.3.5.6.3.Market size and forecast, by industry vertical

7.4.Asia-Pacific

7.4.1.Key market trends, growth factors, and opportunities
7.4.2.Market size and forecast, by product type
7.4.3.Market size and forecast, by offering
7.4.4.Market size and forecast, by industry vertical
7.4.5.Market analysis, by country

7.4.5.1.China

7.4.5.1.1.Market size and forecast, by product type
7.4.5.1.2.Market size and forecast, by offering
7.4.5.1.3.Market size and forecast, by industry vertical

7.4.5.2.Japan

7.4.5.2.1.Market size and forecast, by product type
7.4.5.2.2.Market size and forecast, by offering
7.4.5.2.3.Market size and forecast, by industry vertical

7.4.5.3. India

7.4.5.3.1.Market size and forecast, by product type
7.4.5.3.2.Market size and forecast, by offering
7.4.5.3.3.Market size and forecast, by industry vertical

7.4.5.4.South Korea

7.4.5.4.1.Market size and forecast, by product type
7.4.5.4.2.Market size and forecast, by offering
7.4.5.4.3.Market size and forecast, by industry vertical

7.4.5.5.Rest of Asia-Pacific

7.4.5.5.1.Market size and forecast, by product type
7.4.5.5.2.Market size and forecast, by offering7.4.5.5.3.Market size and forecast, by industry vertical

7.5. LAMEA

7.5.1.Key market trends, growth factors, and opportunities
7.5.2.Market size and forecast, by product type
7.5.3.Market size and forecast, by offering
7.5.4.Market size and forecast, by industry vertical
7.5.5. Market analysis, by country

7.5.5.1.Latin America

7.5.5.1.1.Market size and forecast, by product type
7.5.5.1.2.Market size and forecast, by offering
7.5.5.1.3.Market size and forecast, by industry vertical

7.5.5.2.Middle East

7.5.5.2.1.Market size and forecast, by product type
7.5.5.2.2.Market size and forecast, by offering
7.5.5.2.3.Market size and forecast, by industry vertical

7.5.5.3.Africa

7.5.5.3.1.Market size and forecast, by product type
7.5.5.3.2.Market size and forecast, by offering
7.5.5.3.3.Market size and forecast, by industry vertical

CHAPTER 8:COMPETITIVE LANDSCAPE

8.1.Introduction

8.1.1.Market player positioning, 2020

8.2.Top winning strategies
8.3.Product mapping of top 10 player
8.4.Competitive dashboard
8.5.Competitive heatmap

CHAPTER 9:COMPANY PROFILES

9.1.BEIJER ELECTRONICS

9.1.1.Company overview
9.1.2. Key executives
9.1.3.Company snapshot
9.1.4.Product portfolio
9.1.5.Business performance
9.1.6.Revenue share, by region
9.1.7.Key strategic moves and developments

9.2.HONEYWELL INTERNATIONAL INC.

9.2.1.Company overview
9.2.2.Company snapshot
9.2.3.Operating business segments
9.2.4.Product portfolio
9.2.5.R&D Expenditure
9.2.6.Business performance
9.2.7.Key strategic moves and developments

9.3.SCHNEIDER ELECTRIC

9.3.1.Company overview
9.3.2.Key Executives
9.3.3.Company snapshot
9.3.4.Operating business segments
9.3.5.Product portfolio
9.3.6.R&D Expenditure
9.3.7.Business performance
9.3.8.Key strategic moves and developments

9.4.SIEMENS AG

9.4.1.Company overview
9.4.2.Key Executives
9.4.3.Company snapshot
9.4.4.Operating business segments
9.4.5.Product portfolio
9.4.6.R&D Expenditure
9.4.7.Business performance
9.4.8.Key strategic moves and developments

9.5.  GENERAL ELECTRIC

9.5.1.Company overview
9.5.2.Company snapshot
9.5.3.Operating business segments
9.5.4.Product portfolio
9.5.5.R&D Expenditure
9.5.6.Business performance

9.6.ABB, Ltd.

9.6.1.Company overview
9.6.2.Company snapshot
9.6.3.Operating business segments
9.6.4.Product portfolio
9.6.5.R&D Expenditure
9.6.6.Business performance
9.6.7.Key strategic moves and developments

9.7.Johnson Controls

9.7.1.Company overview
9.7.2.Company snapshot
9.7.3.Operating business segments
9.7.4.Product portfolio
9.7.5.R&D Expenditure
9.7.6.Business performance
9.7.7.Key strategic moves and developments

9.8.Control4

9.8.1.Company overview
9.8.2.Company snapshot
9.8.3.Product portfolio
9.8.4.Key strategic moves and developments

9.9.Lutron Electronics Co., Inc

9.9.1.Company overview
9.9.2.Company snapshot
9.9.3.Product portfolio
9.9.4.Key strategic moves and developments

9.10. Legrand

9.10.1.Company overview
9.10.2.Company snapshot
9.10.3.Product portfolio
9.10.4.Business performance
9.10.5.Key strategic moves and developments

LIST OF TABLES

TABLE 01.      GLOBAL BUILDING AUTOMATION AND CONTROLS MARKET SHARE, BY PRODUCT TYPE, 2019-2027 ($BILLION)

TABLE 03.      GLOBAL BUILDING AUTOMATION AND CONTROLS MARKET FOR HVAC CONTROLS, BY REGION, 2019-2027 ($BILLION)

TABLE 05.      GLOBAL BUILDING AUTOMATION AND CONTROLS MARKET FOR LIGHTING CONTROLS, BY REGION, 2019-2027 ($BILLION)

TABLE 07.      GLOBAL BUILDING AUTOMATION AND CONTROLS MARKET FOR SECURITY & ACCESS CONTROLS, BY REGION, 2019-2027 ($BILLION)

TABLE 08.      BUILDING AUTOMATION AND CONTROLS MARKET FORECAST, BY OFFERING, 2019-2027 ($BILLION)

TABLE 10.      BUILDING AUTOMATION AND CONTROLS MARKET FOR INTEGRATION, BY REGION 2019-2027 ($BILLION)

TABLE 12.      BUILDING AUTOMATION AND CONTROLS MARKET FOR SERVICES, BY REGION, 2019-2027 ($BILLION)

TABLE 13.      GLOBAL BUILDING AUTOMATION AND CONTROLS MARKET, BY INDUSTRY VERTICAL 2019-2027 ($BILLION)

TABLE 14.      RESIDENTIAL BUILDING AUTOMATION AND CONTROLS MARKET FORECAST, BY REGION 2020-2027 ($BILLION)

TABLE 15.      ENTERPRISES BUILDING AUTOMATION AND CONTROLS MARKET FORECAST, BY REGION, 2019-2027 ($BILLION)

TABLE 17.      INDUSTRIAL BUILDING AUTOMATION AND CONTROLS MARKET FORECAST, BY REGION 2019-2027 ($BILLION)

TABLE 19.      HOSPITALITY BUILDING AUTOMATION AND CONTROLS MARKET FORECAST, BY REGION, 2019-2027 ($BILLION)

TABLE 21.      RETAIL BUILDING AUTOMATION AND CONTROLS MARKET FORECAST, BY REGION, 2019-2027 ($BILLION)

TABLE 22.      OTHERS BUILDING AUTOMATION AND CONTROLS MARKET FORECAST, BY COUNTRY 2019-2027 ($BILLION)

TABLE 23.      BUILDING AUTOMATION AND CONTROLS MARKET REVENUE, BY REGION, 2019–2027 ($BILLION)

TABLE 24.      NORTH AMERICA BUILDING AUTOMATION AND CONTROLS MARKET, BY PRODUCT TYPE, 2019–2027 ($BILLION)

TABLE 25.      NORTH AMERICA BUILDING AUTOMATION AND CONTROLS MARKET, BY OFFERING, 2019–2027 ($BILLION)

TABLE 26.      NORTH AMERICA BUILDING AUTOMATION AND CONTROLS MARKET, BY INDUSTRY VERTICAL, 2019-2027 ($BILLION)

TABLE 27.      U.S. BUILDING AUTOMATION AND CONTROLS MARKET, BY PRODUCT TYPE, 2019–2027 ($BILLION)

TABLE 28.      U.S. BUILDING AUTOMATION AND CONTROLS MARKET, BY OFFERING, 2019–2027 ($BILLION)

TABLE 29.      U.S. BUILDING AUTOMATION AND CONTROLS MARKET, BY INDUSTRY VERTICAL, 2019-2027 ($BILLION)

TABLE 30.      CANADA BUILDING AUTOMATION AND CONTROLS MARKET, BY PRODUCT TYPE, 2019–2027 ($BILLION)

TABLE 31.      CANADA BUILDING AUTOMATION AND CONTROLS MARKET, BY OFFERING, 2019–2027 ($BILLION)

TABLE 32.      CANADA BUILDING AUTOMATION AND CONTROLS MARKET, BY INDUSTRY VERTICAL, 2019-2027 ($BILLION)

TABLE 33.      MEXICO BUILDING AUTOMATION AND CONTROLS MARKET, BY PRODUCT TYPE, 2019–2027 ($BILLION)

TABLE 34.      MEXICO BUILDING AUTOMATION AND CONTROLS MARKET, BY OFFERING, 2019–2027 ($BILLION)

TABLE 35.      MEXICO BUILDING AUTOMATION AND CONTROLS MARKET, BY INDUSTRY VERTICAL, 2019-2027 ($BILLION)

TABLE 36.      EUROPE BUILDING AUTOMATION AND CONTROLS MARKET, BY PRODUCT TYPE, 2019–2027 ($BILLION)

TABLE 37.      EUROPE BUILDING AUTOMATION AND CONTROLS MARKET, BY OFFERING, 2019–2027 ($BILLION)

TABLE 38.      EUROPE BUILDING AUTOMATION AND CONTROLS MARKET, BY INDUSTRY VERTICAL, 2019-2027 ($BILLION)

TABLE 39.      GERMANY BUILDING AUTOMATION AND CONTROLS MARKET, BY PRODUCT TYPE, 2019–2027 ($BILLION)

TABLE 40.      GERMANY BUILDING AUTOMATION AND CONTROLS MARKET, BY OFFERING, 2019–2027 ($BILLION)

TABLE 41.      GERMANY BUILDING AUTOMATION AND CONTROLS MARKET, BY INDUSTRY VERTICAL, 2019-2027 ($BILLION)

TABLE 42.      UK BUILDING AUTOMATION AND CONTROLS MARKET, BY PRODUCT TYPE, 2019–2027 ($BILLION)

TABLE 43.      UK BUILDING AUTOMATION AND CONTROLS MARKET, BY OFFERING, 2019–2027 ($BILLION)

TABLE 44.      UK BUILDING AUTOMATION AND CONTROLS MARKET, BY INDUSTRY VERTICAL, 2019-2027 ($MILLION)

TABLE 45.      FRANCE BUILDING AUTOMATION AND CONTROLS MARKET, BY PRODUCT TYPE, 2019–2027 ($BILLION)

TABLE 46.      FRANCE BUILDING AUTOMATION AND CONTROLS MARKET, BY OFFERING, 2019–2027 ($BILLION)

TABLE 47.      FRANCE BUILDING AUTOMATION AND CONTROLS MARKET, BY INDUSTRY VERTICAL, 2019-2027 ($BILLION)

TABLE 48.      ITALY BUILDING AUTOMATION AND CONTROLS MARKET, BY PRODUCT TYPE, 2019–2027 ($BILLION)

TABLE 49.      ITALY BUILDING AUTOMATION AND CONTROLS MARKET, BY OFFERING, 2019–2027 ($BILLION)

TABLE 50.      ITALY BUILDING AUTOMATION AND CONTROLS MARKET, BY INDUSTRY VERTICAL, 2019-2027 ($BILLION)

TABLE 51.      REST OF EUROPE BUILDING AUTOMATION AND CONTROLS MARKET, BY PRODUCT TYPE, 2019–2027 ($BILLION)

TABLE 52.      REST OF EUROPE BUILDING AUTOMATION AND CONTROLS MARKET, BY OFFERING, 2019–2027 ($BILLION)

TABLE 53.      REST OF EUROPE BUILDING AUTOMATION AND CONTROLS MARKET, BY INDUSTRY VERTICAL, 2019-2027 ($BILLION)

TABLE 54.      ASIA-PACIFIC BUILDING AUTOMATION AND CONTROLS MARKET, BY PRODUCT TYPE, 2019–2027 ($BILLION)

TABLE 55.      ASIA-PACIFIC BUILDING AUTOMATION AND CONTROLS MARKET, BY OFFERING, 2019–2027 ($BILLION)

TABLE 56.      ASIA-PACIFIC BUILDING AUTOMATION AND CONTROLS MARKET, BY INDUSTRY VERTICAL, 2019-2027 ($BILLION)

TABLE 57.      CHINA BUILDING AUTOMATION AND CONTROLS MARKET, BY PRODUCT TYPE, 2019–2027 ($BILLION)

TABLE 58.      CHINA BUILDING AUTOMATION AND CONTROLS MARKET, BY OFFERING, 2019–2027 ($BILLION)

TABLE 59.      CHINA BUILDING AUTOMATION AND CONTROLS MARKET, BY INDUSTRY VERTICAL, 2019-2027 ($BILLION)

TABLE 60.      JAPAN BUILDING AUTOMATION AND CONTROLS MARKET, BY PRODUCT TYPE, 2019–2027 ($BILLION)

TABLE 61.      JAPAN BUILDING AUTOMATION AND CONTROLS MARKET, BY OFFERING, 2019–2027 ($BILLION)

TABLE 62.      JAPAN BUILDING AUTOMATION AND CONTROLS MARKET, BY INDUSTRY VERTICAL, 2019-2027 ($BILLION)

TABLE 63.      INDIA BUILDING AUTOMATION AND CONTROLS MARKET, BY PRODUCT TYPE, 2019–2027 ($BILLION)

TABLE 64.      INDIA BUILDING AUTOMATION AND CONTROLS MARKET, BY OFFERING, 2019–2027 ($BILLION)

TABLE 65.      INDIA BUILDING AUTOMATION AND CONTROLS MARKET, BY INDUSTRY VERTICAL, 2019-2027 ($BILLION)

TABLE 66.      SOUTH KOREA BUILDING AUTOMATION AND CONTROLS MARKET, BY PRODUCT TYPE, 2019–2027 ($BILLION)

TABLE 67.      SOUTH KOREA BUILDING AUTOMATION AND CONTROLS MARKET, BY OFFERING, 2019–2027 ($BILLION)

TABLE 68.      SOUTH KOREA BUILDING AUTOMATION AND CONTROLS MARKET, BY INDUSTRY VERTICAL, 2019-2027 ($BILLION)

TABLE 69.      REST OF ASIA-PACIFIC BUILDING AUTOMATION AND CONTROLS MARKET, BY PRODUCT TYPE, 2019–2027 ($BILLION)

TABLE 70.      REST OF ASIA-PACIFIC BUILDING AUTOMATION AND CONTROLS MARKET, BY OFFERING, 2019–2027 ($BILLION)

TABLE 71.      REST OF ASIA-PACIFIC BUILDING AUTOMATION AND CONTROLS MARKET, BY INDUSTRY VERTICAL, 2019-2027 ($BILLION)

TABLE 72.      LAMEA BUILDING AUTOMATION AND CONTROLS MARKET, BY PRODUCT TYPE, 2019–2027 ($BILLION)

TABLE 73.      LAMEA BUILDING AUTOMATION AND CONTROLS MARKET, BY OFFERING, 2019–2027 ($BILLION)

TABLE 74.      LAMEA BUILDING AUTOMATION AND CONTROLS MARKET, BY INDUSTRY VERTICAL, 2019-2027 ($BILLION)

TABLE 75.      LATIN AMERICA BUILDING AUTOMATION AND CONTROLS MARKET, BY PRODUCT TYPE, 2019–2027 ($BILLION)

TABLE 76.      LATIN AMERICA BUILDING AUTOMATION AND CONTROLS MARKET, BY OFFERING, 2019–2027 ($BILLION)

TABLE 77.      LATIN AMERICA BUILDING AUTOMATION AND CONTROLS MARKET, BY INDUSTRY VERTICAL, 2019-2027 ($BILLION)

TABLE 78.      MIDDLE EAST BUILDING AUTOMATION AND CONTROLS MARKET, BY PRODUCT TYPE, 2019–2027 ($BILLION)

TABLE 79.      MIDDLE EAST BUILDING AUTOMATION AND CONTROLS MARKET, BY OFFERING, 2019–2027 ($BILLION)

TABLE 80.      MIDDLE EAST BUILDING AUTOMATION AND CONTROLS MARKET, BY INDUSTRY VERTICAL, 2019-2027 ($BILLION)

TABLE 81.      AFRICA BUILDING AUTOMATION AND CONTROLS MARKET, BY PRODUCT TYPE, 2019–2027 ($BILLION)

TABLE 82.      AFRICA BUILDING AUTOMATION AND CONTROLS MARKET, BY OFFERING, 2019–2027 ($BILLION)

TABLE 83.      AFRICA BUILDING AUTOMATION AND CONTROLS MARKET, BY INDUSTRY VERTICAL, 2019-2027 ($BILLION)

TABLE 84.      BEIJER ELECTRONICS: KEY EXECUTIVES

TABLE 85.      BEIJER ELECTRONICS: COMPANY SNAPSHOT

TABLE 86.      BEIJER ELECTRONICS: PRODUCT PORTFOLIO

TABLE 87.      HONEYWELL INTERNATIONAL INC.: COMPANY SNAPSHOT

TABLE 88.      HONEYWELL INTERNATIONAL INC.: OPERATING SEGMENTS

TABLE 89.      HONEYWELL INTERNATIONAL INC.: PRODUCT PORTFOLIO

TABLE 90.      HONEYWELL INTERNATIONAL INC.: KEY STRATEGIC MOVES AND DEVELOPMENTS

TABLE 91.      KEY EXECUTIVES

TABLE 92.      SCHNEIDER ELECTRIC: COMPANY SNAPSHOT

TABLE 93.      SCHNEIDER ELECTRIC: OPERATING SEGMENTS

TABLE 94.      SCHNEIDER ELECTRIC: PRODUCT PORTFOLIO

TABLE 95.      KEY EXECUTIVES

TABLE 96.      SIEMENS AG: COMPANY SNAPSHOT

TABLE 97.      SIEMENS AG: OPERATING SEGMENTS

TABLE 98.      SIEMENS AG: PRODUCT PORTFOLIO

TABLE 99.      GENERAL ELECTRIC: COMPANY SNAPSHOT

TABLE 100.   GENERAL ELECTRIC: OPERATING SEGMENTS

TABLE 101.   GENERAL ELECTRIC: PRODUCT PORTFOLIO

TABLE 102.   ABB: COMPANY SNAPSHOT

TABLE 103.   ABB: OPERATING SEGMENTS

TABLE 104.   ABB: PRODUCT PORTFOLIO

TABLE 105.   JOHNSON CONTROLS: COMPANY SNAPSHOT

TABLE 106.   JOHNSON CONTROLS: OPERATING SEGMENTS

TABLE 107.   JOHNSON CONTROLS: PRODUCT PORTFOLIO

TABLE 108.   CONTROL4: COMPANY SNAPSHOT

TABLE 109.   CONTROL4: PRODUCT PORTFOLIO

TABLE 110.   LUTRON ELECTRONICS CO., INC: COMPANY SNAPSHOT

TABLE 111.   LUTRON ELECTRONICS CO., INC: PRODUCT PORTFOLIO

TABLE 112.   ABB: COMPANY SNAPSHOT

TABLE 113.   LEGRAND: PRODUCT PORTFOLIO

LIST OF FIGURES

FIGURE 01.   KEY MARKET SEGMENTS

FIGURE 02.   EXECUTIVE SUMMARY

FIGURE 03.   EXECUTIVE SUMMARY

FIGURE 04.   TOP IMPACTING FACTORS

FIGURE 05.   TOP INVESTMENT POCKETS

FIGURE 06.   MODERATE BARGAINING POWER OF SUPPLIERS

FIGURE 07.   MODERATE THREAT OF NEW ENTRANTS

FIGURE 08.   MODERATE THREAT OF SUBSTITUTES

FIGURE 09.   MODERATE INTENSITY OF RIVALRY

FIGURE 10.   MODERATE BARGAINING POWER OF BUYERS

FIGURE 11.   PATENT ANALYSIS, BY COUNTRY

FIGURE 12.   PATENT ANALYSIS, BY APPLICANT

FIGURE 13.   GLOBAL BUILDING AUTOMATION AND CONTROLS MARKET SHARE, BY PRODUCT TYPE, 2019–2027 (%)

FIGURE 14.   COMPARATIVE SHARE ANALYSIS OF GLOBAL BUILDING AUTOMATION AND CONTROLS MARKET FOR HVAC CONTROLS, BY COUNTRY, 2019 & 2027 (%)

FIGURE 15.   COMPARATIVE SHARE ANALYSIS OF GLOBAL BUILDING AUTOMATION AND CONTROLS MARKET FOR LIGHTING CONTROLS, BY COUNTRY, 2019-2027 (%)

FIGURE 16.   COMPARATIVE SHARE ANALYSIS OF GLOBAL BUILDING AUTOMATION AND CONTROLS MARKET FOR SECURITY & ACCESS CONTROLS, BY COUNTRY, 2019-2027 (%)

FIGURE 17.   GLOBAL BUILDING AUTOMATION AND CONTROLS MARKET SHARE, BY OFFERING, 2019–2027 (%)

FIGURE 18.   COMPARATIVE SHARE ANALYSIS OF BUILDING AUTOMATION AND CONTROLS MARKET FOR INTEGRATION, BY COUNTRY, 2019-2027 (%)

FIGURE 19.   COMPARATIVE SHARE ANALYSIS OF BUILDING AUTOMATION AND CONTROLS S MARKET FOR SERVICES, BY COUNTRY, 2019 & 2027 (%)

FIGURE 20.   GLOBAL BUILDING AUTOMATION AND CONTROLS MARKET SHARE, BY INDUSTRY VERTICAL, 2019–2027 (%)

FIGURE 21.   COMPARATIVE SHARE ANALYSIS OF RESIDENTIAL BUILDING AUTOMATION AND CONTROLS MARKET, BY COUNTRY, 2019 & 2027 (%)

FIGURE 22.   COMPARATIVE SHARE ANALYSIS OF ENTERPRISES BUILDING AUTOMATION AND CONTROLS MARKET, BY COUNTRY, 2019 & 2027 (%)

FIGURE 23.   COMPARATIVE SHARE ANALYSIS OF INDUSTRIAL BUILDING AUTOMATION AND CONTROLS MARKET, BY COUNTRY, 2019 & 2027 (%)

FIGURE 24.   COMPARATIVE SHARE ANALYSIS OF HOSPITALITY BUILDING AUTOMATION AND CONTROLS MARKET, BY COUNTRY, 2019 & 2027 (%)

FIGURE 25.   COMPARATIVE SHARE ANALYSIS OF RETAIL BUILDING AUTOMATION AND CONTROLS MARKET, BY COUNTRY, 2019 & 2027 (%)

FIGURE 26.   COMPARATIVE SHARE ANALYSIS OF OTHER BUILDING AUTOMATION AND CONTROLS MARKET, BY COUNTRY, 2019 & 2027 (%)

FIGURE 27.   BUILDING AUTOMATION AND CONTROLS MARKET, BY REGION, 2019-2027 (%)

FIGURE 28.   COMPARATIVE SHARE ANALYSIS OF NORTH AMERICA BUILDING AUTOMATION AND CONTROLS MARKET, BY COUNTRY, 2019–2027 (%)

FIGURE 29.   U.S. BUILDING AUTOMATION AND CONTROLS MARKET, 2019–2027 ($BILLION)

FIGURE 30.   CANADA BUILDING AUTOMATION AND CONTROLS MARKET, 2019–2027 ($BILLION)

FIGURE 31.   MEXICO BUILDING AUTOMATION AND CONTROLS MARKET, 2019–2027 ($MILLION)

FIGURE 32.   COMPARATIVE SHARE ANALYSIS OF EUROPE BUILDING AUTOMATION AND CONTROLS MARKET, BY COUNTRY, 2019–2027 (%)

FIGURE 33.   GERMANY BUILDING AUTOMATION AND CONTROLS MARKET, 2019–2027 ($BILLION)

FIGURE 34.   UK BUILDING AUTOMATION AND CONTROLS MARKET, 2019–2027 ($BILLION)

FIGURE 35.   FRANCE BUILDING AUTOMATION AND CONTROLS MARKET, 2019–2027 ($BILLION)

FIGURE 36.   ITALY BUILDING AUTOMATION AND CONTROLS MARKET, 2019–2027 ($BILLION)

FIGURE 37.   REST OF EUROPE BUILDING AUTOMATION AND CONTROLS MARKET, 2019–2027 ($BILLION)

FIGURE 38.   COMPARATIVE SHARE ANALYSIS OF ASIA-PACIFIC BUILDING AUTOMATION AND CONTROLS MARKET, BY COUNTRY, 2019–2027 (%)

FIGURE 39.   CHINA BUILDING AUTOMATION AND CONTROLS MARKET, 2019–2027 ($BILLION)

FIGURE 40.   JAPAN BUILDING AUTOMATION AND CONTROLS MARKET, 2019–2027 ($BILLION)

FIGURE 41.   INDIA BUILDING AUTOMATION AND CONTROLS MARKET, 2019–2027 ($BILLION)

FIGURE 42.   SOUTH KOREA BUILDING AUTOMATION AND CONTROLS MARKET, 2019–2027 ($BILLION)

FIGURE 43.   REST OF ASIA-PACIFIC BUILDING AUTOMATION AND CONTROLS MARKET, 2019–2027 ($BILLION)

FIGURE 44.   COMPARATIVE SHARE ANALYSIS OF LAMEA BUILDING AUTOMATION AND CONTROLS MARKET, BY COUNTRY, 2019–2027 (%)

FIGURE 45.   LATIN AMERICA BUILDING AUTOMATION AND CONTROLS MARKET, 2019–2027 ($BILLION)

FIGURE 46.   MIDDLE EAST BUILDING AUTOMATION AND CONTROLS MARKET, 2019–2027 ($BILLION)

FIGURE 47.   AFRICA BUILDING AUTOMATION AND CONTROLS MARKET, 2019–2027 ($BILLION)

FIGURE 48.   MARKET PLAYER POSITIONING, 2020

FIGURE 49.   TOP WINNING STRATEGIES, BY YEAR, 2017-2020*

FIGURE 50.   TOP WINNING STRATEGIES, BY DEVELOPMENT, 2017-2020*

FIGURE 51.   TOP WINNING STRATEGIES, BY COMPANY, 2017-2020*

FIGURE 52.   PRODUCT MAPPING OF TOP 10 PLAYERS

FIGURE 53.   COMPETITIVE DASHBOARD OF KEY PLAYER

FIGURE 54.   COMPETITIVE HEATMAP OF KEY PLAYERS

FIGURE 55.   BEIJER ELECTRONICS: NET SALES, 2017–2019 ($MILLION)

FIGURE 56.   BEIJER ELECTRONICS: REVENUE SHARE BY REGION, 2019 (%)

FIGURE 57.   HONEYWELL INTERNATIONAL INC.: R&D EXPENDITURE, 2017–2019 ($MILLION)

FIGURE 58.   HONEYWELL INTERNATIONAL INC.: REVENUE, 2017–2019 ($MILLION)

FIGURE 59.   HONEYWELL INTERNATIONAL INC.: REVENUE SHARE BY SEGMENT, 2019 (%)

FIGURE 60.   HONEYWELL INTERNATIONAL INC.: REVENUE SHARE BY REGION, 2019 (%)

FIGURE 61.   SCHNEIDER ELECTRIC, 2017–2019 ($MILLION)

FIGURE 62.   SCHNEIDER ELECTRIC: REVENUE, 2017–2019 ($MILLION)

FIGURE 63.   SCHNIEDER ELECTRIC: REVENUE SHARE BY SEGMENT, 2019 (%)

FIGURE 64.   SCHNEIDER ELECTRIC: REVENUE SHARE BY REGION, 2019 (%)

FIGURE 65.   SIEMENS AG, 2017–2019 ($MILLION)

FIGURE 66.   SIEMENS AG: REVENUE, 2017–2019 ($MILLION)

FIGURE 67.   SIEMENS AG: REVENUE SHARE BY SEGMENT, 2019 (%)

FIGURE 68.   SIEMENS AG: REVENUE SHARE BY REGION, 2019 (%)

FIGURE 69.   GENERAL ELECTRIC: R&D EXPENDITURE, 2017–2019 ($MILLION)

FIGURE 70.   GENERAL ELECTRIC: REVENUE, 2017–2019 ($MILLION)

FIGURE 71.   GENERAL ELECTRIC: REVENUE SHARE BY SEGMENT, 2019 (%)

FIGURE 72.   GENERAL ELECTRIC: REVENUE SHARE BY REGION, 2019 (%)

FIGURE 73.   ABB: R&D EXPENDITURE, 2017–2019 ($MILLION)

FIGURE 74.   ABB: NET SALES, 2017–2019 ($MILLION)

FIGURE 75.   ABB: REVENUE SHARE BY SEGMENT, 2019 (%)

FIGURE 76.   ABB: REVENUE SHARE BY GEOGRAPHY, 2019 (%)

FIGURE 77.   JOHNSON CONTROLS: R&D EXPENDITURE, 2018–2020 ($MILLION)

FIGURE 78.   JOHNSON CONTROLS: NET SALES, 2018–2020 ($MILLION)

FIGURE 79.   JOHNSON CONTROLS: REVENUE SHARE BY SEGMENT, 2020 (%)

FIGURE 80.   JOHNSON CONTROLS: REVENUE SHARE BY GEOGRAPHY, 2020 (%)

FIGURE 81.   LEGRAND: NET SALES, 2017–2019 ($MILLION)


The global building automation and controls market is expected to grow at a promising rate during the forecast period, owing to implementation of government policies, rise in need for responsive, smart, safe, commercial, and residential spaces. The building automation and controls market delivers integrated lighting, improved comfort, greater security, and better sanitation in an energy-efficient and smart way while saving the operational costs for long term.

The major factors that drive the building automation and controls market areincreasing need for advanced energy-efficient interventions, growing deployment of building automation systems, and rise in demand for convenient user experience. Moreover, constant development of the supportive regulatory structure and legislative requirements fuel the demand for intelligent building solutions.

In addition, increase in development of smart cities in emerging countries and government initiatives are expected to boost the growth of the building automation and controls market in the coming years. However, lack of interoperability between devices hampers the growth of the building automation and controls market.

By region, the building automation and controls market trends have been analyzed across North America, Europe, Asia-Pacific, and LAMEA. The analysis had identified that Europe contributed maximum revenue in 2019 and is expected to follow the same trend during the forecast period. Factors, such as increase in penetration of digital electronic devices and high adoption of advanced technologies, have provided several growth opportunities for the building automation and controls market in Europe.

The report focuses on the growth prospects, restraints, and trends of the building automation and controls market analysis. The study provides Porter’s five forces analysis to understand the impact of various factors, such as bargaining power of suppliers, competitive intensity of competitors, threat of new entrants, threat of substitutes, and bargaining power of buyers, in the building automation and controls market.
 

PURCHASE OPTIONS

Call or Email us

U.S.-Canada Toll-free: +1-800-792-5285
Int'l : +1-503-894-6022
Europe : +44-845-528-1300
Email : help@alliedmarketresearch.com
 
FREQUENTLY ASKED QUESTIONS?

A. The Building Automation and Controls Market is estimated to grow at a CAGR of 11.10% from 2020 to 2027.

A. The Building Automation and Controls Market is projected to reach $215.59 billion by 2027.

A. Rising need for advanced energy-efficient interventions, and growing deployment of building automation systems etc. drives the growth of Building Automation and Controls Market.

A. The key players profiled in the report include Honeywell International, Beijer Electronics, ABB, Siemens AG, Johnson Controls, Schneider Electric, Legrand, and many more.

A. On the basis of top growing big corporations, we select top 10 players.

A. The Building Automation and Controls Market is segmented on the basis of product type, offering, industrial vertical, and region.

A. The key growth strategies of Building Automation and Controls market players include product portfolio expansion, mergers & acquisitions, agreements, geographical expansion, and collaborations.

A. Industrial segment holds a dominant position throughout the forecast period.

A. Asia-Pacific region will grow at a highest CAGR of 13.20% during 2020 - 2027.

Looking for Customization?

 Customization Request

Have a Question?

 Speak with Analyst

Any Confusion?

 Inquire Before Buying

Have a glance of the Report

  Request Sample
RELATED TAGS

Purchase Full Report of
Building Automation And Controls Market

Start reading instantly.
This Report and over 66,944+ more Reports, Available with Avenue Library. T&C*.

  • Online Only
  • $3,456
  • Online cloud access only
  • Restricted print, copy, paste & download
  • Read only
  • Free industry update
    (Within 180 days)
  • Free report update in next update cycle
    (Dec 2021 - Dec 2022)
  • Data Pack
  • $3,840
  • Restricted to one authorized user
  • One print only
  • Available in
    Excel
  • Free industry update
    (Within 180 days)
  •   Free report update in next update cycle
    (Dec 2021 - Dec 2022)
  • Single User
  • $5,769
  • Restricted to one authorized user
  • One print only
  • Available in
    PDF
  • Free industry update
    (Within 180 days)
  •   Free report update in next update cycle
    (Dec 2021 - Dec 2022)
  • Five Users
  • $6,450
  • Limited to five authorized users
  • Print upto five copies
  • Available in
    PDF
  • Free industry update
    (Within 180 days)
  •   Free report update in next update cycle
    (Dec 2021 - Dec 2022)
  • Enterprise
    License/PDF

  • $10,995
  • Unlimited
    within
    company/enterprise
  • Available in Excel & PDF
  • Free industry update
    (Within 180 days)
  •   Free report update in next update cycle
    (Dec 2021 - Dec 2022)
  • Library
    Membership

  • $999 $ 1,175
    Per User/ Per month/ Billed annually
  • Published Content
    E-access
  • Company Profiles
    E-access
  • Newly Added Content Access
  • 10 PDF
    Downloads
  • 5 Excel Data
    Pack Downloads
  • 250 Company Profiles PDF Downloads
  • Buy Now

*Taxes/Fees, if applicable will be added during checkout. All prices in USD

RELATED REPORTS
 

Why Allied Market Research?


Infallible Methodology

To ensure high-level data integrity, accurate analysis, and impeccable forecasts

Analyst Support

For complete satisfaction

Customization

On-demand customization of scope of the report to exactly meet your needs

TARGETED MARKET VIEW

Targeted market view to provide pertinent information and save time of readers

Get fresh content delivered

Get insights on topics that are crucial for your business. Stay abreast of your interest areas.

Get Industry Data Alerts

Why Allied Market Research?

Infallible Methodology

To ensure high-level data integrity, accurate analysis, and impeccable forecasts

Analyst Support

For complete satisfaction

Customization

On-demand customization of scope of the report to exactly meet your needs

TARGETED MARKET VIEW

Targeted market view to provide pertinent information and save time of readers