0
2022
Cables Market

Cables Market

By Installation Type (Overhead, Underground, Submarine), By Voltage Type (High, Medium, Low), By End Use (Industrial, Aerospace and Defense, Oil and Gas, Energy and Power, IT and Telecommunication, Others): Global Opportunity Analysis and Industry Forecast, 2020-2030

Report Code: A16414
May 2022 | Pages: 244
Tables: 140
Charts: 48
  • Formats*:

  • pdf

    Single User License, Five User
    License & Enterprise User License

  • xls

    Data Pack Excel License

  • ppt

    It comes with the additional cost
    of $2500.00 contact sales.


The global cables market size was valued at $74.72 billion in 2020, and is projected to reach $156.49 billion by 2030, growing at a CAGR of 7.8% from 2021 to 2030.

A cable is a thick wire, or a group of wires inside a rubber or plastic covering, which is used to carry electricity or electronic signals. They are made from electrically conducting materials that are secured with one or more insulation layers and carry electrical signals & aid the generation, transmission, and distribution of electric power. The major components of a cable are conductor, dielectric, and sheath. The conducting path for the electricity in a cable is provided by the conductor. The insulation helps in withstanding the service voltage and isolates the live conductor with other objects. The sheath restricts moistures to enter and protects the cables from all external influences like chemical or electrochemical attack and fire.

The global cables market has been significantly impacted by the COVID-19 outbreak. The production facilities of the electronics and semiconductors have been halted, owing to the slowdown and unavailability of the workforce across the globe. COVID-19 outbreak has caused a significant drop in manufacturing utilization, and travel bans & facility closures that resulted in a massive decrease in workforce in the factories, which led to slowdown in the growth of the cables market in 2020. The Asian and European countries under lockdowns have suffered major loss of business and revenue, due to the shutdown of manufacturing units in the region. The operations of the production and manufacturing industries have been heavily impacted by the outbreak of the COVID-19 disease; thereby, leading to slowdown in the growth of the cables market. However, the negative impact of COVID-19 on the market is expected to remain for a short period of time, and by early 2021, the market is anticipated to observe robust recovery rate along with the extensive demand for cables products post pandemic.

Cables Market, Cables Industry, Cables Market Size, Cables Market Share, Cables Market Growth, Cables Market Trends, Cables Market Analysis, Cables Market Forecast, Cables Market Outlook, Cables Market Opportunity

COVID-19 has caused the overall semiconductor industry to mobilize quickly and to make short-term decisions with long-term implications. Semiconductor companies operate in a complex ecosystem, working across the value chain with numerous raw materials, assembly, test, package, and equipment suppliers &partners, globally. The ongoing COVID-19 pandemic has abruptly re-shaped the global economy. Sudden decline in infrastructure development and installation projects is expected to hamper the cables industry for commercial, government, industrial, residential, and more verticals.

The major purpose of cables is to transmit electric signals and electromagnetic waves from one endpoint to another. Furthermore, cables along with cable assemblies play a vital role in the integration mechanism of different systems and subsystems.

Cables Market

Rise in government initiatives to improve connectivity and surge in demand for higher bandwidth network by different industries drive the cables market growth. Moreover, surge in trend of renewable energy generation around the globe drives the growth of the global cables market forecast. In addition, increase in deployment of new power grid infrastructure boosts growth in demand for cables market share.

However, the complexity in deployment planning of cables along with the delays in authorization from governments is projected to hamper the cables market outlook during the forecast period. On the contrary, upsurge in demand for power all over the world creates lucrative cables market opportunity. According to the current cables market trends, the most widely used cables are ethernet cable and optical cable. The demand for these cables is expected to grow steadily in the forecasted period and is expected to offer lucrative cables market opportunity.

Cables Market

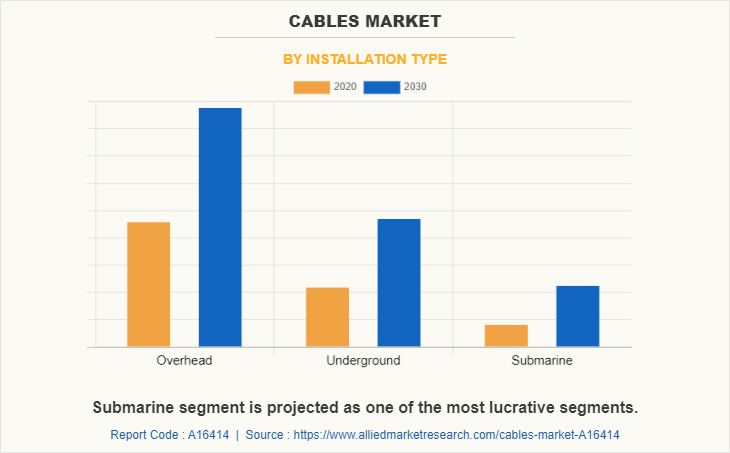
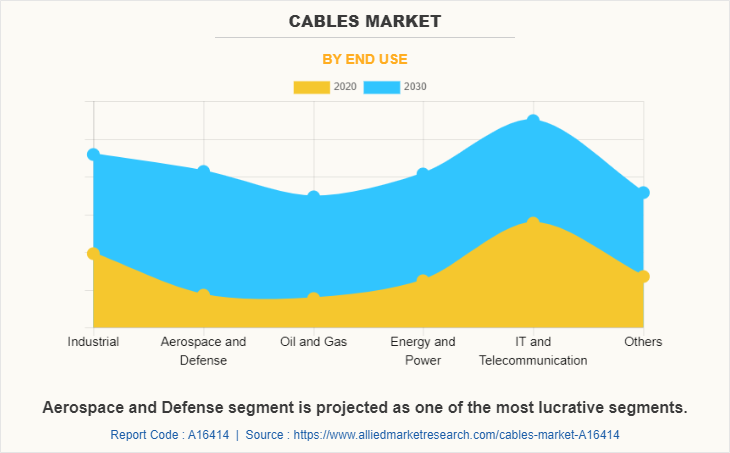
The cables market research is segmented into installation type, voltage type, and end use. By installation type, the market is divided into overhead, underground, and submarine. The over head segment dominated the market, in terms of revenue, in 2020, and is expected to follow the same trend during the forecast period. By voltage type, it is classified into high, medium, and low. Low segment was the highest revenue contributor in 2020, andis anticipated to garner significant market share during the forecast period. By end use, the market is categorized into industrial, aerospace & defense, oil & gas, energy & power, IT& telecommunication, and others. The IT and telecommunication segment dominated the market, in terms of revenue, in 2020, and is expected to follow the same trend during the forecast period.
Cables Market

Region-wise, the cables market opportunity are analyzed across North America (the U.S., Canada, and Mexico), Europe (UK, Germany, France, and the rest of the Europe), Asia-Pacific (China, Japan, India, South Korea, and the rest of the Asia-Pacific), and LAMEA (Latin America, the Middle East, and Africa). Asia-Pacific, specifically China, remains a significant participant in the global cables industry. Major organizations and government institutions in the country are intensely putting resources into the technology.

TOP IMPACTING FACTORS

The significant impacting factors in the global cables market include increase in investments in transmission and distribution of electric power, which fuels the demand for cables. In addition, the market is influenced by growth in investments in the industrial sector and rise in urbanization. However, complex fault detection and removal process of errors hamper the market growth to a certain extent. Moreover, favorable renewable energy policies provided by the government of key countries fuel the growth of the market. Each of these factors is anticipated to have a definite impact on the global cables market share during the forecast period.

COMPETITION ANALYSIS

Competitive analysis and profiles of the major cables market players, such as Prysmian Cables Systems, Nexans, ABB, Furukawa, General Cable, Axon Cable S.A.S., Polycab, KEI Industries, SUMITOMO ELECTRIC WIRING SYSTEMS, INC and Huawei Technologies Co. Ltd. are provided in this report.

Key Benefits For Stakeholders

  • This report provides a quantitative analysis of the market segments, current trends, estimations, and dynamics of the cables market analysis from 2020 to 2030 to identify the prevailing cables market opportunities.
  • The market research is offered along with information related to key drivers, restraints, and opportunities.
  • Porter's five forces analysis highlights the potency of buyers and suppliers to enable stakeholders make profit-oriented business decisions and strengthen their supplier-buyer network.
  • In-depth analysis of the cables market segmentation assists to determine the prevailing market opportunities.
  • Major countries in each region are mapped according to their revenue contribution to the global market.
  • Market player positioning facilitates benchmarking and provides a clear understanding of the present position of the market players.
  • The report includes the analysis of the regional as well as global cables market trends, key players, market segments, application areas, and market growth strategies.

Cables Market Report Highlights

Aspects Details
By Installation Type
  • Overhead
  • Underground
  • Submarine
By Voltage Type
  • High
  • Medium
  • Low
By End Use
  • Industrial
  • Aerospace and Defense
  • Oil and Gas
  • Energy and Power
  • IT and Telecommunication
  • Others
By Region
  • North America  (U.S., Canada, Mexico)
  • Europe  (U.K., Germany, France, Rest of Europe)
  • Asia-Pacific  (China, Japan, India, South Korea, Rest of Asia-Pacific)
  • LAMEA  (Latin America, Middle East, Africa)
Key Market Players Huawei Technologies, Axon Cable, Prysmian Cables Systems, ABB, Sumitomo Electric Wiring Systems, Polycab, Nexans, KEI Industries, Furukawa, General Cable
 
  • CHAPTER 1:INTRODUCTION

    • 1.1.Report description

    • 1.2.Key market segments

    • 1.3.Key benefits to the stakeholders

    • 1.4.Research Methodology

      • 1.4.1.Secondary research

      • 1.4.2.Primary research

      • 1.4.3.Analyst tools and models

  • CHAPTER 2:EXECUTIVE SUMMARY

    • 2.1.Key findings of the study

    • 2.2.CXO Perspective

  • CHAPTER 3:MARKET OVERVIEW

    • 3.1.Market definition and scope

    • 3.2.Key findings

      • 3.2.1.Top investment pockets

    • 3.3.Porter’s five forces analysis

    • 3.4.Top player positioning

    • 3.5.Market dynamics

      • 3.5.1.Drivers

      • 3.5.2.Restraints

      • 3.5.3.Opportunities

    • 3.6.COVID-19 Impact Analysis on the market

  • CHAPTER 4: CABLES MARKET, BY INSTALLATION TYPE

    • 4.1 Overview

      • 4.1.1 Market size and forecast

    • 4.2 Overhead

      • 4.2.1 Key market trends, growth factors and opportunities

      • 4.2.2 Market size and forecast, by region

      • 4.2.3 Market analysis by country

    • 4.3 Underground

      • 4.3.1 Key market trends, growth factors and opportunities

      • 4.3.2 Market size and forecast, by region

      • 4.3.3 Market analysis by country

    • 4.4 Submarine

      • 4.4.1 Key market trends, growth factors and opportunities

      • 4.4.2 Market size and forecast, by region

      • 4.4.3 Market analysis by country

  • CHAPTER 5: CABLES MARKET, BY VOLTAGE TYPE

    • 5.1 Overview

      • 5.1.1 Market size and forecast

    • 5.2 High

      • 5.2.1 Key market trends, growth factors and opportunities

      • 5.2.2 Market size and forecast, by region

      • 5.2.3 Market analysis by country

    • 5.3 Medium

      • 5.3.1 Key market trends, growth factors and opportunities

      • 5.3.2 Market size and forecast, by region

      • 5.3.3 Market analysis by country

    • 5.4 Low

      • 5.4.1 Key market trends, growth factors and opportunities

      • 5.4.2 Market size and forecast, by region

      • 5.4.3 Market analysis by country

  • CHAPTER 6: CABLES MARKET, BY END USE

    • 6.1 Overview

      • 6.1.1 Market size and forecast

    • 6.2 Industrial

      • 6.2.1 Key market trends, growth factors and opportunities

      • 6.2.2 Market size and forecast, by region

      • 6.2.3 Market analysis by country

    • 6.3 Aerospace and Defense

      • 6.3.1 Key market trends, growth factors and opportunities

      • 6.3.2 Market size and forecast, by region

      • 6.3.3 Market analysis by country

    • 6.4 Oil and Gas

      • 6.4.1 Key market trends, growth factors and opportunities

      • 6.4.2 Market size and forecast, by region

      • 6.4.3 Market analysis by country

    • 6.5 Energy and Power

      • 6.5.1 Key market trends, growth factors and opportunities

      • 6.5.2 Market size and forecast, by region

      • 6.5.3 Market analysis by country

    • 6.6 IT and Telecommunication

      • 6.6.1 Key market trends, growth factors and opportunities

      • 6.6.2 Market size and forecast, by region

      • 6.6.3 Market analysis by country

    • 6.7 Others

      • 6.7.1 Key market trends, growth factors and opportunities

      • 6.7.2 Market size and forecast, by region

      • 6.7.3 Market analysis by country

  • CHAPTER 7: CABLES MARKET, BY REGION

    • 7.1 Overview

      • 7.1.1 Market size and forecast

    • 7.2 North America

      • 7.2.1 Key trends and opportunities

      • 7.2.2 North America Market size and forecast, by Installation Type

      • 7.2.3 North America Market size and forecast, by Voltage Type

      • 7.2.4 North America Market size and forecast, by End Use

      • 7.2.5 North America Market size and forecast, by country

        • 7.2.5.1 U.S.
          • 7.2.5.1.1 Market size and forecast, by Installation Type
          • 7.2.5.1.2 Market size and forecast, by Voltage Type
          • 7.2.5.1.3 Market size and forecast, by End Use
        • 7.2.5.2 Canada
          • 7.2.5.2.1 Market size and forecast, by Installation Type
          • 7.2.5.2.2 Market size and forecast, by Voltage Type
          • 7.2.5.2.3 Market size and forecast, by End Use
        • 7.2.5.3 Mexico
          • 7.2.5.3.1 Market size and forecast, by Installation Type
          • 7.2.5.3.2 Market size and forecast, by Voltage Type
          • 7.2.5.3.3 Market size and forecast, by End Use
    • 7.3 Europe

      • 7.3.1 Key trends and opportunities

      • 7.3.2 Europe Market size and forecast, by Installation Type

      • 7.3.3 Europe Market size and forecast, by Voltage Type

      • 7.3.4 Europe Market size and forecast, by End Use

      • 7.3.5 Europe Market size and forecast, by country

        • 7.3.5.1 U.K.
          • 7.3.5.1.1 Market size and forecast, by Installation Type
          • 7.3.5.1.2 Market size and forecast, by Voltage Type
          • 7.3.5.1.3 Market size and forecast, by End Use
        • 7.3.5.2 Germany
          • 7.3.5.2.1 Market size and forecast, by Installation Type
          • 7.3.5.2.2 Market size and forecast, by Voltage Type
          • 7.3.5.2.3 Market size and forecast, by End Use
        • 7.3.5.3 France
          • 7.3.5.3.1 Market size and forecast, by Installation Type
          • 7.3.5.3.2 Market size and forecast, by Voltage Type
          • 7.3.5.3.3 Market size and forecast, by End Use
        • 7.3.5.4 Rest of Europe
          • 7.3.5.4.1 Market size and forecast, by Installation Type
          • 7.3.5.4.2 Market size and forecast, by Voltage Type
          • 7.3.5.4.3 Market size and forecast, by End Use
    • 7.4 Asia-Pacific

      • 7.4.1 Key trends and opportunities

      • 7.4.2 Asia-Pacific Market size and forecast, by Installation Type

      • 7.4.3 Asia-Pacific Market size and forecast, by Voltage Type

      • 7.4.4 Asia-Pacific Market size and forecast, by End Use

      • 7.4.5 Asia-Pacific Market size and forecast, by country

        • 7.4.5.1 China
          • 7.4.5.1.1 Market size and forecast, by Installation Type
          • 7.4.5.1.2 Market size and forecast, by Voltage Type
          • 7.4.5.1.3 Market size and forecast, by End Use
        • 7.4.5.2 Japan
          • 7.4.5.2.1 Market size and forecast, by Installation Type
          • 7.4.5.2.2 Market size and forecast, by Voltage Type
          • 7.4.5.2.3 Market size and forecast, by End Use
        • 7.4.5.3 India
          • 7.4.5.3.1 Market size and forecast, by Installation Type
          • 7.4.5.3.2 Market size and forecast, by Voltage Type
          • 7.4.5.3.3 Market size and forecast, by End Use
        • 7.4.5.4 South Korea
          • 7.4.5.4.1 Market size and forecast, by Installation Type
          • 7.4.5.4.2 Market size and forecast, by Voltage Type
          • 7.4.5.4.3 Market size and forecast, by End Use
        • 7.4.5.5 Rest of Asia-Pacific
          • 7.4.5.5.1 Market size and forecast, by Installation Type
          • 7.4.5.5.2 Market size and forecast, by Voltage Type
          • 7.4.5.5.3 Market size and forecast, by End Use
    • 7.5 LAMEA

      • 7.5.1 Key trends and opportunities

      • 7.5.2 LAMEA Market size and forecast, by Installation Type

      • 7.5.3 LAMEA Market size and forecast, by Voltage Type

      • 7.5.4 LAMEA Market size and forecast, by End Use

      • 7.5.5 LAMEA Market size and forecast, by country

        • 7.5.5.1 Latin America
          • 7.5.5.1.1 Market size and forecast, by Installation Type
          • 7.5.5.1.2 Market size and forecast, by Voltage Type
          • 7.5.5.1.3 Market size and forecast, by End Use
        • 7.5.5.2 Middle East
          • 7.5.5.2.1 Market size and forecast, by Installation Type
          • 7.5.5.2.2 Market size and forecast, by Voltage Type
          • 7.5.5.2.3 Market size and forecast, by End Use
        • 7.5.5.3 Africa
          • 7.5.5.3.1 Market size and forecast, by Installation Type
          • 7.5.5.3.2 Market size and forecast, by Voltage Type
          • 7.5.5.3.3 Market size and forecast, by End Use
  • CHAPTER 8: COMPANY LANDSCAPE

    • 8.1. Introduction

    • 8.2. Top winning strategies

    • 8.3. Product Mapping of Top 10 Player

    • 8.4. Competitive Dashboard

    • 8.5. Competitive Heatmap

    • 8.6. Key developments

  • CHAPTER 9: COMPANY PROFILES

    • 9.1 Huawei Technologies

      • 9.1.1 Company overview

      • 9.1.2 Company snapshot

      • 9.1.3 Operating business segments

      • 9.1.4 Product portfolio

      • 9.1.5 Business performance

      • 9.1.6 Key strategic moves and developments

    • 9.2 Prysmian Cables Systems

      • 9.2.1 Company overview

      • 9.2.2 Company snapshot

      • 9.2.3 Operating business segments

      • 9.2.4 Product portfolio

      • 9.2.5 Business performance

      • 9.2.6 Key strategic moves and developments

    • 9.3 Nexans

      • 9.3.1 Company overview

      • 9.3.2 Company snapshot

      • 9.3.3 Operating business segments

      • 9.3.4 Product portfolio

      • 9.3.5 Business performance

      • 9.3.6 Key strategic moves and developments

    • 9.4 ABB

      • 9.4.1 Company overview

      • 9.4.2 Company snapshot

      • 9.4.3 Operating business segments

      • 9.4.4 Product portfolio

      • 9.4.5 Business performance

      • 9.4.6 Key strategic moves and developments

    • 9.5 Furukawa

      • 9.5.1 Company overview

      • 9.5.2 Company snapshot

      • 9.5.3 Operating business segments

      • 9.5.4 Product portfolio

      • 9.5.5 Business performance

      • 9.5.6 Key strategic moves and developments

    • 9.6 General Cable

      • 9.6.1 Company overview

      • 9.6.2 Company snapshot

      • 9.6.3 Operating business segments

      • 9.6.4 Product portfolio

      • 9.6.5 Business performance

      • 9.6.6 Key strategic moves and developments

    • 9.7 Axon Cable

      • 9.7.1 Company overview

      • 9.7.2 Company snapshot

      • 9.7.3 Operating business segments

      • 9.7.4 Product portfolio

      • 9.7.5 Business performance

      • 9.7.6 Key strategic moves and developments

    • 9.8 Polycab

      • 9.8.1 Company overview

      • 9.8.2 Company snapshot

      • 9.8.3 Operating business segments

      • 9.8.4 Product portfolio

      • 9.8.5 Business performance

      • 9.8.6 Key strategic moves and developments

    • 9.9 KEI Industries

      • 9.9.1 Company overview

      • 9.9.2 Company snapshot

      • 9.9.3 Operating business segments

      • 9.9.4 Product portfolio

      • 9.9.5 Business performance

      • 9.9.6 Key strategic moves and developments

    • 9.10 Sumitomo Electric Wiring Systems

      • 9.10.1 Company overview

      • 9.10.2 Company snapshot

      • 9.10.3 Operating business segments

      • 9.10.4 Product portfolio

      • 9.10.5 Business performance

      • 9.10.6 Key strategic moves and developments

  • LIST OF TABLES

  • TABLE 1. GLOBAL CABLES MARKET, BY INSTALLATION TYPE, 2020-2030,($MILLION)
    TABLE 2. CABLES MARKET REVENUE, FOR OVERHEAD, BY REGION , 2020-2030,($MILLION)
    TABLE 3. CABLES MARKET OVERHEAD BY COUNTRY, 2020-2030,($MILLION)
    TABLE 4. CABLES MARKET REVENUE, FOR UNDERGROUND, BY REGION , 2020-2030,($MILLION)
    TABLE 5. CABLES MARKET UNDERGROUND BY COUNTRY, 2020-2030,($MILLION)
    TABLE 6. CABLES MARKET REVENUE, FOR SUBMARINE, BY REGION , 2020-2030,($MILLION)
    TABLE 7. CABLES MARKET SUBMARINE BY COUNTRY, 2020-2030,($MILLION)
    TABLE 8. GLOBAL CABLES MARKET, BY VOLTAGE TYPE, 2020-2030,($MILLION)
    TABLE 9. CABLES MARKET REVENUE, FOR HIGH, BY REGION , 2020-2030,($MILLION)
    TABLE 10. CABLES MARKET HIGH BY COUNTRY, 2020-2030,($MILLION)
    TABLE 11. CABLES MARKET REVENUE, FOR MEDIUM, BY REGION , 2020-2030,($MILLION)
    TABLE 12. CABLES MARKET MEDIUM BY COUNTRY, 2020-2030,($MILLION)
    TABLE 13. CABLES MARKET REVENUE, FOR LOW, BY REGION , 2020-2030,($MILLION)
    TABLE 14. CABLES MARKET LOW BY COUNTRY, 2020-2030,($MILLION)
    TABLE 15. GLOBAL CABLES MARKET, BY END USE, 2020-2030,($MILLION)
    TABLE 16. CABLES MARKET REVENUE, FOR INDUSTRIAL, BY REGION , 2020-2030,($MILLION)
    TABLE 17. CABLES MARKET INDUSTRIAL BY COUNTRY, 2020-2030,($MILLION)
    TABLE 18. CABLES MARKET REVENUE, FOR AEROSPACE AND DEFENSE, BY REGION , 2020-2030,($MILLION)
    TABLE 19. CABLES MARKET AEROSPACE AND DEFENSE BY COUNTRY, 2020-2030,($MILLION)
    TABLE 20. CABLES MARKET REVENUE, FOR OIL AND GAS, BY REGION , 2020-2030,($MILLION)
    TABLE 21. CABLES MARKET OIL AND GAS BY COUNTRY, 2020-2030,($MILLION)
    TABLE 22. CABLES MARKET REVENUE, FOR ENERGY AND POWER, BY REGION , 2020-2030,($MILLION)
    TABLE 23. CABLES MARKET ENERGY AND POWER BY COUNTRY, 2020-2030,($MILLION)
    TABLE 24. CABLES MARKET REVENUE, FOR IT AND TELECOMMUNICATION, BY REGION , 2020-2030,($MILLION)
    TABLE 25. CABLES MARKET IT AND TELECOMMUNICATION BY COUNTRY, 2020-2030,($MILLION)
    TABLE 26. CABLES MARKET REVENUE, FOR OTHERS, BY REGION , 2020-2030,($MILLION)
    TABLE 27. CABLES MARKET OTHERS BY COUNTRY, 2020-2030,($MILLION)
    TABLE 28. CABLES MARKET, BY REGION, 2020-2030,($MILLION)
    TABLE 29. NORTH AMERICA CABLES MARKET, BY INSTALLATION TYPE, 2020-2030,($MILLION)
    TABLE 30. NORTH AMERICA CABLES MARKET, BY VOLTAGE TYPE, 2020-2030,($MILLION)
    TABLE 31. NORTH AMERICA CABLES MARKET, BY END USE, 2020-2030,($MILLION)
    TABLE 32. NORTH AMERICA CABLES MARKET, BY COUNTRY, 2020-2030,($MILLION)
    TABLE 33. U.S. CABLES MARKET BY INSTALLATION TYPE 2020-2030,($MILLION)
    TABLE 34. U.S. CABLES MARKET BY VOLTAGE TYPE 2020-2030,($MILLION)
    TABLE 35. U.S. CABLES MARKET BY END USE 2020-2030,($MILLION)
    TABLE 36. CANADA CABLES MARKET BY INSTALLATION TYPE 2020-2030,($MILLION)
    TABLE 37. CANADA CABLES MARKET BY VOLTAGE TYPE 2020-2030,($MILLION)
    TABLE 38. CANADA CABLES MARKET BY END USE 2020-2030,($MILLION)
    TABLE 39. MEXICO CABLES MARKET BY INSTALLATION TYPE 2020-2030,($MILLION)
    TABLE 40. MEXICO CABLES MARKET BY VOLTAGE TYPE 2020-2030,($MILLION)
    TABLE 41. MEXICO CABLES MARKET BY END USE 2020-2030,($MILLION)
    TABLE 42. EUROPE CABLES MARKET, BY INSTALLATION TYPE, 2020-2030,($MILLION)
    TABLE 43. EUROPE CABLES MARKET, BY VOLTAGE TYPE, 2020-2030,($MILLION)
    TABLE 44. EUROPE CABLES MARKET, BY END USE, 2020-2030,($MILLION)
    TABLE 45. EUROPE CABLES MARKET, BY COUNTRY, 2020-2030,($MILLION)
    TABLE 46. U.K. CABLES MARKET BY INSTALLATION TYPE 2020-2030,($MILLION)
    TABLE 47. U.K. CABLES MARKET BY VOLTAGE TYPE 2020-2030,($MILLION)
    TABLE 48. U.K. CABLES MARKET BY END USE 2020-2030,($MILLION)
    TABLE 49. GERMANY CABLES MARKET BY INSTALLATION TYPE 2020-2030,($MILLION)
    TABLE 50. GERMANY CABLES MARKET BY VOLTAGE TYPE 2020-2030,($MILLION)
    TABLE 51. GERMANY CABLES MARKET BY END USE 2020-2030,($MILLION)
    TABLE 52. FRANCE CABLES MARKET BY INSTALLATION TYPE 2020-2030,($MILLION)
    TABLE 53. FRANCE CABLES MARKET BY VOLTAGE TYPE 2020-2030,($MILLION)
    TABLE 54. FRANCE CABLES MARKET BY END USE 2020-2030,($MILLION)
    TABLE 55. REST OF EUROPE CABLES MARKET BY INSTALLATION TYPE 2020-2030,($MILLION)
    TABLE 56. REST OF EUROPE CABLES MARKET BY VOLTAGE TYPE 2020-2030,($MILLION)
    TABLE 57. REST OF EUROPE CABLES MARKET BY END USE 2020-2030,($MILLION)
    TABLE 58. ASIA-PACIFIC CABLES MARKET, BY INSTALLATION TYPE, 2020-2030,($MILLION)
    TABLE 59. ASIA-PACIFIC CABLES MARKET, BY VOLTAGE TYPE, 2020-2030,($MILLION)
    TABLE 60. ASIA-PACIFIC CABLES MARKET, BY END USE, 2020-2030,($MILLION)
    TABLE 61. ASIA-PACIFIC CABLES MARKET, BY COUNTRY, 2020-2030,($MILLION)
    TABLE 62. CHINA CABLES MARKET BY INSTALLATION TYPE 2020-2030,($MILLION)
    TABLE 63. CHINA CABLES MARKET BY VOLTAGE TYPE 2020-2030,($MILLION)
    TABLE 64. CHINA CABLES MARKET BY END USE 2020-2030,($MILLION)
    TABLE 65. JAPAN CABLES MARKET BY INSTALLATION TYPE 2020-2030,($MILLION)
    TABLE 66. JAPAN CABLES MARKET BY VOLTAGE TYPE 2020-2030,($MILLION)
    TABLE 67. JAPAN CABLES MARKET BY END USE 2020-2030,($MILLION)
    TABLE 68. INDIA CABLES MARKET BY INSTALLATION TYPE 2020-2030,($MILLION)
    TABLE 69. INDIA CABLES MARKET BY VOLTAGE TYPE 2020-2030,($MILLION)
    TABLE 70. INDIA CABLES MARKET BY END USE 2020-2030,($MILLION)
    TABLE 71. SOUTH KOREA CABLES MARKET BY INSTALLATION TYPE 2020-2030,($MILLION)
    TABLE 72. SOUTH KOREA CABLES MARKET BY VOLTAGE TYPE 2020-2030,($MILLION)
    TABLE 73. SOUTH KOREA CABLES MARKET BY END USE 2020-2030,($MILLION)
    TABLE 74. REST OF ASIA-PACIFIC CABLES MARKET BY INSTALLATION TYPE 2020-2030,($MILLION)
    TABLE 75. REST OF ASIA-PACIFIC CABLES MARKET BY VOLTAGE TYPE 2020-2030,($MILLION)
    TABLE 76. REST OF ASIA-PACIFIC CABLES MARKET BY END USE 2020-2030,($MILLION)
    TABLE 77. LAMEA CABLES MARKET, BY INSTALLATION TYPE, 2020-2030,($MILLION)
    TABLE 78. LAMEA CABLES MARKET, BY VOLTAGE TYPE, 2020-2030,($MILLION)
    TABLE 79. LAMEA CABLES MARKET, BY END USE, 2020-2030,($MILLION)
    TABLE 80. LAMEA CABLES MARKET, BY COUNTRY, 2020-2030,($MILLION)
    TABLE 81. LATIN AMERICA CABLES MARKET BY INSTALLATION TYPE 2020-2030,($MILLION)
    TABLE 82. LATIN AMERICA CABLES MARKET BY VOLTAGE TYPE 2020-2030,($MILLION)
    TABLE 83. LATIN AMERICA CABLES MARKET BY END USE 2020-2030,($MILLION)
    TABLE 84. MIDDLE EAST CABLES MARKET BY INSTALLATION TYPE 2020-2030,($MILLION)
    TABLE 85. MIDDLE EAST CABLES MARKET BY VOLTAGE TYPE 2020-2030,($MILLION)
    TABLE 86. MIDDLE EAST CABLES MARKET BY END USE 2020-2030,($MILLION)
    TABLE 87. AFRICA CABLES MARKET BY INSTALLATION TYPE 2020-2030,($MILLION)
    TABLE 88. AFRICA CABLES MARKET BY VOLTAGE TYPE 2020-2030,($MILLION)
    TABLE 89. AFRICA CABLES MARKET BY END USE 2020-2030,($MILLION)
  • LIST OF FIGURES

  • FIGURE 1.CABLES MARKET SEGMENTATION
    FIGURE 2.CABLES MARKET,2020-2030
    FIGURE 3.CABLES MARKET,2020-2030
    FIGURE 4. TOP INVESTMENT POCKETS, BY REGION
    FIGURE 5.PORTER FIVE-1
    FIGURE 6.PORTER FIVE-2
    FIGURE 7.PORTER FIVE-3
    FIGURE 8.PORTER FIVE-4
    FIGURE 9.PORTER FIVE-5
    FIGURE 10.TOP PLAYER POSITIONING
    FIGURE 11.CABLES MARKET:DRIVERS, RESTRAINTS AND OPPORTUNITIES
    FIGURE 12.CABLES MARKET,BY INSTALLATION TYPE,2020(%)
    FIGURE 13.COMPARATIVE SHARE ANALYSIS OF OVERHEAD CABLES MARKET,2020-2030(%)
    FIGURE 14.COMPARATIVE SHARE ANALYSIS OF UNDERGROUND CABLES MARKET,2020-2030(%)
    FIGURE 15.COMPARATIVE SHARE ANALYSIS OF SUBMARINE CABLES MARKET,2020-2030(%)
    FIGURE 16.CABLES MARKET,BY VOLTAGE TYPE,2020(%)
    FIGURE 17.COMPARATIVE SHARE ANALYSIS OF HIGH CABLES MARKET,2020-2030(%)
    FIGURE 18.COMPARATIVE SHARE ANALYSIS OF MEDIUM CABLES MARKET,2020-2030(%)
    FIGURE 19.COMPARATIVE SHARE ANALYSIS OF LOW CABLES MARKET,2020-2030(%)
    FIGURE 20.CABLES MARKET,BY END USE,2020(%)
    FIGURE 21.COMPARATIVE SHARE ANALYSIS OF INDUSTRIAL CABLES MARKET,2020-2030(%)
    FIGURE 22.COMPARATIVE SHARE ANALYSIS OF AEROSPACE AND DEFENSE CABLES MARKET,2020-2030(%)
    FIGURE 23.COMPARATIVE SHARE ANALYSIS OF OIL AND GAS CABLES MARKET,2020-2030(%)
    FIGURE 24.COMPARATIVE SHARE ANALYSIS OF ENERGY AND POWER CABLES MARKET,2020-2030(%)
    FIGURE 25.COMPARATIVE SHARE ANALYSIS OF IT AND TELECOMMUNICATION CABLES MARKET,2020-2030(%)
    FIGURE 26.COMPARATIVE SHARE ANALYSIS OF OTHERS CABLES MARKET,2020-2030(%)
    FIGURE 27.CABLES MARKET BY REGION,2020
    FIGURE 28.U.S. CABLES MARKET,2020-2030($MILLION)
    FIGURE 29.CANADA CABLES MARKET,2020-2030($MILLION)
    FIGURE 30.MEXICO CABLES MARKET,2020-2030($MILLION)
    FIGURE 31.U.K. CABLES MARKET,2020-2030($MILLION)
    FIGURE 32.GERMANY CABLES MARKET,2020-2030($MILLION)
    FIGURE 33.FRANCE CABLES MARKET,2020-2030($MILLION)
    FIGURE 34.REST OF EUROPE CABLES MARKET,2020-2030($MILLION)
    FIGURE 35.CHINA CABLES MARKET,2020-2030($MILLION)
    FIGURE 36.JAPAN CABLES MARKET,2020-2030($MILLION)
    FIGURE 37.INDIA CABLES MARKET,2020-2030($MILLION)
    FIGURE 38.SOUTH KOREA CABLES MARKET,2020-2030($MILLION)
    FIGURE 39.REST OF ASIA-PACIFIC CABLES MARKET,2020-2030($MILLION)
    FIGURE 40.LATIN AMERICA CABLES MARKET,2020-2030($MILLION)
    FIGURE 41.MIDDLE EAST CABLES MARKET,2020-2030($MILLION)
    FIGURE 42.AFRICA CABLES MARKET,2020-2030($MILLION)
    FIGURE 43. TOP WINNING STRATEGIES, BY YEAR
    FIGURE 44. TOP WINNING STRATEGIES, BY DEVELOPMENT
    FIGURE 45. TOP WINNING STRATEGIES, BY COMPANY
    FIGURE 46.PRODUCT MAPPING OF TOP 10 PLAYERS
    FIGURE 47.COMPETITIVE DASHBOARD
    FIGURE 48.COMPETITIVE HEATMAP OF TOP 10 KEY PLAYERS


In accordance with several interviews that were conducted with the top level CXOs, the cable market is anticipated to depict a prominent growth during the forecast period, owing to various factors, such as increase in investments in transmission and distribution of electric power that fuels the demand for cables. In addition, the market is influenced by growth in investments in the industrial sector and rise in urbanization to drive the market growth. However, complex fault detection and removal process of errors hamper the market growth to a certain extent. Moreover, favorable renewable energy policies provided by the government of key countries fuel the growth of the market. Each of these factors is anticipated to have a definite impact on the global cables market during the forecast period.

The cables market exhibits high growth potential in commercial and industrial sectors. The current business scenario has witnessed an increase in demand for energy, particularly in developing regions such as China and India, owing to surge in population and rise in demand for energy. Companies in this industry have adopted various innovative techniques, such as mergers and acquisitions to strengthen their business position in the competitive matrix.

PURCHASE OPTIONS

Call or Email us

U.S.-Canada Toll-free: +1-800-792-5285
Int'l : +1-503-894-6022
Europe : +44-845-528-1300
Email : help@alliedmarketresearch.com
 
FREQUENTLY ASKED QUESTIONS?

A. Increasing demand for fiber optic cables is expected to derive the market in the coming years

A. Overhead cables are the leading cables type in the industry

A. Asia-Pacific is the largest regional market in cable industry

A. The market size for cable industry in 2020 is 74.72 Billion

A. Prysmian Cables Systems, Nexans, KEI Industries and General Cable are expected to hold significant market share

A. The global Cables is expected to register a CAGR of 7.8% during the forecast period

A. The significant impacting factors in the global cables market include increase in investments in transmission and distribution of electric power, which fuels the demand for cables. In addition, the market is influenced by growth in investments in the industrial sector and rise in urbanization. However, complex fault detection and removal process of errors hamper the market growth to a certain extent. Moreover, favorable renewable energy policies provided by the government of key countries fuel the growth of the market. Each of these factors is anticipated to have a definite impact on the global cables market share during the forecast period.

A. The cables market research is segmented into installation type, voltage type, and end use. By installation type, the market is divided into overhead, underground, and submarine. By voltage type, it is classified into high, medium, and low. By end use, the market is categorized into industrial, aerospace & defense, oil & gas, energy & power, IT& telecommunication, and others.

A. Market Players have adopted, product launches, business expansion and agreement as growth strategies

A. The global cable market is significantly affected by the emergence of COVID-19, owing to the shutdown of manufacturing units globally. However, the market is expected to register significant growth in the coming years due to the adoption of data communication solutions in regions worldwide

Looking for Customization?

 Customization Request

Have a Question?

 Speak with Analyst

Any Confusion?

 Inquire Before Buying

Have a glance of the Report

  Request Sample
RELATED TAGS

Purchase Full Report of
Cables Market

Start reading instantly.
This Report and over 66,782+ more Reports, Available with Avenue Library. T&C*.

  • Online Only
  • $3,456
  • Online cloud access only
  • Restricted print, copy, paste & download
  • Read only
  • Free industry update
    (Within 180 days)
  • Free report update in next update cycle
    (May 2023 - May 2024)
  • Data Pack
  • $3,840
  • Restricted to one authorized user
  • One print only
  • Available in
    Excel
  • Free industry update
    (Within 180 days)
  •   Free report update in next update cycle
    (May 2023 - May 2024)
  • Single User
  • $5,769
  • Restricted to one authorized user
  • One print only
  • Available in
    PDF
  • Free industry update
    (Within 180 days)
  •   Free report update in next update cycle
    (May 2023 - May 2024)
  • Five Users
  • $6,450
  • Limited to five authorized users
  • Print upto five copies
  • Available in
    PDF
  • Free industry update
    (Within 180 days)
  •   Free report update in next update cycle
    (May 2023 - May 2024)
  • Enterprise
    License/PDF

  • $10,995
  • Unlimited
    within
    company/enterprise
  • Available in Excel & PDF
  • Free industry update
    (Within 180 days)
  •   Free report update in next update cycle
    (May 2023 - May 2024)
  • Library
    Membership

  • $999 $ 1,175
    Per User/ Per month/ Billed annually
  • Published Content
    E-access
  • Company Profiles
    E-access
  • Newly Added Content Access
  • 10 PDF
    Downloads
  • 5 Excel Data
    Pack Downloads
  • 250 Company Profiles PDF Downloads
  • Buy Now

*Taxes/Fees, if applicable will be added during checkout. All prices in USD

RELATED REPORTS
 

Why Allied Market Research?


Infallible Methodology

To ensure high-level data integrity, accurate analysis, and impeccable forecasts

Analyst Support

For complete satisfaction

Customization

On-demand customization of scope of the report to exactly meet your needs

TARGETED MARKET VIEW

Targeted market view to provide pertinent information and save time of readers

Get fresh content delivered

Get insights on topics that are crucial for your business. Stay abreast of your interest areas.

Get Industry Data Alerts

Why Allied Market Research?

Infallible Methodology

To ensure high-level data integrity, accurate analysis, and impeccable forecasts

Analyst Support

For complete satisfaction

Customization

On-demand customization of scope of the report to exactly meet your needs

TARGETED MARKET VIEW

Targeted market view to provide pertinent information and save time of readers