
CAR T-Cell Therapy Market Overview
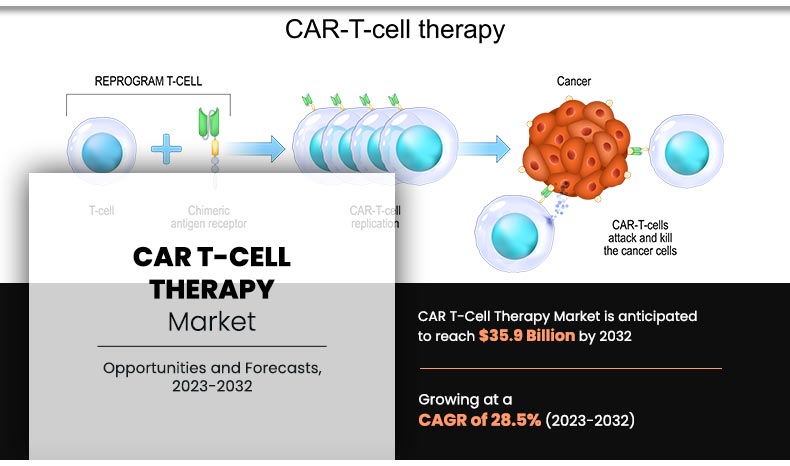
The global CAR T-cell therapy market size was valued at $2.69 billion in 2022, and is projected to reach $35.9 billion by 2032, growing at a CAGR of 28.5% from 2022 to 2032. The growth of the CAR T-cell therapy market is driven by rising cancer prevalence, increasing clinical trial success rates, regulatory approvals, and advancements in gene editing technologies. Additionally, growing investments by biotechnology firms and demand for personalized medicine further contribute to the growth of the market.
Market Dynamics & Insights
The CAR T-Cell Therapy industry in North America held a significant share of over 62.1% in 2022.
The CAR T-Cell Therapy industry in China is expected to grow significantly at a CAGR of 25.8% from 2023 to 2032.
By drug type, the axicabtagene ciloleucel segment held the largest share in the CAR T-cell therapy market in 2022.
By indication, the lymphoma segment held the largest share in the CAR T-cell therapy market in 2022.
By end user, the cancer centers segment is expected to show the fastest market growth during the forecast period.
Market Size Future Outlook
2022 Market Size: $2.69 Billion
2032 Projected Market Size: $35.95 Billion
CAGR (2023-2032): 28.5%
North America: Largest market in 2022
Asia Pacific: Fastest growing market
The growth of the CAR T-cell therapy market is driven by increase in prevalence of leukemia across the globe, increase in investment for research and development of the new CAR T-cell therapy, and high effectivity of CAR T-cell therapy over other conventional drugs for cancer treatment. According to the Leukemia Research Foundation, an estimate of 6,660 new cases of acute lymphoblastic leukemia were diagnosed in 2022. This rise in cases of leukemia has propelled the demand for CAR T-cell therapy, which drives the market growth.
Key Takeaways
- By drug type, the axicabtagene ciloleucel segment held the largest share in the CAR T-cell therapy market in 2022.
- By indication, the lymphoma segment held the largest share in the CAR T-cell therapy market in 2022.
- By end user, the cancer centers segment is expected to show the fastest market growth during the forecast period.
- Region-wise, North America held the largest CAR T-cell therapy market share in 2022.
CAR T-cell therapy represents a groundbreaking approach in the field of cancer treatment. This innovative immunotherapy harnesses the power of the patient's own immune system to combat cancer. CAR T-cell therapy has shown remarkable success in treating certain types of hematologic malignancies, such as certain forms of leukemia and lymphoma, demonstrating its potential as a transformative therapeutic option for patients who have not responded to conventional treatments.
Market Dynamics
Rise in prevalence of leukemia, surge in research and development activities to develop new CAR T-cell therapy, and high effectivity of CAR T-cell therapy over other conventional drugs for cancer treatment are the key factors driving the growth of the CAR T-cell therapy market.
Rise in prevalence of leukemia has emerged as a pivotal driver propelling the growth of the CAR T-cell therapy market. Leukemia, characterized by the uncontrolled proliferation of abnormal white blood cells, has witnessed a substantial rise in its incidence over recent years. For instance, according to American Cancer Society, in 2022, it was estimated that approximately 60,650 new cases of leukemia were diagnosed in the U.S. This surge can be attributed to a myriad of factors, including genetic predispositions, environmental exposures, and lifestyle changes. CAR T-cell therapy, a groundbreaking immunotherapy, has gained prominence as a promising solution for leukemia treatment. This therapeutic approach involves the modification of a patient's own T cells to express CARs, enabling them to recognize and eliminate cancer cells more effectively.
The remarkable success observed in clinical trials, particularly in treating B-cell acute lymphoblastic leukemia (ALL) and other hematological malignancies, has catapulted CAR T-cell therapy to the forefront of cancer treatment. Consequently, rise in leukemia cases has not only underscored the urgent need for advanced and targeted therapies but has also positioned CAR T-cell therapy as a transformative and increasingly indispensable component in the ongoing battle against leukemia. Thus, rise in prevalence of leukemia is expected to significantly contribute in the growth of the CAR T-cell therapy market.
Furthermore, the CAR T-cell therapy has witnessed significant surge in research and development activities, contributing significantly in the growth of the CAR T-cell therapy market. Researchers and pharmaceutical companies are investing extensively in the development of novel CAR T-cell therapies, recognizing their potential to revolutionize the field of oncology. This heightened interest stems from the remarkable success stories associated with CAR T-cell therapy, which has demonstrated unprecedented efficacy in treating certain types of hematologic malignancies, particularly B-cell malignancies.
According to National Cancer Institute, it was reported that since 2017, six CAR T-cell therapies have been approved by the Food and Drug Administration (FDA). All are approved for the treatment of blood cancers, including lymphomas, some forms of leukemia, and, most recently, multiple myeloma. Thus, surge in research and development in the field of CAR T-cell therapies is expected to drive the growth of the CAR T-cell therapy market.
In addition, high effectivity of CAR T-cell therapy over other conventional drugs for cancer treatment is expected to drive the growth of the CAR T-cell therapy market. Unlike conventional treatments such as chemotherapy or radiation, which often exhibit systemic toxicity and limited specificity, CAR T-cell therapy targets cancer cells directly, offering a highly effective and targeted solution. CAR T-cell therapy involves genetically modifying a patient's T-cells to express chimeric antigen receptors (CARs), which specifically recognize and bind to cancer cells. This targeted approach significantly reduces damage to healthy cells and minimizes adverse side effects commonly associated with traditional treatments.
Clinical trials and real-world applications of CAR T-cell therapy have demonstrated unprecedented success, especially in hematological malignancies such as certain types of leukemia and lymphomas. Patients who have undergone CAR T-cell therapy often experience sustained remissions, offering a potential cure rather than merely managing the disease.
For instance, according to a 2023 report by National Library of Medicine, it was reported that CAR-T cells, have generated extraordinary results in phase I/II clinical trials in the treatment of CD19+ B-cell hematological malignancies. In addition, according to a 2022 report by National Cancer Institute, it was reported that, in two large clinical trials, CAR T-cell therapy proved to be more effective than the standard treatment for patients with non-Hodgkin lymphoma whose cancer returned after their initial, or first-line, chemotherapy. Thus, high efficiency of the CAR T-cell therapy in treating the lymphoma is expected to drive the growth of the CAR T-cell therapy market.
However, high cost of CAR T-cell therapy might restrain the growth of the CAR T-cell therapy market. The intricate and highly personalized nature of CAR T-cell therapy, involving the extraction and genetic modification of a patient's own T cells to specifically target cancer cells, contributes substantially to the elevated costs.
The complex and resource-intensive manufacturing processes, including the genetic engineering techniques employed to modify the T cells, as well as the rigorous quality control measures implemented to ensure the safety and efficacy of the therapy, drive increase production costs significantly.
In addition, the need for specialized infrastructure, such as cleanroom facilities, and the intricate coordination required for timely collection, modification, and reinfusion of T cells further contribute to the overall expenses. As a result, the high cost becomes a formidable hurdle for widespread adoption and accessibility, limiting the potential benefits of CAR T-cell therapy to a select few who can afford it.
Segmental Overview
The CAR T-cell therapy market is segmented on the basis of drug type, indication, end user, and region. On the basis of drug type, the market is classified into axicabtagene ciloleucel, tisagenlecleucel, brexucabtagene autoleucel, and others. By indication, the market is segregated into lymphoma, acute lymphocytic leukemia, and others. Depending on end user, it is fragmented into hospitals and cancer treatment centers. Region-wise, the market is analyzed across North America (the U.S., and Canada), Europe (Germany, France, the UK, and rest of Europe), Asia-Pacific (Japan, China, and rest of Asia-Pacific), and LAMEA (Latin America and Middle East and Africa).
By Drug Type
On the basis of drug type, the CAR T-cell therapy market is categorized into axicabtagene ciloleucel, tisagenlecleucel, brexucabtagene autoleucel, and others. The axicabtagene ciloleucel segment dominated the global market in 2022 owing to high adoption of axicabtagene ciloleucel for the treatment of adult patients with large B-cell lymphoma that is refractory to first-line chemoimmunotherapy or that relapses within 12 months of first-line chemoimmunotherapy.
By Drug Type
Axicabtagene Ciloleucel segment held a dominant position in the market in 2022 and Other is anticipated to grow at a fastest rate during the forecast period.
By Indication
On the basis of indication, the CAR T-cell therapy market is categorized into lymphoma, acute lymphocytic leukemia, and others. The lymphoma segment dominated the global market in 2022 owing to high prevalence of lymphoma globally. However, the acute lymphocytic leukemia segment is expected to register the fastest growth during the forecasted period, owing to research and development activities to develop CAR T-cell therapy to treat acute lymphocytic leukemia.
By Indication
Lymphoma segment held a dominant position in the market in 2022 and Acute Lymphocytic Leukemia is anticipated to grow at a fastest rate during the forecast period.
By End User
On the basis of end user, the market is categorized into hospitals and cancer treatment centers. The hospitals segment dominated the CAR T-cell therapy market in 2022, owing to high patient base getting cancer treatment in hospitals. However, the cancer treatment centers segment is expected to register the fastest growth during the forecast period, owing to availability of a wide range of choice of treatment and increase in the number of cancer centers in some developing nations.
By End User
Hospital segment held a dominant position in the market in 2022 and Cancer Treatment Centers is anticipated to grow at a fastest rate during the forecast period.
By Region
The CAR T-cell therapy market is analyzed across North America, Europe, Asia-Pacific, and LAMEA. North America dominated the market share in terms of revenue in 2022. The growth in this region is mainly attributed to high R&D activities to develop new CAR T-cell therapies, and strong presence of key players in the region. In addition, the presence of several major players, such as Bristol-Myers Squibb, Johnson & Johnson, Gilead Sciences, and Intellia Therapeutics., and Pfizer Inc. contribute to the market growth in the region.
Europe is expected to grow at the highest rate during the forecast period. This is attributed to high prevalence rate of cancer, a large and diverse population, improving healthcare infrastructure, and rise in geriatric population as they are more prone to the cancer disease. In addition, the rise in research and clinical trials, growing awareness, and surge in pharmaceutical and biotechnology investments for the development of novel drugs are the factors that drive the CAR T-cell therapy market growth in this region.
By Region
North America segment held a dominant position in the market in 2022 and Europe is anticipated to grow at a fastest rate during the forecast period.
Competition Analysis
Competitive analysis and profiles of the major players in the CAR T-cell therapy market growth, such as Autolus Therapeutics, 2Seventy Bio, Inc., Bristol-Myers Squibb, Gilead Sciences, Intellia Therapeutics, Caribou Biosciences, Inc., Cartesian Therapeutics, Inc, Novartis AG, Pfizer, and Johnson and Johnson. Major players have adopted clinical trials, product approval, collaboration, strategic alliance and merger as a key developmental strategy to improve the product portfolio and gain a strong foothold in the CAR T-cell therapy market.
Recent Product Approvals in the CAR T-cell therapy market
- In December 2023, Bristol-Myers Squibb announced that it received manufacturing and marketing approval of the supplemental New Drug Application for an additional indication for Abecma (idecabtagene vicleucel), a B-cell maturation antigen (BCMA)-directed chimeric antigen receptor (CAR) T cell immunotherapy, for patients with relapsed or refractory multiple myeloma (RRMM) who have received at least two prior therapies, including an immunomodulatory agent, a proteasome inhibitor, and an anti-CD38 antibody.
Recent Clinical Trials in the CAR T-cell therapy market
- In May 2023, Autolus Therapeutics plc announced that the abstract for the pivotal Phase 2 FELIX study of obecabtagene autoleucel (obe-cel) in relapsed/refractory (r/r) adult B-cell Acute Lymphoblastic Leukemia (ALL) has been selected for an oral presentation at the European Hematology Association (EHA) 2023 Congress.
Recent Collaboration in the CAR T-cell therapy market
- In April 2022, Autolus Therapeutics plc, announced that it has collaborated with Cardinal Health Inc. to support the launch and commercialization of its CAR T-cell therapies in the U.S., subject to FDA approval.
Recent Strategic Alliance in the CAR T-cell therapy market
- In September 2023, 2seventy bio, Inc. and JW Therapeutics announced their intention to expand their strategic alliance. The companies intend to add up to two additional candidates from the 2seventy portfolio, one in solid tumor indications using T-cell receptor (TCR) based technology and a second in autoimmune disease using a CAR T cell approach.
Recent Merger in the CAR T-cell therapy market
- In November 2023, Selecta Biosciences, Inc. announced that it merged with Cartesian Therapeutics, Inc. With the cash from both companies at closing and the proceeds of the concurrent private financing, the combined company is expected to have over $110 million on hand to support the development of the Cartesian pipeline through the Phase 3 study of lead product candidate, Descartes-08, a potential first-in-class RNA-engineered chimeric antigen receptor T-cell therapy (rCAR-T) for the treatment of MG, as well as the advancement of additional RNA cell therapy programs.
CAR T-Cell Therapy Market Report Highlights
| Aspects | Details |
| Market Size By 2031 | USD 6.1 billion |
| Growth Rate | CAGR of 13.5% |
| Forecast period | 2021 - 2031 |
| Report Pages | 219 |
| By Drug type |
|
| By Indication |
|
| By End user |
|
| By Region |
|
| Key Market Players | Sorrento Therapeutics, Inc., Miltenyi Biotech, Autolus Therapeutics, Bluebird Bio, Inc., Celgene Corporation, Caribou Biosciences, Inc., Gilead Sciences, Inc. (Kite Pharma Inc.), Pfizer, Inc., Cartesian Therapeutics, Inc., Juno Therapeutics, Inc., Merck & Co., Inc., Cellectis, Intellia Therapeutics, Celyad Oncology, Novartis AG, Bristol-Myers Squibb |
Analyst Review
This section provides various opinions of CAR T-cell therapy market. CAR T-cell therapy medicines help in the treatment of lymphoma, acute lymphocytic leukemia, and multiple myeloma blood cancer. CAR T-cell therapy survives for a long time in the body, as it has the ability to recognize and target cancer cells even if the cancer relapses.
CAR T-cell therapy is gaining high traction in the market, owing to increase in prevalence of cancer, rise in R&D investments in drug discovery & development, and increase in awareness regarding CAR T-cell therapy & diagnosis of cancer. Rapidly expanding clinical trial activities, recent commercialization of CAR-T-cell therapy, and key players in the market focusing on adopting strategies to increase accessibility and utilization of CAR T-cell therapy products in developing economies, are expected to fuel the market growth during the forecast period. However, complications and side-effects associated with CAR-T-cell therapy and high cost of CAR-T-cell therapy hinder the growth of the market.
North America is expected to witness the highest growth during the forecast period, in terms of revenue, owing to increase in cases of cancer, robust healthcare infrastructure, presence of key players, and rise in healthcare expenditure. However, Asia-Pacific is anticipated to witness notable growth, owing to rise in geriatric population, unmet medical demands, initiatives by government & non-governmental organizations (NGOs) to promote awareness regarding CAR T-cell therapy, and increase in public–private investments in the healthcare sector.
The market value of CAR T-Cell Therapy Market in 2032 is $35.9 billion.
The forecast period for CAR T-Cell Therapy Market is 2023 to 2032.
The base year is 2022 in CAR T-Cell Therapy Market.
Bristol-Myers Squibb Company, Johnson and Johnson, Gilead Sciences, Novartis AG, and Pfizer held a high market position in 2022.
Rise in prevalence of leukemia, surge in research and development activities to develop new CAR T-cell therapy and high effectivity of CAR T-cell therapy over other conventional drugs for cancer treatment are the major factors that drive the market growth.
CAR T-cell therapy is an innovative and promising form of immunotherapy designed to treat certain types of cancer
Loading Table Of Content...
Loading Research Methodology...

