0
Upcoming Allied Market Research
2023
Cardiovascular Ultrasound Market

Cardiovascular Ultrasound Market

by Test Type (Transthoracic Echocardiogram, Transesophageal Echocardiogram, Stress Echocardiogram, Other Echocardiograms (Fetal and Intracardiac Echocardiograms)), by Technology (2D, 3D 4D, Doppler Imaging), by Device Display (Color Display, Black White (B/W) Display) and by End User (Hospitals, Cardiology Centers, Ambulatory, Home Care, Ambulatory Centers, Others (Research Institutes, Medical Device, and Pharmaceutical Companies)): Global Opportunity Analysis and Industry Forecast, 2023-2032

Report Code: A02492
Nov 2023 | Pages: NA
Tables: NA
Charts: NA
  • Formats*:

  • pdf

    Single User License, Five User
    License & Enterprise User License

  • xls

    Data Pack Excel License

  • ppt

    It comes with the additional cost
    of $2500.00 contact sales.


COVID-19

Pandemic disrupted the entire world and affected many industries.

Get detailed COVID-19 impact analysis on the Cardiovascular Ultrasound Market

Request Now !

Cardiovascular ultrasound is a noninvasive medical procedure used to diagnose functioning of heart with the help of high-frequency reflected sound. In the procedure, a transducer (such as a microphone) is used to direct out ultrasonic sound waves at a high inaudible frequency. When the transducer is positioned on the chest at specific locations and angles, the ultrasonic sound waves penetrate through the skin and other body tissues to the heart tissues, and get reflected by the heart structures. These sound waves are then subsequently directed to a computer, creating moving images of the heart walls and valves.

The major factors that drive the growth of the cardiovascular ultrasound market are technological advancements, advantages of echocardiography over invasive cardiac diagnostic procedures, and increase in incidence of cardiovascular diseases (CVDs). In addition, this technology is widely accepted among patients as it is noninvasive, hence shortens the stay at hospitals, which fuels the market growth. However, factors such as economic influence of approving new technologies and insufficient reimbursement scenario impede the growth of the market. Technological advancements leading in cardiac specific technologies such as tissue enhancements, lateral gain control, advanced dynamic flow, tissue Doppler, and stress echo provide lucrative opportunities for the manufacturers.

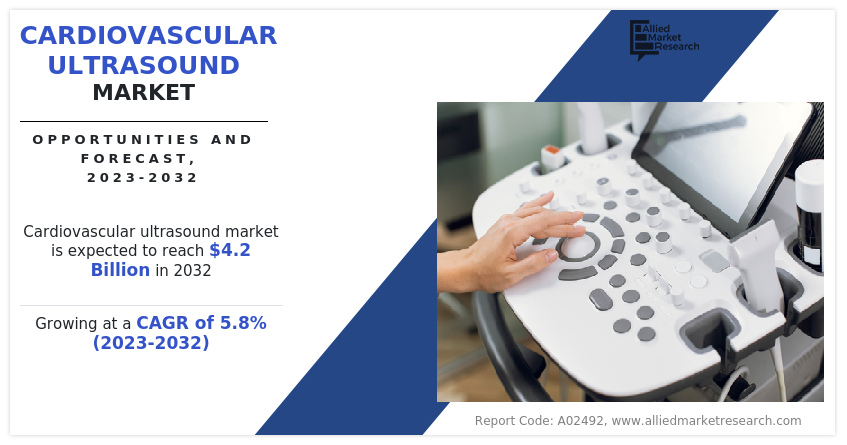
The global cardiovascular ultrasound market is segmented on the basis of test type, technology, device display, end user, and region. Based on test type, the market is categorized into stress echocardiogram, transthoracic echocardiogram, fetal & intracardiac echocardiogram, and transesophageal echocardiogram. By technology, it is divided into 2D, 3D & 4D, and Doppler imaging. In terms of display, it is bifurcated into color display and black & white (B/W) display. According to end user, it is classified into cardiology centers, hospitals, home care, ambulatory, and others (research institutes, medical device, and pharmaceutical companies). Geographically, it is analyzed across North America, Europe, Asia-Pacific, and LAMEA.

The key players operating in the market include General Electric Company, Koninklijke Philips N.V., TOSHIBA CORPORATION, Hitachi Ltd., SAMSUNG, FUJIFILM Holdings Corporation, Esaote SpA, Shenzhen Mindray Bio-Medical Electronics Co., Ltd., Siemens AG, and Analogic Corporation.

Key Benefits

  • The study provides an in-depth analysis of the cardiovascular ultrasound market with current trends and future estimations to elucidate the imminent investment pockets.
  • It presents a quantitative analysis to enable the stakeholders to capitalize on prevailing market opportunities.
  • Key players are profiled and their strategies are analyzed thoroughly, which predict the competitive outlook of the market.
  • Extensive analysis of the market by devices type assists to understand the availability of various forms of devices used in cardiovascular ultrasound market.

Cardiovascular Ultrasound Market Report Highlights

Aspects Details
By Test Type
  • Transthoracic Echocardiogram
  • Transesophageal Echocardiogram
  • Stress Echocardiogram
  • Other Echocardiograms (Fetal and Intracardiac Echocardiograms)
By Technology
  • 2D
  • 3D & 4D
  • Doppler Imaging
By Device Display
  • Color Display
  • Black & White (B/W) Display
By End User
  • Hospitals
  • Cardiology Centers
  • Ambulatory
  • Home Care
  • Ambulatory Centers
  • Others (Research Institutes, Medical Device, and Pharmaceutical Companies)
By Region
  • North America  (U.S., Canada, Mexico)
  • Europe  (France, Germany, Italy, Spain, UK, Rest of Europe)
  • Asia-Pacific  (China, Japan, India, South Korea, Australia, Rest of Asia-Pacific)
  • LAMEA  (Brazil, South Africa, Saudi Arabia, Rest of LAMEA)
Key Market Players Shenzhen Mindray Bio-Medical Electronics Co., Ltd., Toshiba Corporation, General Electric Company, Samsung, Esaote SpA, Hitachi Ltd., Fujifilm Holdings Corporation, Analogic Corporation, Koninklijke Philips N.V., Siemens AG
 
  • CHAPTER 1: INTRODUCTION

    • 1.1. Report Description

    • 1.2. Key Market Segments

    • 1.3. Key Benefits

    • 1.4. Research Methodology

      • 1.4.1. Primary Research

      • 1.4.2. Secondary Research

      • 1.4.3. Analyst Tools and Models

  • CHAPTER 2: EXECUTIVE SUMMARY

    • 2.1. CXO Perspective

  • CHAPTER 3: MARKET LANDSCAPE

    • 3.1. Market Definition and Scope

    • 3.2. Key Findings

      • 3.2.1. Top Investment Pockets

      • 3.2.2. Top Winning Strategies

    • 3.3. Porter's Five Forces Analysis

      • 3.3.1. Bargaining Power of Suppliers

      • 3.3.2. Threat of New Entrants

      • 3.3.3. Threat of Substitutes

      • 3.3.4. Competitive Rivalry

      • 3.3.5. Bargaining Power among Buyers

    • 3.5. Market Dynamics

      • 3.5.1. Drivers

      • 3.5.2. Restraints

      • 3.5.3. Opportunities

    • 3.6. COVID-19 Impact Analysis

  • CHAPTER 4: CARDIOVASCULAR ULTRASOUND MARKET, BY TEST TYPE

    • 4.1. Market Overview

      • 4.1.1 Market Size and Forecast, By Test Type

    • 4.2. Transthoracic Echocardiogram

      • 4.2.1. Key Market Trends, Growth Factors and Opportunities

      • 4.2.2. Market Size and Forecast, By Region

      • 4.2.3. Market Share Analysis, By Country

    • 4.3. Transesophageal Echocardiogram

      • 4.3.1. Key Market Trends, Growth Factors and Opportunities

      • 4.3.2. Market Size and Forecast, By Region

      • 4.3.3. Market Share Analysis, By Country

    • 4.4. Stress Echocardiogram

      • 4.4.1. Key Market Trends, Growth Factors and Opportunities

      • 4.4.2. Market Size and Forecast, By Region

      • 4.4.3. Market Share Analysis, By Country

    • 4.5. Other Echocardiograms (Fetal And Intracardiac Echocardiograms)

      • 4.5.1. Key Market Trends, Growth Factors and Opportunities

      • 4.5.2. Market Size and Forecast, By Region

      • 4.5.3. Market Share Analysis, By Country

  • CHAPTER 5: CARDIOVASCULAR ULTRASOUND MARKET, BY TECHNOLOGY

    • 5.1. Market Overview

      • 5.1.1 Market Size and Forecast, By Technology

    • 5.2. 2D

      • 5.2.1. Key Market Trends, Growth Factors and Opportunities

      • 5.2.2. Market Size and Forecast, By Region

      • 5.2.3. Market Share Analysis, By Country

    • 5.3. 3D 4D

      • 5.3.1. Key Market Trends, Growth Factors and Opportunities

      • 5.3.2. Market Size and Forecast, By Region

      • 5.3.3. Market Share Analysis, By Country

    • 5.4. Doppler Imaging

      • 5.4.1. Key Market Trends, Growth Factors and Opportunities

      • 5.4.2. Market Size and Forecast, By Region

      • 5.4.3. Market Share Analysis, By Country

  • CHAPTER 6: CARDIOVASCULAR ULTRASOUND MARKET, BY DEVICE DISPLAY

    • 6.1. Market Overview

      • 6.1.1 Market Size and Forecast, By Device Display

    • 6.2. Color Display

      • 6.2.1. Key Market Trends, Growth Factors and Opportunities

      • 6.2.2. Market Size and Forecast, By Region

      • 6.2.3. Market Share Analysis, By Country

    • 6.3. Black White (B/W) Display

      • 6.3.1. Key Market Trends, Growth Factors and Opportunities

      • 6.3.2. Market Size and Forecast, By Region

      • 6.3.3. Market Share Analysis, By Country

  • CHAPTER 7: CARDIOVASCULAR ULTRASOUND MARKET, BY END USER

    • 7.1. Market Overview

      • 7.1.1 Market Size and Forecast, By End User

    • 7.2. Hospitals

      • 7.2.1. Key Market Trends, Growth Factors and Opportunities

      • 7.2.2. Market Size and Forecast, By Region

      • 7.2.3. Market Share Analysis, By Country

    • 7.3. Cardiology Centers

      • 7.3.1. Key Market Trends, Growth Factors and Opportunities

      • 7.3.2. Market Size and Forecast, By Region

      • 7.3.3. Market Share Analysis, By Country

    • 7.4. Ambulatory

      • 7.4.1. Key Market Trends, Growth Factors and Opportunities

      • 7.4.2. Market Size and Forecast, By Region

      • 7.4.3. Market Share Analysis, By Country

    • 7.5. Home Care

      • 7.5.1. Key Market Trends, Growth Factors and Opportunities

      • 7.5.2. Market Size and Forecast, By Region

      • 7.5.3. Market Share Analysis, By Country

    • 7.6. Ambulatory Centers

      • 7.6.1. Key Market Trends, Growth Factors and Opportunities

      • 7.6.2. Market Size and Forecast, By Region

      • 7.6.3. Market Share Analysis, By Country

    • 7.7. Others (Research Institutes, Medical Device, And Pharmaceutical Companies)

      • 7.7.1. Key Market Trends, Growth Factors and Opportunities

      • 7.7.2. Market Size and Forecast, By Region

      • 7.7.3. Market Share Analysis, By Country

  • CHAPTER 8: CARDIOVASCULAR ULTRASOUND MARKET, BY REGION

    • 8.1. Market Overview

      • 8.1.1 Market Size and Forecast, By Region

    • 8.2. North America

      • 8.2.1. Key Market Trends and Opportunities

      • 8.2.2. Market Size and Forecast, By Test Type

      • 8.2.3. Market Size and Forecast, By Technology

      • 8.2.4. Market Size and Forecast, By Device Display

      • 8.2.5. Market Size and Forecast, By End User

      • 8.2.6. Market Size and Forecast, By Country

      • 8.2.7. U.S. Cardiovascular Ultrasound Market

        • 8.2.7.1. Market Size and Forecast, By Test Type
        • 8.2.7.2. Market Size and Forecast, By Technology
        • 8.2.7.3. Market Size and Forecast, By Device Display
        • 8.2.7.4. Market Size and Forecast, By End User
      • 8.2.8. Canada Cardiovascular Ultrasound Market

        • 8.2.8.1. Market Size and Forecast, By Test Type
        • 8.2.8.2. Market Size and Forecast, By Technology
        • 8.2.8.3. Market Size and Forecast, By Device Display
        • 8.2.8.4. Market Size and Forecast, By End User
      • 8.2.9. Mexico Cardiovascular Ultrasound Market

        • 8.2.9.1. Market Size and Forecast, By Test Type
        • 8.2.9.2. Market Size and Forecast, By Technology
        • 8.2.9.3. Market Size and Forecast, By Device Display
        • 8.2.9.4. Market Size and Forecast, By End User
    • 8.3. Europe

      • 8.3.1. Key Market Trends and Opportunities

      • 8.3.2. Market Size and Forecast, By Test Type

      • 8.3.3. Market Size and Forecast, By Technology

      • 8.3.4. Market Size and Forecast, By Device Display

      • 8.3.5. Market Size and Forecast, By End User

      • 8.3.6. Market Size and Forecast, By Country

      • 8.3.7. France Cardiovascular Ultrasound Market

        • 8.3.7.1. Market Size and Forecast, By Test Type
        • 8.3.7.2. Market Size and Forecast, By Technology
        • 8.3.7.3. Market Size and Forecast, By Device Display
        • 8.3.7.4. Market Size and Forecast, By End User
      • 8.3.8. Germany Cardiovascular Ultrasound Market

        • 8.3.8.1. Market Size and Forecast, By Test Type
        • 8.3.8.2. Market Size and Forecast, By Technology
        • 8.3.8.3. Market Size and Forecast, By Device Display
        • 8.3.8.4. Market Size and Forecast, By End User
      • 8.3.9. Italy Cardiovascular Ultrasound Market

        • 8.3.9.1. Market Size and Forecast, By Test Type
        • 8.3.9.2. Market Size and Forecast, By Technology
        • 8.3.9.3. Market Size and Forecast, By Device Display
        • 8.3.9.4. Market Size and Forecast, By End User
      • 8.3.10. Spain Cardiovascular Ultrasound Market

        • 8.3.10.1. Market Size and Forecast, By Test Type
        • 8.3.10.2. Market Size and Forecast, By Technology
        • 8.3.10.3. Market Size and Forecast, By Device Display
        • 8.3.10.4. Market Size and Forecast, By End User
      • 8.3.11. UK Cardiovascular Ultrasound Market

        • 8.3.11.1. Market Size and Forecast, By Test Type
        • 8.3.11.2. Market Size and Forecast, By Technology
        • 8.3.11.3. Market Size and Forecast, By Device Display
        • 8.3.11.4. Market Size and Forecast, By End User
      • 8.3.12. Russia Cardiovascular Ultrasound Market

        • 8.3.12.1. Market Size and Forecast, By Test Type
        • 8.3.12.2. Market Size and Forecast, By Technology
        • 8.3.12.3. Market Size and Forecast, By Device Display
        • 8.3.12.4. Market Size and Forecast, By End User
      • 8.3.13. Rest Of Europe Cardiovascular Ultrasound Market

        • 8.3.13.1. Market Size and Forecast, By Test Type
        • 8.3.13.2. Market Size and Forecast, By Technology
        • 8.3.13.3. Market Size and Forecast, By Device Display
        • 8.3.13.4. Market Size and Forecast, By End User
    • 8.4. Asia-Pacific

      • 8.4.1. Key Market Trends and Opportunities

      • 8.4.2. Market Size and Forecast, By Test Type

      • 8.4.3. Market Size and Forecast, By Technology

      • 8.4.4. Market Size and Forecast, By Device Display

      • 8.4.5. Market Size and Forecast, By End User

      • 8.4.6. Market Size and Forecast, By Country

      • 8.4.7. China Cardiovascular Ultrasound Market

        • 8.4.7.1. Market Size and Forecast, By Test Type
        • 8.4.7.2. Market Size and Forecast, By Technology
        • 8.4.7.3. Market Size and Forecast, By Device Display
        • 8.4.7.4. Market Size and Forecast, By End User
      • 8.4.8. Japan Cardiovascular Ultrasound Market

        • 8.4.8.1. Market Size and Forecast, By Test Type
        • 8.4.8.2. Market Size and Forecast, By Technology
        • 8.4.8.3. Market Size and Forecast, By Device Display
        • 8.4.8.4. Market Size and Forecast, By End User
      • 8.4.9. India Cardiovascular Ultrasound Market

        • 8.4.9.1. Market Size and Forecast, By Test Type
        • 8.4.9.2. Market Size and Forecast, By Technology
        • 8.4.9.3. Market Size and Forecast, By Device Display
        • 8.4.9.4. Market Size and Forecast, By End User
      • 8.4.10. South Korea Cardiovascular Ultrasound Market

        • 8.4.10.1. Market Size and Forecast, By Test Type
        • 8.4.10.2. Market Size and Forecast, By Technology
        • 8.4.10.3. Market Size and Forecast, By Device Display
        • 8.4.10.4. Market Size and Forecast, By End User
      • 8.4.11. Australia Cardiovascular Ultrasound Market

        • 8.4.11.1. Market Size and Forecast, By Test Type
        • 8.4.11.2. Market Size and Forecast, By Technology
        • 8.4.11.3. Market Size and Forecast, By Device Display
        • 8.4.11.4. Market Size and Forecast, By End User
      • 8.4.12. Thailand Cardiovascular Ultrasound Market

        • 8.4.12.1. Market Size and Forecast, By Test Type
        • 8.4.12.2. Market Size and Forecast, By Technology
        • 8.4.12.3. Market Size and Forecast, By Device Display
        • 8.4.12.4. Market Size and Forecast, By End User
      • 8.4.13. Malaysia Cardiovascular Ultrasound Market

        • 8.4.13.1. Market Size and Forecast, By Test Type
        • 8.4.13.2. Market Size and Forecast, By Technology
        • 8.4.13.3. Market Size and Forecast, By Device Display
        • 8.4.13.4. Market Size and Forecast, By End User
      • 8.4.14. Indonesia Cardiovascular Ultrasound Market

        • 8.4.14.1. Market Size and Forecast, By Test Type
        • 8.4.14.2. Market Size and Forecast, By Technology
        • 8.4.14.3. Market Size and Forecast, By Device Display
        • 8.4.14.4. Market Size and Forecast, By End User
      • 8.4.15. Rest of Asia Pacific Cardiovascular Ultrasound Market

        • 8.4.15.1. Market Size and Forecast, By Test Type
        • 8.4.15.2. Market Size and Forecast, By Technology
        • 8.4.15.3. Market Size and Forecast, By Device Display
        • 8.4.15.4. Market Size and Forecast, By End User
    • 8.5. LAMEA

      • 8.5.1. Key Market Trends and Opportunities

      • 8.5.2. Market Size and Forecast, By Test Type

      • 8.5.3. Market Size and Forecast, By Technology

      • 8.5.4. Market Size and Forecast, By Device Display

      • 8.5.5. Market Size and Forecast, By End User

      • 8.5.6. Market Size and Forecast, By Country

      • 8.5.7. Brazil Cardiovascular Ultrasound Market

        • 8.5.7.1. Market Size and Forecast, By Test Type
        • 8.5.7.2. Market Size and Forecast, By Technology
        • 8.5.7.3. Market Size and Forecast, By Device Display
        • 8.5.7.4. Market Size and Forecast, By End User
      • 8.5.8. South Africa Cardiovascular Ultrasound Market

        • 8.5.8.1. Market Size and Forecast, By Test Type
        • 8.5.8.2. Market Size and Forecast, By Technology
        • 8.5.8.3. Market Size and Forecast, By Device Display
        • 8.5.8.4. Market Size and Forecast, By End User
      • 8.5.9. Saudi Arabia Cardiovascular Ultrasound Market

        • 8.5.9.1. Market Size and Forecast, By Test Type
        • 8.5.9.2. Market Size and Forecast, By Technology
        • 8.5.9.3. Market Size and Forecast, By Device Display
        • 8.5.9.4. Market Size and Forecast, By End User
      • 8.5.10. UAE Cardiovascular Ultrasound Market

        • 8.5.10.1. Market Size and Forecast, By Test Type
        • 8.5.10.2. Market Size and Forecast, By Technology
        • 8.5.10.3. Market Size and Forecast, By Device Display
        • 8.5.10.4. Market Size and Forecast, By End User
      • 8.5.11. Argentina Cardiovascular Ultrasound Market

        • 8.5.11.1. Market Size and Forecast, By Test Type
        • 8.5.11.2. Market Size and Forecast, By Technology
        • 8.5.11.3. Market Size and Forecast, By Device Display
        • 8.5.11.4. Market Size and Forecast, By End User
      • 8.5.12. Rest of LAMEA Cardiovascular Ultrasound Market

        • 8.5.12.1. Market Size and Forecast, By Test Type
        • 8.5.12.2. Market Size and Forecast, By Technology
        • 8.5.12.3. Market Size and Forecast, By Device Display
        • 8.5.12.4. Market Size and Forecast, By End User
  • CHAPTER 9: COMPETITIVE LANDSCAPE

    • 9.1. Introduction

    • 9.2. Top Winning Strategies

    • 9.3. Product Mapping Of Top 10 Player

    • 9.4. Competitive Dashboard

    • 9.5. Competitive Heatmap

    • 9.6. Top Player Positioning,2022

  • CHAPTER 10: COMPANY PROFILES

    • 10.1. General Electric Company

      • 10.1.1. Company Overview

      • 10.1.2. Key Executives

      • 10.1.3. Company Snapshot

      • 10.1.4. Operating Business Segments

      • 10.1.5. Product Portfolio

      • 10.1.6. Business Performance

      • 10.1.7. Key Strategic Moves and Developments

    • 10.2. Koninklijke Philips N.V.

      • 10.2.1. Company Overview

      • 10.2.2. Key Executives

      • 10.2.3. Company Snapshot

      • 10.2.4. Operating Business Segments

      • 10.2.5. Product Portfolio

      • 10.2.6. Business Performance

      • 10.2.7. Key Strategic Moves and Developments

    • 10.3. Toshiba Corporation

      • 10.3.1. Company Overview

      • 10.3.2. Key Executives

      • 10.3.3. Company Snapshot

      • 10.3.4. Operating Business Segments

      • 10.3.5. Product Portfolio

      • 10.3.6. Business Performance

      • 10.3.7. Key Strategic Moves and Developments

    • 10.4. Hitachi Ltd.

      • 10.4.1. Company Overview

      • 10.4.2. Key Executives

      • 10.4.3. Company Snapshot

      • 10.4.4. Operating Business Segments

      • 10.4.5. Product Portfolio

      • 10.4.6. Business Performance

      • 10.4.7. Key Strategic Moves and Developments

    • 10.5. Samsung

      • 10.5.1. Company Overview

      • 10.5.2. Key Executives

      • 10.5.3. Company Snapshot

      • 10.5.4. Operating Business Segments

      • 10.5.5. Product Portfolio

      • 10.5.6. Business Performance

      • 10.5.7. Key Strategic Moves and Developments

    • 10.6. Fujifilm Holdings Corporation

      • 10.6.1. Company Overview

      • 10.6.2. Key Executives

      • 10.6.3. Company Snapshot

      • 10.6.4. Operating Business Segments

      • 10.6.5. Product Portfolio

      • 10.6.6. Business Performance

      • 10.6.7. Key Strategic Moves and Developments

    • 10.7. Esaote SpA

      • 10.7.1. Company Overview

      • 10.7.2. Key Executives

      • 10.7.3. Company Snapshot

      • 10.7.4. Operating Business Segments

      • 10.7.5. Product Portfolio

      • 10.7.6. Business Performance

      • 10.7.7. Key Strategic Moves and Developments

    • 10.8. Shenzhen Mindray Bio-Medical Electronics Co., Ltd.

      • 10.8.1. Company Overview

      • 10.8.2. Key Executives

      • 10.8.3. Company Snapshot

      • 10.8.4. Operating Business Segments

      • 10.8.5. Product Portfolio

      • 10.8.6. Business Performance

      • 10.8.7. Key Strategic Moves and Developments

    • 10.9. Siemens AG

      • 10.9.1. Company Overview

      • 10.9.2. Key Executives

      • 10.9.3. Company Snapshot

      • 10.9.4. Operating Business Segments

      • 10.9.5. Product Portfolio

      • 10.9.6. Business Performance

      • 10.9.7. Key Strategic Moves and Developments

    • 10.10. Analogic Corporation

      • 10.10.1. Company Overview

      • 10.10.2. Key Executives

      • 10.10.3. Company Snapshot

      • 10.10.4. Operating Business Segments

      • 10.10.5. Product Portfolio

      • 10.10.6. Business Performance

      • 10.10.7. Key Strategic Moves and Developments

  • LIST OF TABLES

  • TABLE 1. GLOBAL CARDIOVASCULAR ULTRASOUND MARKET, BY TEST TYPE, 2022-2032 ($MILLION)
  • TABLE 2. GLOBAL CARDIOVASCULAR ULTRASOUND MARKET FOR TRANSTHORACIC ECHOCARDIOGRAM, BY REGION, 2022-2032 ($MILLION)
  • TABLE 3. GLOBAL CARDIOVASCULAR ULTRASOUND MARKET FOR TRANSESOPHAGEAL ECHOCARDIOGRAM, BY REGION, 2022-2032 ($MILLION)
  • TABLE 4. GLOBAL CARDIOVASCULAR ULTRASOUND MARKET FOR STRESS ECHOCARDIOGRAM, BY REGION, 2022-2032 ($MILLION)
  • TABLE 5. GLOBAL CARDIOVASCULAR ULTRASOUND MARKET FOR OTHER ECHOCARDIOGRAMS (FETAL AND INTRACARDIAC ECHOCARDIOGRAMS), BY REGION, 2022-2032 ($MILLION)
  • TABLE 6. GLOBAL CARDIOVASCULAR ULTRASOUND MARKET, BY TECHNOLOGY, 2022-2032 ($MILLION)
  • TABLE 7. GLOBAL CARDIOVASCULAR ULTRASOUND MARKET FOR 2D, BY REGION, 2022-2032 ($MILLION)
  • TABLE 8. GLOBAL CARDIOVASCULAR ULTRASOUND MARKET FOR 3D 4D, BY REGION, 2022-2032 ($MILLION)
  • TABLE 9. GLOBAL CARDIOVASCULAR ULTRASOUND MARKET FOR DOPPLER IMAGING, BY REGION, 2022-2032 ($MILLION)
  • TABLE 10. GLOBAL CARDIOVASCULAR ULTRASOUND MARKET, BY DEVICE DISPLAY, 2022-2032 ($MILLION)
  • TABLE 11. GLOBAL CARDIOVASCULAR ULTRASOUND MARKET FOR COLOR DISPLAY, BY REGION, 2022-2032 ($MILLION)
  • TABLE 12. GLOBAL CARDIOVASCULAR ULTRASOUND MARKET FOR BLACK WHITE (B/W) DISPLAY, BY REGION, 2022-2032 ($MILLION)
  • TABLE 13. GLOBAL CARDIOVASCULAR ULTRASOUND MARKET, BY END USER, 2022-2032 ($MILLION)
  • TABLE 14. GLOBAL CARDIOVASCULAR ULTRASOUND MARKET FOR HOSPITALS, BY REGION, 2022-2032 ($MILLION)
  • TABLE 15. GLOBAL CARDIOVASCULAR ULTRASOUND MARKET FOR CARDIOLOGY CENTERS, BY REGION, 2022-2032 ($MILLION)
  • TABLE 16. GLOBAL CARDIOVASCULAR ULTRASOUND MARKET FOR AMBULATORY, BY REGION, 2022-2032 ($MILLION)
  • TABLE 17. GLOBAL CARDIOVASCULAR ULTRASOUND MARKET FOR HOME CARE, BY REGION, 2022-2032 ($MILLION)
  • TABLE 18. GLOBAL CARDIOVASCULAR ULTRASOUND MARKET FOR AMBULATORY CENTERS, BY REGION, 2022-2032 ($MILLION)
  • TABLE 19. GLOBAL CARDIOVASCULAR ULTRASOUND MARKET FOR OTHERS (RESEARCH INSTITUTES, MEDICAL DEVICE, AND PHARMACEUTICAL COMPANIES), BY REGION, 2022-2032 ($MILLION)
  • TABLE 20. GLOBAL CARDIOVASCULAR ULTRASOUND MARKET, BY REGION, 2022-2032 ($MILLION)
  • TABLE 21. NORTH AMERICA CARDIOVASCULAR ULTRASOUND, BY REGION, 2022-2032 ($MILLION)
  • TABLE 22. NORTH AMERICA CARDIOVASCULAR ULTRASOUND, BY TEST TYPE, 2022-2032 ($MILLION)
  • TABLE 23. NORTH AMERICA CARDIOVASCULAR ULTRASOUND, BY TECHNOLOGY, 2022-2032 ($MILLION)
  • TABLE 24. NORTH AMERICA CARDIOVASCULAR ULTRASOUND, BY DEVICE DISPLAY, 2022-2032 ($MILLION)
  • TABLE 25. NORTH AMERICA CARDIOVASCULAR ULTRASOUND, BY END USER, 2022-2032 ($MILLION)
  • TABLE 26. U.S. CARDIOVASCULAR ULTRASOUND, BY TEST TYPE, 2022-2032 ($MILLION)
  • TABLE 27. U.S. CARDIOVASCULAR ULTRASOUND, BY TECHNOLOGY, 2022-2032 ($MILLION)
  • TABLE 28. U.S. CARDIOVASCULAR ULTRASOUND, BY DEVICE DISPLAY, 2022-2032 ($MILLION)
  • TABLE 29. U.S. CARDIOVASCULAR ULTRASOUND, BY END USER, 2022-2032 ($MILLION)
  • TABLE 30. CANADA CARDIOVASCULAR ULTRASOUND, BY TEST TYPE, 2022-2032 ($MILLION)
  • TABLE 31. CANADA CARDIOVASCULAR ULTRASOUND, BY TECHNOLOGY, 2022-2032 ($MILLION)
  • TABLE 32. CANADA CARDIOVASCULAR ULTRASOUND, BY DEVICE DISPLAY, 2022-2032 ($MILLION)
  • TABLE 33. CANADA CARDIOVASCULAR ULTRASOUND, BY END USER, 2022-2032 ($MILLION)
  • TABLE 34. MEXICO CARDIOVASCULAR ULTRASOUND, BY TEST TYPE, 2022-2032 ($MILLION)
  • TABLE 35. MEXICO CARDIOVASCULAR ULTRASOUND, BY TECHNOLOGY, 2022-2032 ($MILLION)
  • TABLE 36. MEXICO CARDIOVASCULAR ULTRASOUND, BY DEVICE DISPLAY, 2022-2032 ($MILLION)
  • TABLE 37. MEXICO CARDIOVASCULAR ULTRASOUND, BY END USER, 2022-2032 ($MILLION)
  • TABLE 38. EUROPE CARDIOVASCULAR ULTRASOUND, BY REGION, 2022-2032 ($MILLION)
  • TABLE 39. EUROPE CARDIOVASCULAR ULTRASOUND, BY TEST TYPE, 2022-2032 ($MILLION)
  • TABLE 40. EUROPE CARDIOVASCULAR ULTRASOUND, BY TECHNOLOGY, 2022-2032 ($MILLION)
  • TABLE 41. EUROPE CARDIOVASCULAR ULTRASOUND, BY DEVICE DISPLAY, 2022-2032 ($MILLION)
  • TABLE 42. EUROPE CARDIOVASCULAR ULTRASOUND, BY END USER, 2022-2032 ($MILLION)
  • TABLE 43. FRANCE CARDIOVASCULAR ULTRASOUND, BY TEST TYPE, 2022-2032 ($MILLION)
  • TABLE 44. FRANCE CARDIOVASCULAR ULTRASOUND, BY TECHNOLOGY, 2022-2032 ($MILLION)
  • TABLE 45. FRANCE CARDIOVASCULAR ULTRASOUND, BY DEVICE DISPLAY, 2022-2032 ($MILLION)
  • TABLE 46. FRANCE CARDIOVASCULAR ULTRASOUND, BY END USER, 2022-2032 ($MILLION)
  • TABLE 47. GERMANY CARDIOVASCULAR ULTRASOUND, BY TEST TYPE, 2022-2032 ($MILLION)
  • TABLE 48. GERMANY CARDIOVASCULAR ULTRASOUND, BY TECHNOLOGY, 2022-2032 ($MILLION)
  • TABLE 49. GERMANY CARDIOVASCULAR ULTRASOUND, BY DEVICE DISPLAY, 2022-2032 ($MILLION)
  • TABLE 50. GERMANY CARDIOVASCULAR ULTRASOUND, BY END USER, 2022-2032 ($MILLION)
  • TABLE 51. ITALY CARDIOVASCULAR ULTRASOUND, BY TEST TYPE, 2022-2032 ($MILLION)
  • TABLE 52. ITALY CARDIOVASCULAR ULTRASOUND, BY TECHNOLOGY, 2022-2032 ($MILLION)
  • TABLE 53. ITALY CARDIOVASCULAR ULTRASOUND, BY DEVICE DISPLAY, 2022-2032 ($MILLION)
  • TABLE 54. ITALY CARDIOVASCULAR ULTRASOUND, BY END USER, 2022-2032 ($MILLION)
  • TABLE 55. SPAIN CARDIOVASCULAR ULTRASOUND, BY TEST TYPE, 2022-2032 ($MILLION)
  • TABLE 56. SPAIN CARDIOVASCULAR ULTRASOUND, BY TECHNOLOGY, 2022-2032 ($MILLION)
  • TABLE 57. SPAIN CARDIOVASCULAR ULTRASOUND, BY DEVICE DISPLAY, 2022-2032 ($MILLION)
  • TABLE 58. SPAIN CARDIOVASCULAR ULTRASOUND, BY END USER, 2022-2032 ($MILLION)
  • TABLE 59. UK CARDIOVASCULAR ULTRASOUND, BY TEST TYPE, 2022-2032 ($MILLION)
  • TABLE 60. UK CARDIOVASCULAR ULTRASOUND, BY TECHNOLOGY, 2022-2032 ($MILLION)
  • TABLE 61. UK CARDIOVASCULAR ULTRASOUND, BY DEVICE DISPLAY, 2022-2032 ($MILLION)
  • TABLE 62. UK CARDIOVASCULAR ULTRASOUND, BY END USER, 2022-2032 ($MILLION)
  • TABLE 63. RUSSIA CARDIOVASCULAR ULTRASOUND, BY TEST TYPE, 2022-2032 ($MILLION)
  • TABLE 64. RUSSIA CARDIOVASCULAR ULTRASOUND, BY TECHNOLOGY, 2022-2032 ($MILLION)
  • TABLE 65. RUSSIA CARDIOVASCULAR ULTRASOUND, BY DEVICE DISPLAY, 2022-2032 ($MILLION)
  • TABLE 66. RUSSIA CARDIOVASCULAR ULTRASOUND, BY END USER, 2022-2032 ($MILLION)
  • TABLE 67. REST OF EUROPE CARDIOVASCULAR ULTRASOUND, BY TEST TYPE, 2022-2032 ($MILLION)
  • TABLE 68. REST OF EUROPE CARDIOVASCULAR ULTRASOUND, BY TECHNOLOGY, 2022-2032 ($MILLION)
  • TABLE 69. REST OF EUROPE CARDIOVASCULAR ULTRASOUND, BY DEVICE DISPLAY, 2022-2032 ($MILLION)
  • TABLE 70. REST OF EUROPE CARDIOVASCULAR ULTRASOUND, BY END USER, 2022-2032 ($MILLION)
  • TABLE 71. ASIA-PACIFIC CARDIOVASCULAR ULTRASOUND, BY REGION, 2022-2032 ($MILLION)
  • TABLE 72. ASIA-PACIFIC CARDIOVASCULAR ULTRASOUND, BY TEST TYPE, 2022-2032 ($MILLION)
  • TABLE 73. ASIA-PACIFIC CARDIOVASCULAR ULTRASOUND, BY TECHNOLOGY, 2022-2032 ($MILLION)
  • TABLE 74. ASIA-PACIFIC CARDIOVASCULAR ULTRASOUND, BY DEVICE DISPLAY, 2022-2032 ($MILLION)
  • TABLE 75. ASIA-PACIFIC CARDIOVASCULAR ULTRASOUND, BY END USER, 2022-2032 ($MILLION)
  • TABLE 76. CHINA CARDIOVASCULAR ULTRASOUND, BY TEST TYPE, 2022-2032 ($MILLION)
  • TABLE 77. CHINA CARDIOVASCULAR ULTRASOUND, BY TECHNOLOGY, 2022-2032 ($MILLION)
  • TABLE 78. CHINA CARDIOVASCULAR ULTRASOUND, BY DEVICE DISPLAY, 2022-2032 ($MILLION)
  • TABLE 79. CHINA CARDIOVASCULAR ULTRASOUND, BY END USER, 2022-2032 ($MILLION)
  • TABLE 80. JAPAN CARDIOVASCULAR ULTRASOUND, BY TEST TYPE, 2022-2032 ($MILLION)
  • TABLE 81. JAPAN CARDIOVASCULAR ULTRASOUND, BY TECHNOLOGY, 2022-2032 ($MILLION)
  • TABLE 82. JAPAN CARDIOVASCULAR ULTRASOUND, BY DEVICE DISPLAY, 2022-2032 ($MILLION)
  • TABLE 83. JAPAN CARDIOVASCULAR ULTRASOUND, BY END USER, 2022-2032 ($MILLION)
  • TABLE 84. INDIA CARDIOVASCULAR ULTRASOUND, BY TEST TYPE, 2022-2032 ($MILLION)
  • TABLE 85. INDIA CARDIOVASCULAR ULTRASOUND, BY TECHNOLOGY, 2022-2032 ($MILLION)
  • TABLE 86. INDIA CARDIOVASCULAR ULTRASOUND, BY DEVICE DISPLAY, 2022-2032 ($MILLION)
  • TABLE 87. INDIA CARDIOVASCULAR ULTRASOUND, BY END USER, 2022-2032 ($MILLION)
  • TABLE 88. SOUTH KOREA CARDIOVASCULAR ULTRASOUND, BY TEST TYPE, 2022-2032 ($MILLION)
  • TABLE 89. SOUTH KOREA CARDIOVASCULAR ULTRASOUND, BY TECHNOLOGY, 2022-2032 ($MILLION)
  • TABLE 90. SOUTH KOREA CARDIOVASCULAR ULTRASOUND, BY DEVICE DISPLAY, 2022-2032 ($MILLION)
  • TABLE 91. SOUTH KOREA CARDIOVASCULAR ULTRASOUND, BY END USER, 2022-2032 ($MILLION)
  • TABLE 92. AUSTRALIA CARDIOVASCULAR ULTRASOUND, BY TEST TYPE, 2022-2032 ($MILLION)
  • TABLE 93. AUSTRALIA CARDIOVASCULAR ULTRASOUND, BY TECHNOLOGY, 2022-2032 ($MILLION)
  • TABLE 94. AUSTRALIA CARDIOVASCULAR ULTRASOUND, BY DEVICE DISPLAY, 2022-2032 ($MILLION)
  • TABLE 95. AUSTRALIA CARDIOVASCULAR ULTRASOUND, BY END USER, 2022-2032 ($MILLION)
  • TABLE 96. THAILAND CARDIOVASCULAR ULTRASOUND, BY TEST TYPE, 2022-2032 ($MILLION)
  • TABLE 97. THAILAND CARDIOVASCULAR ULTRASOUND, BY TECHNOLOGY, 2022-2032 ($MILLION)
  • TABLE 98. THAILAND CARDIOVASCULAR ULTRASOUND, BY DEVICE DISPLAY, 2022-2032 ($MILLION)
  • TABLE 99. THAILAND CARDIOVASCULAR ULTRASOUND, BY END USER, 2022-2032 ($MILLION)
  • TABLE 100. MALAYSIA CARDIOVASCULAR ULTRASOUND, BY TEST TYPE, 2022-2032 ($MILLION)
  • TABLE 101. MALAYSIA CARDIOVASCULAR ULTRASOUND, BY TECHNOLOGY, 2022-2032 ($MILLION)
  • TABLE 102. MALAYSIA CARDIOVASCULAR ULTRASOUND, BY DEVICE DISPLAY, 2022-2032 ($MILLION)
  • TABLE 103. MALAYSIA CARDIOVASCULAR ULTRASOUND, BY END USER, 2022-2032 ($MILLION)
  • TABLE 104. INDONESIA CARDIOVASCULAR ULTRASOUND, BY TEST TYPE, 2022-2032 ($MILLION)
  • TABLE 105. INDONESIA CARDIOVASCULAR ULTRASOUND, BY TECHNOLOGY, 2022-2032 ($MILLION)
  • TABLE 106. INDONESIA CARDIOVASCULAR ULTRASOUND, BY DEVICE DISPLAY, 2022-2032 ($MILLION)
  • TABLE 107. INDONESIA CARDIOVASCULAR ULTRASOUND, BY END USER, 2022-2032 ($MILLION)
  • TABLE 108. REST OF ASIA PACIFIC CARDIOVASCULAR ULTRASOUND, BY TEST TYPE, 2022-2032 ($MILLION)
  • TABLE 109. REST OF ASIA PACIFIC CARDIOVASCULAR ULTRASOUND, BY TECHNOLOGY, 2022-2032 ($MILLION)
  • TABLE 110. REST OF ASIA PACIFIC CARDIOVASCULAR ULTRASOUND, BY DEVICE DISPLAY, 2022-2032 ($MILLION)
  • TABLE 111. REST OF ASIA PACIFIC CARDIOVASCULAR ULTRASOUND, BY END USER, 2022-2032 ($MILLION)
  • TABLE 112. LAMEA CARDIOVASCULAR ULTRASOUND, BY REGION, 2022-2032 ($MILLION)
  • TABLE 113. LAMEA CARDIOVASCULAR ULTRASOUND, BY TEST TYPE, 2022-2032 ($MILLION)
  • TABLE 114. LAMEA CARDIOVASCULAR ULTRASOUND, BY TECHNOLOGY, 2022-2032 ($MILLION)
  • TABLE 115. LAMEA CARDIOVASCULAR ULTRASOUND, BY DEVICE DISPLAY, 2022-2032 ($MILLION)
  • TABLE 116. LAMEA CARDIOVASCULAR ULTRASOUND, BY END USER, 2022-2032 ($MILLION)
  • TABLE 117. BRAZIL CARDIOVASCULAR ULTRASOUND, BY TEST TYPE, 2022-2032 ($MILLION)
  • TABLE 118. BRAZIL CARDIOVASCULAR ULTRASOUND, BY TECHNOLOGY, 2022-2032 ($MILLION)
  • TABLE 119. BRAZIL CARDIOVASCULAR ULTRASOUND, BY DEVICE DISPLAY, 2022-2032 ($MILLION)
  • TABLE 120. BRAZIL CARDIOVASCULAR ULTRASOUND, BY END USER, 2022-2032 ($MILLION)
  • TABLE 121. SOUTH AFRICA CARDIOVASCULAR ULTRASOUND, BY TEST TYPE, 2022-2032 ($MILLION)
  • TABLE 122. SOUTH AFRICA CARDIOVASCULAR ULTRASOUND, BY TECHNOLOGY, 2022-2032 ($MILLION)
  • TABLE 123. SOUTH AFRICA CARDIOVASCULAR ULTRASOUND, BY DEVICE DISPLAY, 2022-2032 ($MILLION)
  • TABLE 124. SOUTH AFRICA CARDIOVASCULAR ULTRASOUND, BY END USER, 2022-2032 ($MILLION)
  • TABLE 125. SAUDI ARABIA CARDIOVASCULAR ULTRASOUND, BY TEST TYPE, 2022-2032 ($MILLION)
  • TABLE 126. SAUDI ARABIA CARDIOVASCULAR ULTRASOUND, BY TECHNOLOGY, 2022-2032 ($MILLION)
  • TABLE 127. SAUDI ARABIA CARDIOVASCULAR ULTRASOUND, BY DEVICE DISPLAY, 2022-2032 ($MILLION)
  • TABLE 128. SAUDI ARABIA CARDIOVASCULAR ULTRASOUND, BY END USER, 2022-2032 ($MILLION)
  • TABLE 129. UAE CARDIOVASCULAR ULTRASOUND, BY TEST TYPE, 2022-2032 ($MILLION)
  • TABLE 130. UAE CARDIOVASCULAR ULTRASOUND, BY TECHNOLOGY, 2022-2032 ($MILLION)
  • TABLE 131. UAE CARDIOVASCULAR ULTRASOUND, BY DEVICE DISPLAY, 2022-2032 ($MILLION)
  • TABLE 132. UAE CARDIOVASCULAR ULTRASOUND, BY END USER, 2022-2032 ($MILLION)
  • TABLE 133. ARGENTINA CARDIOVASCULAR ULTRASOUND, BY TEST TYPE, 2022-2032 ($MILLION)
  • TABLE 134. ARGENTINA CARDIOVASCULAR ULTRASOUND, BY TECHNOLOGY, 2022-2032 ($MILLION)
  • TABLE 135. ARGENTINA CARDIOVASCULAR ULTRASOUND, BY DEVICE DISPLAY, 2022-2032 ($MILLION)
  • TABLE 136. ARGENTINA CARDIOVASCULAR ULTRASOUND, BY END USER, 2022-2032 ($MILLION)
  • TABLE 137. REST OF LAMEA CARDIOVASCULAR ULTRASOUND, BY TEST TYPE, 2022-2032 ($MILLION)
  • TABLE 138. REST OF LAMEA CARDIOVASCULAR ULTRASOUND, BY TECHNOLOGY, 2022-2032 ($MILLION)
  • TABLE 139. REST OF LAMEA CARDIOVASCULAR ULTRASOUND, BY DEVICE DISPLAY, 2022-2032 ($MILLION)
  • TABLE 140. REST OF LAMEA CARDIOVASCULAR ULTRASOUND, BY END USER, 2022-2032 ($MILLION)
  • TABLE 141. GENERAL ELECTRIC COMPANY: KEY EXECUTIVES
  • TABLE 142. GENERAL ELECTRIC COMPANY: COMPANY SNAPSHOT
  • TABLE 143. GENERAL ELECTRIC COMPANY: OPERATING SEGMENTS
  • TABLE 144. GENERAL ELECTRIC COMPANY: PRODUCT PORTFOLIO
  • TABLE 145. GENERAL ELECTRIC COMPANY: KEY STRATEGIC MOVES AND DEVELOPMENTS
  • TABLE 146. KONINKLIJKE PHILIPS N.V.: KEY EXECUTIVES
  • TABLE 147. KONINKLIJKE PHILIPS N.V.: COMPANY SNAPSHOT
  • TABLE 148. KONINKLIJKE PHILIPS N.V.: OPERATING SEGMENTS
  • TABLE 149. KONINKLIJKE PHILIPS N.V.: PRODUCT PORTFOLIO
  • TABLE 150. KONINKLIJKE PHILIPS N.V.: KEY STRATEGIC MOVES AND DEVELOPMENTS
  • TABLE 151. TOSHIBA CORPORATION: KEY EXECUTIVES
  • TABLE 152. TOSHIBA CORPORATION: COMPANY SNAPSHOT
  • TABLE 153. TOSHIBA CORPORATION: OPERATING SEGMENTS
  • TABLE 154. TOSHIBA CORPORATION: PRODUCT PORTFOLIO
  • TABLE 155. TOSHIBA CORPORATION: KEY STRATEGIC MOVES AND DEVELOPMENTS
  • TABLE 156. HITACHI LTD.: KEY EXECUTIVES
  • TABLE 157. HITACHI LTD.: COMPANY SNAPSHOT
  • TABLE 158. HITACHI LTD.: OPERATING SEGMENTS
  • TABLE 159. HITACHI LTD.: PRODUCT PORTFOLIO
  • TABLE 160. HITACHI LTD.: KEY STRATEGIC MOVES AND DEVELOPMENTS
  • TABLE 161. SAMSUNG: KEY EXECUTIVES
  • TABLE 162. SAMSUNG: COMPANY SNAPSHOT
  • TABLE 163. SAMSUNG: OPERATING SEGMENTS
  • TABLE 164. SAMSUNG: PRODUCT PORTFOLIO
  • TABLE 165. SAMSUNG: KEY STRATEGIC MOVES AND DEVELOPMENTS
  • TABLE 166. FUJIFILM HOLDINGS CORPORATION: KEY EXECUTIVES
  • TABLE 167. FUJIFILM HOLDINGS CORPORATION: COMPANY SNAPSHOT
  • TABLE 168. FUJIFILM HOLDINGS CORPORATION: OPERATING SEGMENTS
  • TABLE 169. FUJIFILM HOLDINGS CORPORATION: PRODUCT PORTFOLIO
  • TABLE 170. FUJIFILM HOLDINGS CORPORATION: KEY STRATEGIC MOVES AND DEVELOPMENTS
  • TABLE 171. ESAOTE SPA: KEY EXECUTIVES
  • TABLE 172. ESAOTE SPA: COMPANY SNAPSHOT
  • TABLE 173. ESAOTE SPA: OPERATING SEGMENTS
  • TABLE 174. ESAOTE SPA: PRODUCT PORTFOLIO
  • TABLE 175. ESAOTE SPA: KEY STRATEGIC MOVES AND DEVELOPMENTS
  • TABLE 176. SHENZHEN MINDRAY BIO-MEDICAL ELECTRONICS CO., LTD.: KEY EXECUTIVES
  • TABLE 177. SHENZHEN MINDRAY BIO-MEDICAL ELECTRONICS CO., LTD.: COMPANY SNAPSHOT
  • TABLE 178. SHENZHEN MINDRAY BIO-MEDICAL ELECTRONICS CO., LTD.: OPERATING SEGMENTS
  • TABLE 179. SHENZHEN MINDRAY BIO-MEDICAL ELECTRONICS CO., LTD.: PRODUCT PORTFOLIO
  • TABLE 180. SHENZHEN MINDRAY BIO-MEDICAL ELECTRONICS CO., LTD.: KEY STRATEGIC MOVES AND DEVELOPMENTS
  • TABLE 181. SIEMENS AG: KEY EXECUTIVES
  • TABLE 182. SIEMENS AG: COMPANY SNAPSHOT
  • TABLE 183. SIEMENS AG: OPERATING SEGMENTS
  • TABLE 184. SIEMENS AG: PRODUCT PORTFOLIO
  • TABLE 185. SIEMENS AG: KEY STRATEGIC MOVES AND DEVELOPMENTS
  • TABLE 186. ANALOGIC CORPORATION: KEY EXECUTIVES
  • TABLE 187. ANALOGIC CORPORATION: COMPANY SNAPSHOT
  • TABLE 188. ANALOGIC CORPORATION: OPERATING SEGMENTS
  • TABLE 189. ANALOGIC CORPORATION: PRODUCT PORTFOLIO
  • TABLE 190. ANALOGIC CORPORATION: KEY STRATEGIC MOVES AND DEVELOPMENTS
  • LIST OF FIGURES

  • FIGURE 1. GLOBAL CARDIOVASCULAR ULTRASOUND MARKET SEGMENTATION
  • FIGURE 2. GLOBAL CARDIOVASCULAR ULTRASOUND MARKET
  • FIGURE 3. SEGMENTATION CARDIOVASCULAR ULTRASOUND MARKET
  • FIGURE 4. TOP INVESTMENT POCKET IN CARDIOVASCULAR ULTRASOUND MARKET
  • FIGURE 5. MODERATE BARGAINING POWER OF BUYERS
  • FIGURE 6. MODERATE BARGAINING POWER OF SUPPLIERS
  • FIGURE 7. MODERATE THREAT OF NEW ENTRANTS
  • FIGURE 8. LOW THREAT OF SUBSTITUTION
  • FIGURE 9. HIGH COMPETITIVE RIVALRY
  • FIGURE 10. OPPORTUNITIES, RESTRAINTS AND DRIVERS: GLOBALCARDIOVASCULAR ULTRASOUND MARKET
  • FIGURE 11. CARDIOVASCULAR ULTRASOUND MARKET SEGMENTATION, BY BY TEST TYPE
  • FIGURE 12. CARDIOVASCULAR ULTRASOUND MARKET FOR TRANSTHORACIC ECHOCARDIOGRAM, BY COUNTRY, 2022-2032 ($MILLION)
  • FIGURE 13. CARDIOVASCULAR ULTRASOUND MARKET FOR TRANSESOPHAGEAL ECHOCARDIOGRAM, BY COUNTRY, 2022-2032 ($MILLION)
  • FIGURE 14. CARDIOVASCULAR ULTRASOUND MARKET FOR STRESS ECHOCARDIOGRAM, BY COUNTRY, 2022-2032 ($MILLION)
  • FIGURE 15. CARDIOVASCULAR ULTRASOUND MARKET FOR OTHER ECHOCARDIOGRAMS (FETAL AND INTRACARDIAC ECHOCARDIOGRAMS), BY COUNTRY, 2022-2032 ($MILLION)
  • FIGURE 16. CARDIOVASCULAR ULTRASOUND MARKET SEGMENTATION, BY BY TECHNOLOGY
  • FIGURE 17. CARDIOVASCULAR ULTRASOUND MARKET FOR 2D, BY COUNTRY, 2022-2032 ($MILLION)
  • FIGURE 18. CARDIOVASCULAR ULTRASOUND MARKET FOR 3D 4D, BY COUNTRY, 2022-2032 ($MILLION)
  • FIGURE 19. CARDIOVASCULAR ULTRASOUND MARKET FOR DOPPLER IMAGING, BY COUNTRY, 2022-2032 ($MILLION)
  • FIGURE 20. CARDIOVASCULAR ULTRASOUND MARKET SEGMENTATION, BY BY DEVICE DISPLAY
  • FIGURE 21. CARDIOVASCULAR ULTRASOUND MARKET FOR COLOR DISPLAY, BY COUNTRY, 2022-2032 ($MILLION)
  • FIGURE 22. CARDIOVASCULAR ULTRASOUND MARKET FOR BLACK WHITE (B/W) DISPLAY, BY COUNTRY, 2022-2032 ($MILLION)
  • FIGURE 23. CARDIOVASCULAR ULTRASOUND MARKET SEGMENTATION, BY BY END USER
  • FIGURE 24. CARDIOVASCULAR ULTRASOUND MARKET FOR HOSPITALS, BY COUNTRY, 2022-2032 ($MILLION)
  • FIGURE 25. CARDIOVASCULAR ULTRASOUND MARKET FOR CARDIOLOGY CENTERS, BY COUNTRY, 2022-2032 ($MILLION)
  • FIGURE 26. CARDIOVASCULAR ULTRASOUND MARKET FOR AMBULATORY, BY COUNTRY, 2022-2032 ($MILLION)
  • FIGURE 27. CARDIOVASCULAR ULTRASOUND MARKET FOR HOME CARE, BY COUNTRY, 2022-2032 ($MILLION)
  • FIGURE 28. CARDIOVASCULAR ULTRASOUND MARKET FOR AMBULATORY CENTERS, BY COUNTRY, 2022-2032 ($MILLION)
  • FIGURE 29. CARDIOVASCULAR ULTRASOUND MARKET FOR OTHERS (RESEARCH INSTITUTES, MEDICAL DEVICE, AND PHARMACEUTICAL COMPANIES), BY COUNTRY, 2022-2032 ($MILLION)
  • FIGURE 30. TOP WINNING STRATEGIES, BY YEAR, 2020-2022*
  • FIGURE 31. TOP WINNING STRATEGIES, BY DEVELOPMENT, 2020-2022*
  • FIGURE 32. TOP WINNING STRATEGIES, BY COMPANY, 2020-2022*
  • FIGURE 33. PRODUCT MAPPING OF TOP 10 PLAYERS
  • FIGURE 34. COMPETITIVE DASHBOARD
  • FIGURE 35. COMPETITIVE HEATMAP: CARDIOVASCULAR ULTRASOUND MARKET
  • FIGURE 36. Top player positioning, 2022
  • FIGURE 37. GENERAL ELECTRIC COMPANY: NET SALES, 2020-2022 ($MILLION)
  • FIGURE 38. GENERAL ELECTRIC COMPANY: REVENUE SHARE, BY SEGMENT, 2032 (%)
  • FIGURE 39. GENERAL ELECTRIC COMPANY: REVENUE SHARE, BY REGION, 2032 (%)
  • FIGURE 40. KONINKLIJKE PHILIPS N.V.: NET SALES, 2020-2022 ($MILLION)
  • FIGURE 41. KONINKLIJKE PHILIPS N.V.: REVENUE SHARE, BY SEGMENT, 2032 (%)
  • FIGURE 42. KONINKLIJKE PHILIPS N.V.: REVENUE SHARE, BY REGION, 2032 (%)
  • FIGURE 43. TOSHIBA CORPORATION: NET SALES, 2020-2022 ($MILLION)
  • FIGURE 44. TOSHIBA CORPORATION: REVENUE SHARE, BY SEGMENT, 2032 (%)
  • FIGURE 45. TOSHIBA CORPORATION: REVENUE SHARE, BY REGION, 2032 (%)
  • FIGURE 46. HITACHI LTD.: NET SALES, 2020-2022 ($MILLION)
  • FIGURE 47. HITACHI LTD.: REVENUE SHARE, BY SEGMENT, 2032 (%)
  • FIGURE 48. HITACHI LTD.: REVENUE SHARE, BY REGION, 2032 (%)
  • FIGURE 49. SAMSUNG: NET SALES, 2020-2022 ($MILLION)
  • FIGURE 50. SAMSUNG: REVENUE SHARE, BY SEGMENT, 2032 (%)
  • FIGURE 51. SAMSUNG: REVENUE SHARE, BY REGION, 2032 (%)
  • FIGURE 52. FUJIFILM HOLDINGS CORPORATION: NET SALES, 2020-2022 ($MILLION)
  • FIGURE 53. FUJIFILM HOLDINGS CORPORATION: REVENUE SHARE, BY SEGMENT, 2032 (%)
  • FIGURE 54. FUJIFILM HOLDINGS CORPORATION: REVENUE SHARE, BY REGION, 2032 (%)
  • FIGURE 55. ESAOTE SPA: NET SALES, 2020-2022 ($MILLION)
  • FIGURE 56. ESAOTE SPA: REVENUE SHARE, BY SEGMENT, 2032 (%)
  • FIGURE 57. ESAOTE SPA: REVENUE SHARE, BY REGION, 2032 (%)
  • FIGURE 58. SHENZHEN MINDRAY BIO-MEDICAL ELECTRONICS CO., LTD.: NET SALES, 2020-2022 ($MILLION)
  • FIGURE 59. SHENZHEN MINDRAY BIO-MEDICAL ELECTRONICS CO., LTD.: REVENUE SHARE, BY SEGMENT, 2032 (%)
  • FIGURE 60. SHENZHEN MINDRAY BIO-MEDICAL ELECTRONICS CO., LTD.: REVENUE SHARE, BY REGION, 2032 (%)
  • FIGURE 61. SIEMENS AG: NET SALES, 2020-2022 ($MILLION)
  • FIGURE 62. SIEMENS AG: REVENUE SHARE, BY SEGMENT, 2032 (%)
  • FIGURE 63. SIEMENS AG: REVENUE SHARE, BY REGION, 2032 (%)
  • FIGURE 64. ANALOGIC CORPORATION: NET SALES, 2020-2022 ($MILLION)
  • FIGURE 65. ANALOGIC CORPORATION: REVENUE SHARE, BY SEGMENT, 2032 (%)
  • FIGURE 66. ANALOGIC CORPORATION: REVENUE SHARE, BY REGION, 2032 (%)


With collective industry experience of about 200 years of its analysts and experts, Allied Market Research (AMR) encompasses most infallible research methodology for its market intelligence and industry analysis. We do not only engrave the deepest levels of markets but also sneak through its slimmest details for the purpose of our market estimates and forecasts. Our approach helps in building greater market consensus view for size, shape and industry trends within each industry segment. We carefully factor in industry trends and real developments for identifying key growth factors and future course of the market. Our research proceeds are the resultant of high quality data, expert views and analysis and high value independent opinions. Our research process is designed to deliver balanced view of the global markets and allow stakeholders to make informed decisions.

We offer our clients exhaustive research and analysis based on wide variety of factual inputs, which largely include interviews with industry participants, reliable statistics and regional intelligence. Our in-house industry experts play instrumental role in designing analytic tools and models, tailored to the requirements of particular industry segment. These analytical tools and models sanitize the data & statistics and enhance the accuracy of our recommendations and advice. With AMR’s calibrated research process and 360` degree data-evaluation methodology, our clients are assured of receiving:

  • Consistent, valuable, robust and actionable data & analysis that can easily be referenced for strategic business planning
  • Technologically sophisticated and reliable insights through well audited and veracious research methodology
  • Sovereign research proceeds that present a tangible depiction of marketplace


With a strong methodology we are, therefore, confident that our research and analysis are most reliable and guarantees sound business planning.

Secondary research
We refer a broad array of industry sources for our secondary, which typically include; however, not limited to: Company SEC filings, annual reports, company websites, broker & financial reports and investor presentations for competitive scenario and shape of the industry

  • Patent and regulatory databases for understanding of technical & legal developments
  • Scientific and technical writings for product information and related preemptions
  • Regional government and statistical databases for macro analysis
  • Authentic new articles, web-casts and other related releases for market evaluation
  • Internal and external proprietary databases, key market indicators and relevant press releases for market estimates and forecast


Primary research
Our primary research efforts include reaching out participants through mail, tele-conversations, referrals, professional networks and face-to-face interactions. We are also in professional corporate relations with various companies that allow us greater flexibility for reaching out industry participants and commentators for interviews and discussions, fulfilling following functions:

  • Validates and improves the data quality and strengthens research proceeds
  • Further develops analyst team’s market understanding and expertise
  • Supplies authentic information about market size, share, growth and forecasts


Our primary research interview and discussion panels are typically composed of most experienced industry members. These participants include; however, not limited to:

  • Chief executives and VPs of leading corporations specific to industry
  • Product and sales managers or country heads; channel partners and top level distributors; banking, investments and valuation experts Key opinion leaders (KOLs)


Analyst tools and models
AMR has developed set of analyst tools and data models to supplement and expedite the analysis process. Corresponding to markets, where there is significant lack of information and estimates, AMR’s team of experts and analyst develop specific analyst tools and industry models to translate qualitative and quantitative industry indicators into exact industry estimates. These models also allow analysts to examine the prospects and opportunities prevailing in the market to accurately forecast the course of the market.

PURCHASE OPTIONS

Call or Email us

U.S.-Canada Toll-free: +1-800-792-5285
Int'l : +1-503-894-6022
Europe : +44-845-528-1300
Email : help@alliedmarketresearch.com

Looking for Customization?

 Customization Request

Have a Question?

 Speak with Analyst

Any Confusion?

 Inquire Before Buying

Have a glance of the Report

  Enquiry Now

Purchase Full Report of
Cardiovascular Ultrasound Market

Start reading.
This Report and over 67,070+ more Reports, Available with Avenue Library. T&C*.

  • Online Only
  • $3,690
  • Online cloud access only
  • Restricted print, copy, paste & download
  • Read only
  • Free industry update
    (Within 180 days)
  • Free report update in next update cycle
  • Data Pack
  • $3,840
  • Restricted to one authorized user
  • One print only
  • Available in
    Excel
  • Free industry update
    (Within 180 days)
  •   Free report update in next update cycle
  • Single User
  • $5,820
  • Restricted to one authorized user
  • One print only
  • Available in
    PDF
  • Free industry update
    (Within 180 days)
  •   Free report update in next update cycle
  • Five Users
  • $6,540
  • Limited to five authorized users
  • Print upto five copies
  • Available in
    PDF
  • Free industry update
    (Within 180 days)
  •   Free report update in next update cycle
  • Enterprise
    License/PDF

  • $9,870
  • Unlimited
    within
    company/enterprise
  • Available in Excel & PDF
  • Free industry update
    (Within 180 days)
  •   Free report update in next update cycle
  • Library
    Membership

  • $999 $ 1,175
    Per User/ Per month/ Billed annually
  • Published Content
    E-access
  • Company Profiles
    E-access
  • Newly Added Content Access
  • 10 PDF
    Downloads
  • 5 Excel Data
    Pack Downloads
  • 250 Company Profiles PDF Downloads
  • Buy Now

*Taxes/Fees, if applicable will be added during checkout. All prices in USD

RELATED REPORTS
 

Why Allied Market Research?


Infallible Methodology

To ensure high-level data integrity, accurate analysis, and impeccable forecasts

Analyst Support

For complete satisfaction

Customization

On-demand customization of scope of the report to exactly meet your needs

TARGETED MARKET VIEW

Targeted market view to provide pertinent information and save time of readers

Get fresh content delivered

Get insights on topics that are crucial for your business. Stay abreast of your interest areas.

Get Industry Data Alerts

Why Allied Market Research?

Infallible Methodology

To ensure high-level data integrity, accurate analysis, and impeccable forecasts

Analyst Support

For complete satisfaction

Customization

On-demand customization of scope of the report to exactly meet your needs

TARGETED MARKET VIEW

Targeted market view to provide pertinent information and save time of readers