0
2023
Catamaran Market

Catamaran Market

by Product Type (Sailing Catamaran, Powered Catamaran), by Size (Below 15m, 16m-30m, Above 30m), by Application (Sports, Leisure, Transport, Others): Global Opportunity Analysis and Industry Forecast, 2021-2031

Report Code: A11384
Feb 2023 | Pages: 330
Tables: 124
Charts: 48
  • Formats*:

  • pdf

    Single User License, Five User
    License & Enterprise User License

  • xls

    Data Pack Excel License

  • ppt

    It comes with the additional cost
    of $2500.00 contact sales.


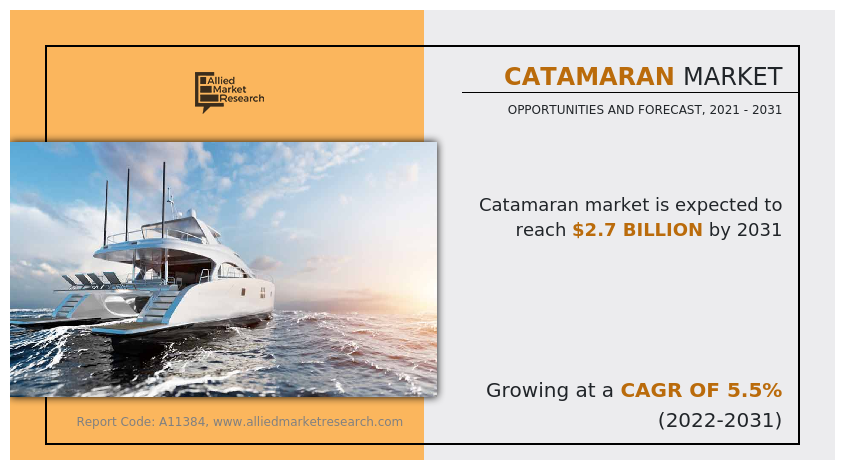
The global catamaran market size was valued at $1.6 billion in 2021, and is projected to reach $2.7 billion by 2031, growing at a CAGR of 5.5% from 2022 to 2031.

A catamaran is a type of watercraft that features two parallel hulls of equal size, typically made of fiberglass, wood, or aluminum, which are joined together by a frame. It is designed for use in various water activities such as sailing, racing, cruising, and fishing. Catamarans can be propelled by sails or engines and they are known for their stability, speed, and comfort, making them popular among sailors and water enthusiasts. They come in various sizes, from small recreational boats to large commercial vessels.
Catamaran Market

Growth in demand for leisure and recreational activities

The catamaran market is driven by the increasing demand for leisure and recreational activities such as yacht chartering, island hopping, and cruising. The surge in popularity of boating as a leisure activity fuels the demand for catamarans, as they offer more space, comfort, and stability compared to traditional monohull boats. The demand for leisure and recreational activities has been steadily growing in recent years, driven by factors such as increase in disposable income, change in consumer preferences, and a growth in focus on health & wellness. One of the fastest-growing segments within the leisure industry is outdoor recreation, which includes activities such as camping, hiking, and water sports.

For instance, according to the Outdoor Industry Association, outdoor recreation in the U.S. generated $459.8 billion in consumer spending in 2019, supporting 5.2 million jobs and contributing $788 billion to the nation's gross output. Therefore, the growing demand for leisure and recreational activities are projected to drive the market growth during the forecast period.
Catamaran Market

Advantages of catamarans over monohull boats

Catamarans have several advantages over monohull boats that have contributed to their increase in popularity and market growth. Primarily, catamarans offer greater stability and safety compared to monohulls, thanks to their wider beam and twin-hull design. This makes them less prone to capsizing, even in rough waters. In addition, catamarans are faster and more efficient than monohulls due to their reduced drag and increased buoyancy. This means they can travel further and faster on less fuel, making them more cost-effective and environmentally friendly.

The comfort level of catamarans is also a key advantage. The two hulls provide a stable platform that minimizes rocking and rolling, making them ideal for those who suffer from seasickness. The spacious decks, cabins, and saloons also provide plenty of room for passengers to move around and relax, making them perfect for extended trips and liveaboard use.
Catamaran Market

Several companies have developed innovative catamaran designs and technologies to meet the growing demand for these vessels. For instance, Lagoon, Fountaine Pajot, and Leopard Catamarans are leading manufacturers of luxury catamarans, while Sunreef Yachts specialize in custom-built catamarans. Other companies, such as Gunboat and HH Catamarans, focus on high-performance catamarans for racing and offshore sailing. Overall, the advantages of catamarans over monohulls have helped to drive market growth and innovation in this sector.

High initial costs

One of the main challenges faced by the catamarans market is the high initial costs associated with these vessels. Catamarans are typically larger and more complex than monohull boats, which means they require more materials and labor to build. In addition, the specialized design and features of catamarans can also add to their costs. This can make catamarans a more expensive investment compared to traditional boats, which can be a barrier for some potential buyers.

For instance, a basic 40-foot catamaran can cost around $250,000 to $500,000, while larger models can cost well over $1 million. This cost can be even higher for custom-built or luxury catamarans. As a result, many people may opt for a more affordable monohull boat instead of a catamaran. Moreover, the high initial cost of catamarans is anticipated to hamper the market growth during the forecast period.
Catamaran Market

Technological advancements in Catamarans

One area of advancement is in propulsion systems. Some catamaran manufacturers have developed hybrid and electric propulsion systems that are more efficient and environmentally friendly than traditional diesel engines. For instance, Sunreef Yachts offers a range of electric and hybrid catamarans that can run solely on electric power or a combination of electric and diesel power, depending on the conditions.

Another area of advancement is in design and materials. Catamaran manufacturers are exploring new materials such as carbon fiber, which is lighter and stronger than traditional fiberglass. This allows for the construction of lighter and more fuel-efficient vessels. In addition, advances in computer-aided design (CAD) software and simulation tools are allowing designers to optimize the hull shape and improve the hydrodynamics of the vessel, resulting in improved speed and fuel efficiency.

Therefore, advancements in navigation and communication technology are making catamarans safer and easier to operate. This includes the integration of satellite navigation systems, radar, and sonar technology to improve situational awareness and collision avoidance, as well as advanced communication systems that allow remote monitoring and control of the vessel. These technological advancements are creating new opportunities for the catamarans market to develop more efficient, high-performance, and technologically advanced vessels.
Catamaran Market

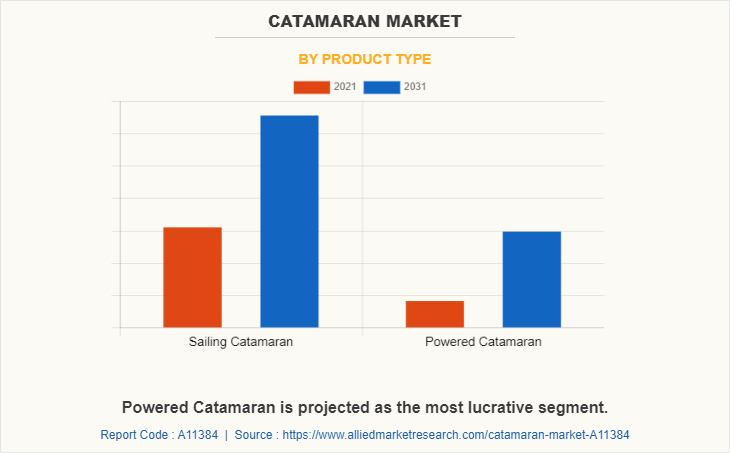
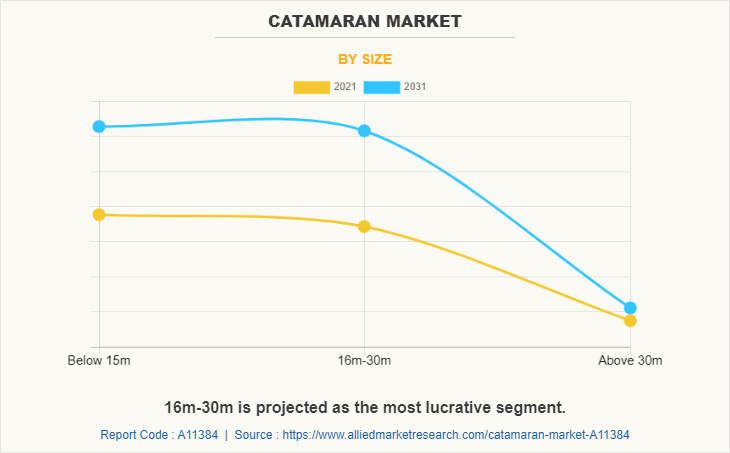
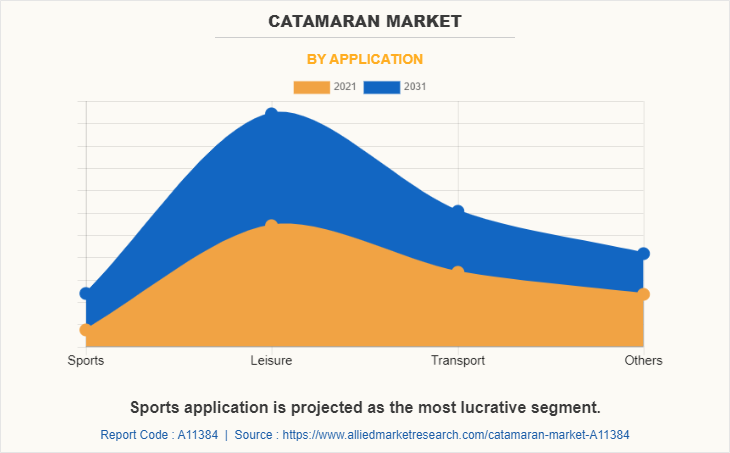
The catamaran market is segmented on the basis of size, application, product type, and region. By size, the market is divided into below 15m, 16m-30m, and above 31m. By application, it is fragmented into sports, leisure, transport, and others. By product type, it is bifurcated into sailing catamaran and power catamaran. By region, it is analyzed across North America, Europe, Asia-Pacific, and LAMEA.

The leading players operating in the catamaran market are Leopard Catamarans, Outremer catamarans, Beneteau/Lagoon, Fountaine Pajot, Catana Catamarans, Nautitech Catamaran, Privilege Catamarans, Antares Catamarans, Gemini Catamarans, and Seawind Cats.

The COVID-19 pandemic had a significant impact on the catamaran industry, with reduced demand, disrupted supply chains, and increased costs affecting manufacturers and operators. However, organizations in the industry have demonstrated resilience by adapting to changing circumstances and exploring new business models, which support the company’s growth during the forecast period.

Key Benefits For Stakeholders

  • This report provides a quantitative analysis of the market segments, current trends, estimations, and dynamics of the catamaran market share analysis from 2021 to 2031 to identify the prevailing catamaran market opportunities.
  • The market research is offered along with information related to key drivers, restraints, and opportunities.
  • Porter's five forces analysis highlights the potency of buyers and suppliers to enable stakeholders make profit-oriented business decisions and strengthen their supplier-buyer network.
  • In-depth analysis of the catamaran market segmentation assists to determine the prevailing market opportunities.
  • Major countries in each region are mapped according to their revenue contribution to the global market.
  • Market player positioning facilitates benchmarking and provides a clear understanding of the present position of the market players.
  • The report includes the analysis of the regional as well as global catamaran market trends, key players, market segments, application areas, and market growth strategies.

Catamaran Market Report Highlights

Aspects Details
Market Size By 2031 USD 2.7 billion
Growth Rate CAGR of 5.5%
Forecast period 2021 - 2031
Report Pages 330
By Product Type
  • Sailing Catamaran
  • Powered Catamaran
By Size
  • Below 15m
  • 16m-30m
  • Above 30m
By Application
  • Sports
  • Leisure
  • Transport
  • Others
By Region
  • North America  (U.S., Canada, Mexico)
  • Europe  (France, Italy, Netherlands, Germany, Rest of Europe)
  • Asia-Pacific  (China, Australia, Singapore, Japan, Rest of Asia-Pacific)
  • LAMEA  (Latin America, Middle East, Africa)
Key Market Players CATANAGROUP, Privilege Catamarans America, Grand Large Yachting group, Lagoon Catamarans, Seawind Group Holdings, Pty Ltd, Travelopia, Bavaria Yachtbau GmbH, Gemini Catamarans., Fountaine Pajot, Kinetic Catamarans
 
  • CHAPTER 1: INTRODUCTION

    • 1.1. Report description

    • 1.2. Key market segments

    • 1.3. Key benefits to the stakeholders

    • 1.4. Research Methodology

      • 1.4.1. Primary research

      • 1.4.2. Secondary research

      • 1.4.3. Analyst tools and models

  • CHAPTER 2: EXECUTIVE SUMMARY

    • 2.1. CXO Perspective

  • CHAPTER 3: MARKET OVERVIEW

    • 3.1. Market definition and scope

    • 3.2. Key findings

      • 3.2.1. Top impacting factors

      • 3.2.2. Top investment pockets

    • 3.3. Porter’s five forces analysis

      • 3.3.1. Bargaining power of suppliers

      • 3.3.2. Bargaining power of buyers

      • 3.3.3. Threat of substitutes

      • 3.3.4. Threat of new entrants

      • 3.3.5. Intensity of rivalry

    • 3.4. Market dynamics

      • 3.4.1. Drivers

        • 3.4.1.1. Growing demand for leisure and recreational activities
        • 3.4.1.2. Advantages of catamarans over monohull boats
        • 3.4.1.3. Increasing demand for eco-friendly vessels

      • 3.4.2. Restraints

        • 3.4.2.1. High initial costs
        • 3.4.2.2. Environmental concerns

      • 3.4.3. Opportunities

        • 3.4.3.1. Technological advancements in Catamarans
        • 3.4.3.2. Increasing demand for luxury catamarans

    • 3.5. COVID-19 Impact Analysis on the market

  • CHAPTER 4: CATAMARAN MARKET, BY PRODUCT TYPE

    • 4.1. Overview

      • 4.1.1. Market size and forecast

    • 4.2. Sailing Catamaran

      • 4.2.1. Key market trends, growth factors and opportunities

      • 4.2.2. Market size and forecast, by region

      • 4.2.3. Market share analysis by country

    • 4.3. Powered Catamaran

      • 4.3.1. Key market trends, growth factors and opportunities

      • 4.3.2. Market size and forecast, by region

      • 4.3.3. Market share analysis by country

  • CHAPTER 5: CATAMARAN MARKET, BY SIZE

    • 5.1. Overview

      • 5.1.1. Market size and forecast

    • 5.2. Below 15m

      • 5.2.1. Key market trends, growth factors and opportunities

      • 5.2.2. Market size and forecast, by region

      • 5.2.3. Market share analysis by country

    • 5.3. 16m-30m

      • 5.3.1. Key market trends, growth factors and opportunities

      • 5.3.2. Market size and forecast, by region

      • 5.3.3. Market share analysis by country

    • 5.4. Above 30m

      • 5.4.1. Key market trends, growth factors and opportunities

      • 5.4.2. Market size and forecast, by region

      • 5.4.3. Market share analysis by country

  • CHAPTER 6: CATAMARAN MARKET, BY APPLICATION

    • 6.1. Overview

      • 6.1.1. Market size and forecast

    • 6.2. Sports

      • 6.2.1. Key market trends, growth factors and opportunities

      • 6.2.2. Market size and forecast, by region

      • 6.2.3. Market share analysis by country

    • 6.3. Leisure

      • 6.3.1. Key market trends, growth factors and opportunities

      • 6.3.2. Market size and forecast, by region

      • 6.3.3. Market share analysis by country

    • 6.4. Transport

      • 6.4.1. Key market trends, growth factors and opportunities

      • 6.4.2. Market size and forecast, by region

      • 6.4.3. Market share analysis by country

    • 6.5. Others

      • 6.5.1. Key market trends, growth factors and opportunities

      • 6.5.2. Market size and forecast, by region

      • 6.5.3. Market share analysis by country

  • CHAPTER 7: CATAMARAN MARKET, BY REGION

    • 7.1. Overview

      • 7.1.1. Market size and forecast By Region

    • 7.2. North America

      • 7.2.1. Key trends and opportunities

      • 7.2.2. Market size and forecast, by Product Type

      • 7.2.3. Market size and forecast, by Size

      • 7.2.4. Market size and forecast, by Application

      • 7.2.5. Market size and forecast, by country

        • 7.2.5.1. U.S.
          • 7.2.5.1.1. Key market trends, growth factors and opportunities
          • 7.2.5.1.2. Market size and forecast, by Product Type
          • 7.2.5.1.3. Market size and forecast, by Size
          • 7.2.5.1.4. Market size and forecast, by Application
        • 7.2.5.2. Canada
          • 7.2.5.2.1. Key market trends, growth factors and opportunities
          • 7.2.5.2.2. Market size and forecast, by Product Type
          • 7.2.5.2.3. Market size and forecast, by Size
          • 7.2.5.2.4. Market size and forecast, by Application
        • 7.2.5.3. Mexico
          • 7.2.5.3.1. Key market trends, growth factors and opportunities
          • 7.2.5.3.2. Market size and forecast, by Product Type
          • 7.2.5.3.3. Market size and forecast, by Size
          • 7.2.5.3.4. Market size and forecast, by Application
    • 7.3. Europe

      • 7.3.1. Key trends and opportunities

      • 7.3.2. Market size and forecast, by Product Type

      • 7.3.3. Market size and forecast, by Size

      • 7.3.4. Market size and forecast, by Application

      • 7.3.5. Market size and forecast, by country

        • 7.3.5.1. France
          • 7.3.5.1.1. Key market trends, growth factors and opportunities
          • 7.3.5.1.2. Market size and forecast, by Product Type
          • 7.3.5.1.3. Market size and forecast, by Size
          • 7.3.5.1.4. Market size and forecast, by Application
        • 7.3.5.2. Italy
          • 7.3.5.2.1. Key market trends, growth factors and opportunities
          • 7.3.5.2.2. Market size and forecast, by Product Type
          • 7.3.5.2.3. Market size and forecast, by Size
          • 7.3.5.2.4. Market size and forecast, by Application
        • 7.3.5.3. Netherlands
          • 7.3.5.3.1. Key market trends, growth factors and opportunities
          • 7.3.5.3.2. Market size and forecast, by Product Type
          • 7.3.5.3.3. Market size and forecast, by Size
          • 7.3.5.3.4. Market size and forecast, by Application
        • 7.3.5.4. Germany
          • 7.3.5.4.1. Key market trends, growth factors and opportunities
          • 7.3.5.4.2. Market size and forecast, by Product Type
          • 7.3.5.4.3. Market size and forecast, by Size
          • 7.3.5.4.4. Market size and forecast, by Application
        • 7.3.5.5. Rest of Europe
          • 7.3.5.5.1. Key market trends, growth factors and opportunities
          • 7.3.5.5.2. Market size and forecast, by Product Type
          • 7.3.5.5.3. Market size and forecast, by Size
          • 7.3.5.5.4. Market size and forecast, by Application
    • 7.4. Asia-Pacific

      • 7.4.1. Key trends and opportunities

      • 7.4.2. Market size and forecast, by Product Type

      • 7.4.3. Market size and forecast, by Size

      • 7.4.4. Market size and forecast, by Application

      • 7.4.5. Market size and forecast, by country

        • 7.4.5.1. China
          • 7.4.5.1.1. Key market trends, growth factors and opportunities
          • 7.4.5.1.2. Market size and forecast, by Product Type
          • 7.4.5.1.3. Market size and forecast, by Size
          • 7.4.5.1.4. Market size and forecast, by Application
        • 7.4.5.2. Australia
          • 7.4.5.2.1. Key market trends, growth factors and opportunities
          • 7.4.5.2.2. Market size and forecast, by Product Type
          • 7.4.5.2.3. Market size and forecast, by Size
          • 7.4.5.2.4. Market size and forecast, by Application
        • 7.4.5.3. Singapore
          • 7.4.5.3.1. Key market trends, growth factors and opportunities
          • 7.4.5.3.2. Market size and forecast, by Product Type
          • 7.4.5.3.3. Market size and forecast, by Size
          • 7.4.5.3.4. Market size and forecast, by Application
        • 7.4.5.4. Japan
          • 7.4.5.4.1. Key market trends, growth factors and opportunities
          • 7.4.5.4.2. Market size and forecast, by Product Type
          • 7.4.5.4.3. Market size and forecast, by Size
          • 7.4.5.4.4. Market size and forecast, by Application
        • 7.4.5.5. Rest of Asia-Pacific
          • 7.4.5.5.1. Key market trends, growth factors and opportunities
          • 7.4.5.5.2. Market size and forecast, by Product Type
          • 7.4.5.5.3. Market size and forecast, by Size
          • 7.4.5.5.4. Market size and forecast, by Application
    • 7.5. LAMEA

      • 7.5.1. Key trends and opportunities

      • 7.5.2. Market size and forecast, by Product Type

      • 7.5.3. Market size and forecast, by Size

      • 7.5.4. Market size and forecast, by Application

      • 7.5.5. Market size and forecast, by country

        • 7.5.5.1. Latin America
          • 7.5.5.1.1. Key market trends, growth factors and opportunities
          • 7.5.5.1.2. Market size and forecast, by Product Type
          • 7.5.5.1.3. Market size and forecast, by Size
          • 7.5.5.1.4. Market size and forecast, by Application
        • 7.5.5.2. Middle East
          • 7.5.5.2.1. Key market trends, growth factors and opportunities
          • 7.5.5.2.2. Market size and forecast, by Product Type
          • 7.5.5.2.3. Market size and forecast, by Size
          • 7.5.5.2.4. Market size and forecast, by Application
        • 7.5.5.3. Africa
          • 7.5.5.3.1. Key market trends, growth factors and opportunities
          • 7.5.5.3.2. Market size and forecast, by Product Type
          • 7.5.5.3.3. Market size and forecast, by Size
          • 7.5.5.3.4. Market size and forecast, by Application
  • CHAPTER 8: COMPETITIVE LANDSCAPE

    • 8.1. Introduction

    • 8.2. Top winning strategies

    • 8.3. Product Mapping of Top 10 Player

    • 8.4. Competitive Dashboard

    • 8.5. Competitive Heatmap

    • 8.6. Top player positioning, 2021

  • CHAPTER 9: COMPANY PROFILES

    • 9.1. Travelopia

      • 9.1.1. Company overview

      • 9.1.2. Key Executives

      • 9.1.3. Company snapshot

      • 9.1.4. Operating business segments

      • 9.1.5. Product portfolio

    • 9.2. Grand Large Yachting group

      • 9.2.1. Company overview

      • 9.2.2. Key Executives

      • 9.2.3. Company snapshot

      • 9.2.4. Operating business segments

      • 9.2.5. Product portfolio

      • 9.2.6. Key strategic moves and developments

    • 9.3. Lagoon Catamarans

      • 9.3.1. Company overview

      • 9.3.2. Key Executives

      • 9.3.3. Company snapshot

      • 9.3.4. Operating business segments

      • 9.3.5. Product portfolio

      • 9.3.6. Key strategic moves and developments

    • 9.4. Fountaine Pajot

      • 9.4.1. Company overview

      • 9.4.2. Key Executives

      • 9.4.3. Company snapshot

      • 9.4.4. Operating business segments

      • 9.4.5. Product portfolio

      • 9.4.6. Key strategic moves and developments

    • 9.5. CATANAGROUP

      • 9.5.1. Company overview

      • 9.5.2. Key Executives

      • 9.5.3. Company snapshot

      • 9.5.4. Operating business segments

      • 9.5.5. Product portfolio

      • 9.5.6. Business performance

      • 9.5.7. Key strategic moves and developments

    • 9.6. Bavaria Yachtbau GmbH

      • 9.6.1. Company overview

      • 9.6.2. Key Executives

      • 9.6.3. Company snapshot

      • 9.6.4. Operating business segments

      • 9.6.5. Product portfolio

      • 9.6.6. Key strategic moves and developments

    • 9.7. Privilege Catamarans America

      • 9.7.1. Company overview

      • 9.7.2. Key Executives

      • 9.7.3. Company snapshot

      • 9.7.4. Operating business segments

      • 9.7.5. Product portfolio

    • 9.8. Kinetic Catamarans

      • 9.8.1. Company overview

      • 9.8.2. Key Executives

      • 9.8.3. Company snapshot

      • 9.8.4. Operating business segments

      • 9.8.5. Product portfolio

      • 9.8.6. Key strategic moves and developments

    • 9.9. Gemini Catamarans.

      • 9.9.1. Company overview

      • 9.9.2. Key Executives

      • 9.9.3. Company snapshot

      • 9.9.4. Operating business segments

      • 9.9.5. Product portfolio

    • 9.10. Seawind Group Holdings, Pty Ltd

      • 9.10.1. Company overview

      • 9.10.2. Key Executives

      • 9.10.3. Company snapshot

      • 9.10.4. Operating business segments

      • 9.10.5. Product portfolio

      • 9.10.6. Key strategic moves and developments

  • LIST OF TABLES

  • TABLE 01. GLOBAL CATAMARAN MARKET, BY PRODUCT TYPE, 2021-2031 ($MILLION)
    TABLE 02. CATAMARAN MARKET FOR SAILING CATAMARAN, BY REGION, 2021-2031 ($MILLION)
    TABLE 03. CATAMARAN MARKET FOR POWERED CATAMARAN, BY REGION, 2021-2031 ($MILLION)
    TABLE 04. GLOBAL CATAMARAN MARKET, BY SIZE, 2021-2031 ($MILLION)
    TABLE 05. CATAMARAN MARKET FOR BELOW 15M, BY REGION, 2021-2031 ($MILLION)
    TABLE 06. CATAMARAN MARKET FOR 16M-30M, BY REGION, 2021-2031 ($MILLION)
    TABLE 07. CATAMARAN MARKET FOR ABOVE 30M, BY REGION, 2021-2031 ($MILLION)
    TABLE 08. GLOBAL CATAMARAN MARKET, BY APPLICATION, 2021-2031 ($MILLION)
    TABLE 09. CATAMARAN MARKET FOR SPORTS, BY REGION, 2021-2031 ($MILLION)
    TABLE 10. CATAMARAN MARKET FOR LEISURE, BY REGION, 2021-2031 ($MILLION)
    TABLE 11. CATAMARAN MARKET FOR TRANSPORT, BY REGION, 2021-2031 ($MILLION)
    TABLE 12. CATAMARAN MARKET FOR OTHERS, BY REGION, 2021-2031 ($MILLION)
    TABLE 13. CATAMARAN MARKET, BY REGION, 2021-2031 ($MILLION)
    TABLE 14. NORTH AMERICA CATAMARAN MARKET, BY PRODUCT TYPE, 2021-2031 ($MILLION)
    TABLE 15. NORTH AMERICA CATAMARAN MARKET, BY SIZE, 2021-2031 ($MILLION)
    TABLE 16. NORTH AMERICA CATAMARAN MARKET, BY APPLICATION, 2021-2031 ($MILLION)
    TABLE 17. NORTH AMERICA CATAMARAN MARKET, BY COUNTRY, 2021-2031 ($MILLION)
    TABLE 18. U.S. CATAMARAN MARKET, BY PRODUCT TYPE, 2021-2031 ($MILLION)
    TABLE 19. U.S. CATAMARAN MARKET, BY SIZE, 2021-2031 ($MILLION)
    TABLE 20. U.S. CATAMARAN MARKET, BY APPLICATION, 2021-2031 ($MILLION)
    TABLE 21. CANADA CATAMARAN MARKET, BY PRODUCT TYPE, 2021-2031 ($MILLION)
    TABLE 22. CANADA CATAMARAN MARKET, BY SIZE, 2021-2031 ($MILLION)
    TABLE 23. CANADA CATAMARAN MARKET, BY APPLICATION, 2021-2031 ($MILLION)
    TABLE 24. MEXICO CATAMARAN MARKET, BY PRODUCT TYPE, 2021-2031 ($MILLION)
    TABLE 25. MEXICO CATAMARAN MARKET, BY SIZE, 2021-2031 ($MILLION)
    TABLE 26. MEXICO CATAMARAN MARKET, BY APPLICATION, 2021-2031 ($MILLION)
    TABLE 27. EUROPE CATAMARAN MARKET, BY PRODUCT TYPE, 2021-2031 ($MILLION)
    TABLE 28. EUROPE CATAMARAN MARKET, BY SIZE, 2021-2031 ($MILLION)
    TABLE 29. EUROPE CATAMARAN MARKET, BY APPLICATION, 2021-2031 ($MILLION)
    TABLE 30. EUROPE CATAMARAN MARKET, BY COUNTRY, 2021-2031 ($MILLION)
    TABLE 31. FRANCE CATAMARAN MARKET, BY PRODUCT TYPE, 2021-2031 ($MILLION)
    TABLE 32. FRANCE CATAMARAN MARKET, BY SIZE, 2021-2031 ($MILLION)
    TABLE 33. FRANCE CATAMARAN MARKET, BY APPLICATION, 2021-2031 ($MILLION)
    TABLE 34. ITALY CATAMARAN MARKET, BY PRODUCT TYPE, 2021-2031 ($MILLION)
    TABLE 35. ITALY CATAMARAN MARKET, BY SIZE, 2021-2031 ($MILLION)
    TABLE 36. ITALY CATAMARAN MARKET, BY APPLICATION, 2021-2031 ($MILLION)
    TABLE 37. NETHERLANDS CATAMARAN MARKET, BY PRODUCT TYPE, 2021-2031 ($MILLION)
    TABLE 38. NETHERLANDS CATAMARAN MARKET, BY SIZE, 2021-2031 ($MILLION)
    TABLE 39. NETHERLANDS CATAMARAN MARKET, BY APPLICATION, 2021-2031 ($MILLION)
    TABLE 40. GERMANY CATAMARAN MARKET, BY PRODUCT TYPE, 2021-2031 ($MILLION)
    TABLE 41. GERMANY CATAMARAN MARKET, BY SIZE, 2021-2031 ($MILLION)
    TABLE 42. GERMANY CATAMARAN MARKET, BY APPLICATION, 2021-2031 ($MILLION)
    TABLE 43. REST OF EUROPE CATAMARAN MARKET, BY PRODUCT TYPE, 2021-2031 ($MILLION)
    TABLE 44. REST OF EUROPE CATAMARAN MARKET, BY SIZE, 2021-2031 ($MILLION)
    TABLE 45. REST OF EUROPE CATAMARAN MARKET, BY APPLICATION, 2021-2031 ($MILLION)
    TABLE 46. ASIA-PACIFIC CATAMARAN MARKET, BY PRODUCT TYPE, 2021-2031 ($MILLION)
    TABLE 47. ASIA-PACIFIC CATAMARAN MARKET, BY SIZE, 2021-2031 ($MILLION)
    TABLE 48. ASIA-PACIFIC CATAMARAN MARKET, BY APPLICATION, 2021-2031 ($MILLION)
    TABLE 49. ASIA-PACIFIC CATAMARAN MARKET, BY COUNTRY, 2021-2031 ($MILLION)
    TABLE 50. CHINA CATAMARAN MARKET, BY PRODUCT TYPE, 2021-2031 ($MILLION)
    TABLE 51. CHINA CATAMARAN MARKET, BY SIZE, 2021-2031 ($MILLION)
    TABLE 52. CHINA CATAMARAN MARKET, BY APPLICATION, 2021-2031 ($MILLION)
    TABLE 53. AUSTRALIA CATAMARAN MARKET, BY PRODUCT TYPE, 2021-2031 ($MILLION)
    TABLE 54. AUSTRALIA CATAMARAN MARKET, BY SIZE, 2021-2031 ($MILLION)
    TABLE 55. AUSTRALIA CATAMARAN MARKET, BY APPLICATION, 2021-2031 ($MILLION)
    TABLE 56. SINGAPORE CATAMARAN MARKET, BY PRODUCT TYPE, 2021-2031 ($MILLION)
    TABLE 57. SINGAPORE CATAMARAN MARKET, BY SIZE, 2021-2031 ($MILLION)
    TABLE 58. SINGAPORE CATAMARAN MARKET, BY APPLICATION, 2021-2031 ($MILLION)
    TABLE 59. JAPAN CATAMARAN MARKET, BY PRODUCT TYPE, 2021-2031 ($MILLION)
    TABLE 60. JAPAN CATAMARAN MARKET, BY SIZE, 2021-2031 ($MILLION)
    TABLE 61. JAPAN CATAMARAN MARKET, BY APPLICATION, 2021-2031 ($MILLION)
    TABLE 62. REST OF ASIA-PACIFIC CATAMARAN MARKET, BY PRODUCT TYPE, 2021-2031 ($MILLION)
    TABLE 63. REST OF ASIA-PACIFIC CATAMARAN MARKET, BY SIZE, 2021-2031 ($MILLION)
    TABLE 64. REST OF ASIA-PACIFIC CATAMARAN MARKET, BY APPLICATION, 2021-2031 ($MILLION)
    TABLE 65. LAMEA CATAMARAN MARKET, BY PRODUCT TYPE, 2021-2031 ($MILLION)
    TABLE 66. LAMEA CATAMARAN MARKET, BY SIZE, 2021-2031 ($MILLION)
    TABLE 67. LAMEA CATAMARAN MARKET, BY APPLICATION, 2021-2031 ($MILLION)
    TABLE 68. LAMEA CATAMARAN MARKET, BY COUNTRY, 2021-2031 ($MILLION)
    TABLE 69. LATIN AMERICA CATAMARAN MARKET, BY PRODUCT TYPE, 2021-2031 ($MILLION)
    TABLE 70. LATIN AMERICA CATAMARAN MARKET, BY SIZE, 2021-2031 ($MILLION)
    TABLE 71. LATIN AMERICA CATAMARAN MARKET, BY APPLICATION, 2021-2031 ($MILLION)
    TABLE 72. MIDDLE EAST CATAMARAN MARKET, BY PRODUCT TYPE, 2021-2031 ($MILLION)
    TABLE 73. MIDDLE EAST CATAMARAN MARKET, BY SIZE, 2021-2031 ($MILLION)
    TABLE 74. MIDDLE EAST CATAMARAN MARKET, BY APPLICATION, 2021-2031 ($MILLION)
    TABLE 75. AFRICA CATAMARAN MARKET, BY PRODUCT TYPE, 2021-2031 ($MILLION)
    TABLE 76. AFRICA CATAMARAN MARKET, BY SIZE, 2021-2031 ($MILLION)
    TABLE 77. AFRICA CATAMARAN MARKET, BY APPLICATION, 2021-2031 ($MILLION)
    TABLE 78. TRAVELOPIA: KEY EXECUTIVES
    TABLE 79. TRAVELOPIA: COMPANY SNAPSHOT
    TABLE 80. TRAVELOPIA: PRODUCT SEGMENTS
    TABLE 81. TRAVELOPIA: PRODUCT PORTFOLIO
    TABLE 82. GRAND LARGE YACHTING GROUP: KEY EXECUTIVES
    TABLE 83. GRAND LARGE YACHTING GROUP: COMPANY SNAPSHOT
    TABLE 84. GRAND LARGE YACHTING GROUP: PRODUCT SEGMENTS
    TABLE 85. GRAND LARGE YACHTING GROUP: PRODUCT PORTFOLIO
    TABLE 86. GRAND LARGE YACHTING GROUP: KEY STRATERGIES
    TABLE 87. LAGOON CATAMARANS: KEY EXECUTIVES
    TABLE 88. LAGOON CATAMARANS: COMPANY SNAPSHOT
    TABLE 89. LAGOON CATAMARANS: PRODUCT SEGMENTS
    TABLE 90. LAGOON CATAMARANS: PRODUCT PORTFOLIO
    TABLE 91. LAGOON CATAMARANS: KEY STRATERGIES
    TABLE 92. FOUNTAINE PAJOT: KEY EXECUTIVES
    TABLE 93. FOUNTAINE PAJOT: COMPANY SNAPSHOT
    TABLE 94. FOUNTAINE PAJOT: PRODUCT SEGMENTS
    TABLE 95. FOUNTAINE PAJOT: PRODUCT PORTFOLIO
    TABLE 96. FOUNTAINE PAJOT: KEY STRATERGIES
    TABLE 97. CATANAGROUP: KEY EXECUTIVES
    TABLE 98. CATANAGROUP: COMPANY SNAPSHOT
    TABLE 99. CATANAGROUP: PRODUCT SEGMENTS
    TABLE 100. CATANAGROUP: PRODUCT PORTFOLIO
    TABLE 101. CATANAGROUP: KEY STRATERGIES
    TABLE 102. BAVARIA YACHTBAU GMBH: KEY EXECUTIVES
    TABLE 103. BAVARIA YACHTBAU GMBH: COMPANY SNAPSHOT
    TABLE 104. BAVARIA YACHTBAU GMBH: PRODUCT SEGMENTS
    TABLE 105. BAVARIA YACHTBAU GMBH: PRODUCT PORTFOLIO
    TABLE 106. BAVARIA YACHTBAU GMBH: KEY STRATERGIES
    TABLE 107. PRIVILEGE CATAMARANS AMERICA: KEY EXECUTIVES
    TABLE 108. PRIVILEGE CATAMARANS AMERICA: COMPANY SNAPSHOT
    TABLE 109. PRIVILEGE CATAMARANS AMERICA: PRODUCT SEGMENTS
    TABLE 110. PRIVILEGE CATAMARANS AMERICA: PRODUCT PORTFOLIO
    TABLE 111. KINETIC CATAMARANS: KEY EXECUTIVES
    TABLE 112. KINETIC CATAMARANS: COMPANY SNAPSHOT
    TABLE 113. KINETIC CATAMARANS: PRODUCT SEGMENTS
    TABLE 114. KINETIC CATAMARANS: PRODUCT PORTFOLIO
    TABLE 115. KINETIC CATAMARANS: KEY STRATERGIES
    TABLE 116. GEMINI CATAMARANS.: KEY EXECUTIVES
    TABLE 117. GEMINI CATAMARANS.: COMPANY SNAPSHOT
    TABLE 118. GEMINI CATAMARANS.: PRODUCT SEGMENTS
    TABLE 119. GEMINI CATAMARANS.: PRODUCT PORTFOLIO
    TABLE 120. SEAWIND GROUP HOLDINGS, PTY LTD: KEY EXECUTIVES
    TABLE 121. SEAWIND GROUP HOLDINGS, PTY LTD: COMPANY SNAPSHOT
    TABLE 122. SEAWIND GROUP HOLDINGS, PTY LTD: PRODUCT SEGMENTS
    TABLE 123. SEAWIND GROUP HOLDINGS, PTY LTD: PRODUCT PORTFOLIO
    TABLE 124. SEAWIND GROUP HOLDINGS, PTY LTD: KEY STRATERGIES
  • LIST OF FIGURES

  • FIGURE 01. CATAMARAN MARKET, 2021-2031
    FIGURE 02. SEGMENTATION OF CATAMARAN MARKET, 2021-2031
    FIGURE 03. TOP INVESTMENT POCKETS IN CATAMARAN MARKET (2022-2031)
    FIGURE 04. MODERATE-TO-HIGH BARGAINING POWER OF SUPPLIERS
    FIGURE 05. LOW-TO-MODERATE BARGAINING POWER OF BUYERS
    FIGURE 06. MODERATE-TO-HIGH THREAT OF SUBSTITUTES
    FIGURE 07. MODERATE-TO-HIGH THREAT OF NEW ENTRANTS
    FIGURE 08. MODERATE-TO-HIGH INTENSITY OF RIVALRY
    FIGURE 09. DRIVERS, RESTRAINTS AND OPPORTUNITIES: GLOBALCATAMARAN MARKET
    FIGURE 10. CATAMARAN MARKET, BY PRODUCT TYPE, 2021(%)
    FIGURE 11. COMPARATIVE SHARE ANALYSIS OF CATAMARAN MARKET FOR SAILING CATAMARAN, BY COUNTRY 2021-2031(%)
    FIGURE 12. COMPARATIVE SHARE ANALYSIS OF CATAMARAN MARKET FOR POWERED CATAMARAN, BY COUNTRY 2021-2031(%)
    FIGURE 13. CATAMARAN MARKET, BY SIZE, 2021(%)
    FIGURE 14. COMPARATIVE SHARE ANALYSIS OF CATAMARAN MARKET FOR BELOW 15M, BY COUNTRY 2021-2031(%)
    FIGURE 15. COMPARATIVE SHARE ANALYSIS OF CATAMARAN MARKET FOR 16M-30M, BY COUNTRY 2021-2031(%)
    FIGURE 16. COMPARATIVE SHARE ANALYSIS OF CATAMARAN MARKET FOR ABOVE 30M, BY COUNTRY 2021-2031(%)
    FIGURE 17. CATAMARAN MARKET, BY APPLICATION, 2021(%)
    FIGURE 18. COMPARATIVE SHARE ANALYSIS OF CATAMARAN MARKET FOR SPORTS, BY COUNTRY 2021-2031(%)
    FIGURE 19. COMPARATIVE SHARE ANALYSIS OF CATAMARAN MARKET FOR LEISURE, BY COUNTRY 2021-2031(%)
    FIGURE 20. COMPARATIVE SHARE ANALYSIS OF CATAMARAN MARKET FOR TRANSPORT, BY COUNTRY 2021-2031(%)
    FIGURE 21. COMPARATIVE SHARE ANALYSIS OF CATAMARAN MARKET FOR OTHERS, BY COUNTRY 2021-2031(%)
    FIGURE 22. CATAMARAN MARKET BY REGION, 2021
    FIGURE 23. U.S. CATAMARAN MARKET, 2021-2031 ($MILLION)
    FIGURE 24. CANADA CATAMARAN MARKET, 2021-2031 ($MILLION)
    FIGURE 25. MEXICO CATAMARAN MARKET, 2021-2031 ($MILLION)
    FIGURE 26. FRANCE CATAMARAN MARKET, 2021-2031 ($MILLION)
    FIGURE 27. ITALY CATAMARAN MARKET, 2021-2031 ($MILLION)
    FIGURE 28. NETHERLANDS CATAMARAN MARKET, 2021-2031 ($MILLION)
    FIGURE 29. GERMANY CATAMARAN MARKET, 2021-2031 ($MILLION)
    FIGURE 30. REST OF EUROPE CATAMARAN MARKET, 2021-2031 ($MILLION)
    FIGURE 31. CHINA CATAMARAN MARKET, 2021-2031 ($MILLION)
    FIGURE 32. AUSTRALIA CATAMARAN MARKET, 2021-2031 ($MILLION)
    FIGURE 33. SINGAPORE CATAMARAN MARKET, 2021-2031 ($MILLION)
    FIGURE 34. JAPAN CATAMARAN MARKET, 2021-2031 ($MILLION)
    FIGURE 35. REST OF ASIA-PACIFIC CATAMARAN MARKET, 2021-2031 ($MILLION)
    FIGURE 36. LATIN AMERICA CATAMARAN MARKET, 2021-2031 ($MILLION)
    FIGURE 37. MIDDLE EAST CATAMARAN MARKET, 2021-2031 ($MILLION)
    FIGURE 38. AFRICA CATAMARAN MARKET, 2021-2031 ($MILLION)
    FIGURE 39. TOP WINNING STRATEGIES, BY YEAR
    FIGURE 40. TOP WINNING STRATEGIES, BY DEVELOPMENT
    FIGURE 41. TOP WINNING STRATEGIES, BY COMPANY
    FIGURE 42. PRODUCT MAPPING OF TOP 10 PLAYERS
    FIGURE 43. COMPETITIVE DASHBOARD
    FIGURE 44. COMPETITIVE HEATMAP: CATAMARAN MARKET
    FIGURE 45. TOP PLAYER POSITIONING, 2021
    FIGURE 46. CATANAGROUP: NET REVENUE, 2019-2021 ($MILLION)
    FIGURE 47. CATANAGROUP: REVENUE SHARE BY REGION, 2021 (%)
    FIGURE 48. CATANAGROUP: REVENUE SHARE BY SEGMENT, 2021 (%)


The catamaran market is growing rapidly as a result of a number of factors such as the advantages of catamarans over monohull boats and the rise in demand for leisure & recreational activities. However, other considerations, such as high initial costs and environmental concerns, limit the market expansion. On the other hand, factors such as rise in consumer demand for eco-friendly boats and technical improvements offer significant opportunities for the market to propel during the forecast period.

According to the US Coast Guard, there were 4,291 recreational boating accidents in 2020, resulting in 767 deaths and 3,191 injuries. Of those accidents, 56 involved catamarans. While catamarans are generally considered safer than monohull boats, it is important for catamaran drivers to follow safe boating practices, such as wearing life jackets and avoiding alcohol while driving. Catamarans are used in various industries, including commercial fishing, transportation, and search & rescue. For example, the US Navy uses catamarans for mine countermeasures and coastal patrol. Advances in technology have led to the development of innovative catamaran designs, such as hydro foiling catamarans that use underwater wings to lift the boat out of the water and reduce drag. Catamaran tour is a popular activity in many coastal destinations, providing visitors with the opportunity to explore the ocean, spot marine life, and enjoy the scenery.

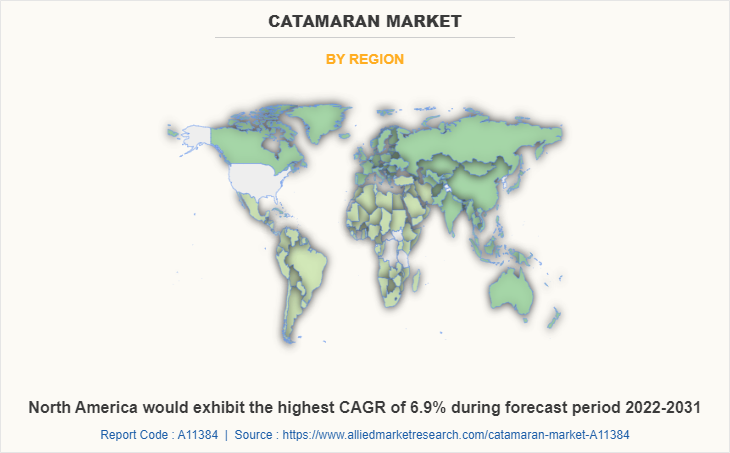
Among the analyzed regions, Europe is the highest revenue contributor, followed by Asia-Pacific, North America, and LAMEA. While North America is expected to lead during the forecast period due to growth in technological advancements and the rise in adoption of catamarans in countries such as U.S., Canada, and Mexico.

PURCHASE OPTIONS

Call or Email us

U.S.-Canada Toll-free: +1-800-792-5285
Int'l : +1-503-894-6022
Europe : +44-845-528-1300
Email : help@alliedmarketresearch.com
 
FREQUENTLY ASKED QUESTIONS?

A. The Catamaran Market was valued for $1,583.80 million in 2021 and is estimated to reach $2,704.05 million by 2031.

A. The leading players operating in the catamaran market are Leopard Catamarans, Outremer catamarans, Beneteau/Lagoon, Fountaine Pajot, Catana Catamarans, Nautitech Catamaran, Privilege Catamarans, Antares Catamarans, Gemini Catamarans, and Seawind Cats.

A. Leisure is the leading application of the catamaran market.

A. Europe is the largest regional market for catamaran.

A. Rising water sports activities and increasing spending on leisure vacation activities are the upcoming trends of catamarans market.

Looking for Customization?

 Customization Request

Have a Question?

 Speak with Analyst

Any Confusion?

 Inquire Before Buying

Have a glance of the Report

  Request Sample
RELATED TAGS

Purchase Full Report of
Catamaran Market

Start reading instantly.
This Report and over 68,113+ more Reports, Available with Avenue Library. T&C*.

  • Online Only
  • $3,570
  • Online cloud access only
  • Restricted print, copy, paste & download
  • Read only
  • Free industry update
    (Within 180 days)
  • Free report update in next update cycle
    (Feb 2024 - Feb 2025)
  • Data Pack
  • $3,840
  • Restricted to one authorized user
  • One print only
  • Available in
    Excel
  • Free industry update
    (Within 180 days)
  •   Free report update in next update cycle
    (Feb 2024 - Feb 2025)
  • Single User
  • $5,730
  • Restricted to one authorized user
  • One print only
  • Available in
    PDF
  • Free industry update
    (Within 180 days)
  •   Free report update in next update cycle
    (Feb 2024 - Feb 2025)
  • Five Users
  • $6,450
  • Limited to five authorized users
  • Print upto five copies
  • Available in
    PDF
  • Free industry update
    (Within 180 days)
  •   Free report update in next update cycle
    (Feb 2024 - Feb 2025)
  • Enterprise
    License/PDF

  • $9,600
  • Unlimited
    within
    company/enterprise
  • Available in Excel & PDF
  • Free industry update
    (Within 180 days)
  •   Free report update in next update cycle
    (Feb 2024 - Feb 2025)
  • Library
    Membership

  • $999 $ 1,175
    Per User/ Per month/ Billed annually
  • Published Content
    E-access
  • Company Profiles
    E-access
  • Newly Added Content Access
  • 10 PDF
    Downloads
  • 5 Excel Data
    Pack Downloads
  • 250 Company Profiles PDF Downloads
  • Buy Now

*Taxes/Fees, if applicable will be added during checkout. All prices in USD

RELATED REPORTS
 

Why Allied Market Research?


Infallible Methodology

To ensure high-level data integrity, accurate analysis, and impeccable forecasts

Analyst Support

For complete satisfaction

Customization

On-demand customization of scope of the report to exactly meet your needs

TARGETED MARKET VIEW

Targeted market view to provide pertinent information and save time of readers

Get fresh content delivered

Get insights on topics that are crucial for your business. Stay abreast of your interest areas.

Get Industry Data Alerts

Why Allied Market Research?

Infallible Methodology

To ensure high-level data integrity, accurate analysis, and impeccable forecasts

Analyst Support

For complete satisfaction

Customization

On-demand customization of scope of the report to exactly meet your needs

TARGETED MARKET VIEW

Targeted market view to provide pertinent information and save time of readers