CBD Skin Care Market by Product Type (Oils, Lotion & Creams, Masks & Serums, Bath & Soaps, and Others), Source (Hemp and Marijuana), and Distribution Channel (Departmental Stores, E-Commerce, Hypermarkets/Supermarkets, Retail Pharmacies, and Others): Global Opportunity Analysis and Industry Forecast, 2019–2026 Update Available On-Demand
A05926 | Pages: 263 | Jan 2020 | 7394 Views | | |
Author(s) : Shankar Bhandalkar , Roshan Deshmukh | Tables: 116 | Charts: 51 | Formats*: | |
COVID-19
Pandemic disrupted the entire world and affected many industries.
Get detailed COVID-19 impact analysis on the Cbd Skin Care Market
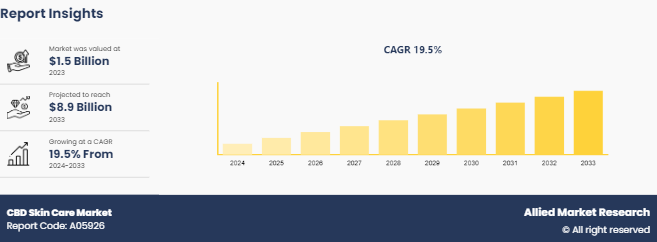
Request Now !The global CBD skin care market size was valued at $633.6 million in 2018 and is anticipated to reach $3,484.00 million by 2026, with a CAGR of 24.80% during the forecast period. The CBD skin care market exhibits an incremental revenue opportunity of $2,747.4 million from 2019 to 2026. CBD (known as cannabidiol) is the non-intoxicating compound extracted from marijuana or hemp plants. CBD is extracted in the form of powder, and is usually mixed with an various types of oils including olive, coconut, or hemp oil, to increase the effectiveness of CBD in varied applications. CBD oil based products are comprised of various types of properties including, anti-inflammatory, antioxidant, and skin soothing. The presence of such outstanding properties in one single blend make CBD oil as one of the key components in skin care and personal care products.
Holistic benefits of CBD infused skin care products are in spotlight after the legalization of marijuana and cannabis based cosmetics. CBD infused skin product is gaining popularity among consumers due to its calming properties. It has a potential to relive common skin issue through its anti-inflammatory, anti-oxidant properties. CBD-based skin care product also offers various benefits such as improved sleep and also helps in the treatment of various skin conditions such as eczema and psoriasis, as well as acne. The unique benefits associated with CBD based skin care has been capitalized by cosmetic companies. These companies are promoting CBD infused skin care products as “natural cosmetic” in the market. The multi-functional attributes of these products is expected to propel the demand for CBD skin care products.
Get more information on this report : Request Sample Pages
CBD oils are largely used as an active aromatherapy ingredient by sleep specialists. The calming properties of CBD oil are responsible for improved sleep among patient suffering from OSA. Moreover, the CBD oil infused products are largely used for the treatment of acne and psoriasis due to its anti-inflammatory properties. The presence of multi-functional benefits in CBD infused skin product is expected to fuel the revenue growth of the overall CBD skin care market forecast period.
Personal care industry is witnessing a shift toward CBD infused skin care products. According to California-based Hemp Industries Association (HIA), there were $147 million worth of hemp-based personal care products sold in the U.S. market in 2015. Majority of these personal care products were imported from the neighboring country, Canada. The sale of American-produced hemp-based personal care products has been increased double fold owing to acceptance of multi-channel distribution by wholesales, private labelers, and other importers. These stakeholders are developing a separate product line of CBD infused personal care products. This product line comprises skin care, hand care, and lip moisturizer products. Companies are primarily marketing their products for health benefits associated with CBD in skin care products. The innovative positioning of CBD infused skin care products coupled with effective distribution strategies are expected to boost the CBD Skin Care market growth during the forecast period.
CBD Skin Care Market
By Product Type
Oil segment dominates the global market and is expected to retain its dominance throughout the forecast period.
Get more information on this report : Request Sample Pages
CBD based skin care products are largely regulated by authorities due to its THC content. Many developed countries does not clear guidelines on the use of CBD oil in personal care industry, which has resulted in limited sales of these products. Countries, such as Australia, Germany, and France have strict regulation on use of CBD in skin care products. These regulatory impositions from government authorities impedes the growth of CBD skin care product in the developed regions. The wellness hemp and medical cannabis nascent industry is witnessing a constant pressure from regulatory bodies despite their significant benefits. Such existence of regulatory pressure is expected to limit CBD skin care market share during the forecast period.
CBD Skin Care Market
By Form
Hemp segment dominates the global market and is expected to retain its dominance throughout the forecast period.
Get more information on this report : Request Sample Pages
The CBD skin care market segmentation is categorized on the basis of product type, source, distribution channel, and region. By product type, CBD skin care market is categorized into oils, lotion and creams, masks and serums, bath and soaps and others. By form, it is bifurcated into hemp and marijuana. By distribution channel, it is classified into departmental stores, e-commerce, hypermarkets/supermarkets, retail pharmacies, and others. Region-wise, it is analyzed across North America (the U.S., Canada, and Mexico), Europe (Germany, France, Spain, Italy, and Rest of Europe), Asia-Pacific (China, India, Japan, Australia, South Korea, and Rest of Asia-Pacific), and LAMEA (the Middle East, Latin America, and Africa).
CBD Skin Care Market
By Distribution Channel
Departmental Stores segment is expected to grow at a highest CAGR of 23.5% during the forecast period.
Get more information on this report : Request Sample Pages
The CBD skin care market size is analyzed across North America, Europe, Asia-Pacific, and LAMEA. The North America and Europe regions have strong revenue opportunity in the market. These regions offer lucrative growth opportunity for new entrants as well as established manufacturers owing to increased spending on personal care and cosmetic products and rise in incidences of skin diseases such as psoriasis, and acne. Moreover, favorable regulations and close monitoring of CBD based skin care product manufacturing is promoting the revenue growth CBD infused skin care products in these regions. The liberalization of hemp and marijuana cultivation in Canada is expected to play an important role in the growth of CBD based personal care products. In addition, the continuous efforts in terms of R&D from leading cosmetic companies are expected to boost the growth of product innovations in the CBD Skin Care market analysis.
CBD Skin Care Market
By Region
North America dominates the market and is expected to grow with a CAGR of 24.3% during the forecast period
Get more information on this report : Request Sample Pages
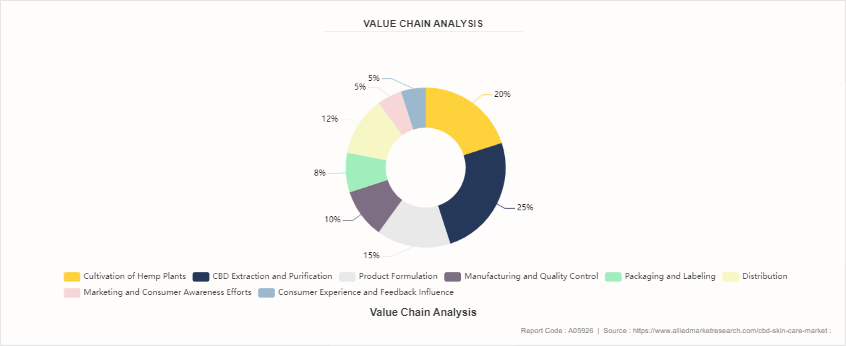
The key players operating in the global CBD Skin Care industry include Kiehl’s LLC, Cannuka LLC, Leef Organics, Medical Marijuana Inc., Lord Jones, Kapu Maku LLC, VERTLYBALM, Elixinol Global Limited, Fab CBD Company, and Endoca LLC. Other CBD Skin Care market players identified in the value chain are L’Oreal, Varm Cosmo, L’Eela, Apothecanna, Charlotte’s Web Holdings, Kana Skincare, Josie Maran Cosmetics, Cronos Group, CBD Biotech, and Estee Lauder.
Key Benefits for Stakeholders:
- The report provides detailed qualitative and quantitative analysis of the current CBD Skin Care market trends and future estimations that help evaluate the share and the CBD Skin Care market opportunity.
- The key drivers, restraints, opportunities, and detailed market analysis are elucidated in the study.
- The market analysis is conducted by following key product positioning and monitoring the top competitors within the industry.
- The report provides extensive qualitative insights on the potential and niche segments or regions exhibiting favorable market growth.
- Industry player positioning segment facilitates benchmarking and provides a clear understanding of the present position of players in CBD skin care market
Key Market Segments:
By Product Type
- Oils
- Lotion & Creams
- Masks & Serums
- Bath & Soaps
- Others
By Source
- Hemp
- Marijuana
By Distribution Channel
- Departmental Stores
- E-commerce
- Hypermarkets/Supermarkets
- Retail Pharmacies
- Others
By Region
- North America
- U.S.
- Canada
- Mexico
- Asia-Pacific
- China
- India
- Japan
- Australia
- South Korea
- Rest of Asia-Pacific
- Europe
- Germany
- France
- UK
- Spain
- Italy
- Rest of Europe
- LAMEA
- Middle East
- Latin America
- Africa
Key Players in Value Chain
- Kiehl’s LLC
- Cannuka LLC
- Leef Organics
- Medical Marijuana Inc.
- Lord Jones
- Kapu Maku LLC
- VERTLYBALM
- Elixinol Global Limited
- Fab CBD Company
- Endoca LLC.
- L’Oreal
- Varm Cosmo
- L’Eela
- Apothecanna
- Charlotte’s Web Holdings
- Kana Skincare
- Josie Maran Cosmetics
- Cronos Group
- CBD Biotech
- Estee Lauder
CHAPTER 1: INTRODUCTION
1.1. Report Description
1.2. Research methodology
1.2.1. Secondary research
1.2.2. Primary research
1.2.3. Analyst tools and models
CHAPTER 2: EXECUTIVE SUMMARY
2.1. CXO perspective
CHAPTER 3: MARKET OVERVIEW
3.1. Market definition and scope
3.2. Parent Market Overview: Natural Cosmetics Market (2018)
3.3. Key findings
3.3.1. Top investment pockets
3.4. Value chain analysis
3.5. Porter’s five forces analysis
3.5.1. High Bargaining Power of Suppliers
3.5.2. Low Bargaining Power of Buyers
3.5.3. Moderate Threat of Substitution
3.5.4. High Threat of New Entrants
3.5.5. High Intensity of Competitive Rivalry
3.6. Market dynamics
3.6.1. Drivers
3.6.1.1. Incredible skin healing potential
3.6.1.2. Increase preference towards sustainable skin care products
3.6.1.3. Growing awareness and acceptance of cannabis
3.6.2. Restraints
3.6.2.1. High probabilities of product contamination
3.6.2.2. Regulatory imposition on product manufacturing and marketing
3.6.3. Opportunities
3.6.3.1. Growth in revenue through online sales channels
CHAPTER 4: CBD SKIN CARE MARKET, BY PRODUCT TYPE
4.1. Overview
4.1.1. Market size and forecast
4.2. Oils
4.2.1. Key market trends, growth factors and opportunities
4.2.2. Market size and forecast
4.3. Lotion and Creams
4.3.1. Key market trends, growth factors and opportunities
4.3.2. Market size and forecast
4.4. Masks and Serums
4.4.1. Key market trends, growth factors and opportunities
4.4.2. Market size and forecast
4.5. Bath and Soaps
4.5.1. Key market trends, growth factors and opportunities
4.5.2. Market size and forecast
4.6. Others
4.6.1. Key market trends, growth factors and opportunities
4.6.2. Market size and forecast
CHAPTER 5: CBD SKIN CARE MARKET, BY SOURCE
5.1. Overview
5.1.1. Market size and forecast
5.2. Hemp
5.2.1. Key market trends, growth factors and opportunities
5.2.2. Market size and forecast
5.3. Marijuana
5.3.1. Key market trends, growth factors and opportunities
5.3.2. Market size and forecast
CHAPTER 6: CBD SKIN CARE MARKET, BY DISTRIBUTION CHANNEL
6.1. Overview
6.1.1. Market size and forecast
6.2. Departmental stores
6.2.1. Key market trends, growth factors and opportunities
6.2.2. Market size and forecast
6.3. E-Commerce
6.3.1. Key market trends, growth factors and opportunities
6.3.2. Market size and forecast
6.4. Hypermarkets/Supermarkets
6.4.1. Key market trends, growth factors and opportunities
6.4.2. Market size and forecast
6.5. Retail Pharmacies
6.5.1. Key market trends, growth factors and opportunities
6.5.2. Market size and forecast
6.6. others
6.6.1. Key market trends, growth factors and opportunities
6.6.2. Market size and forecast
CHAPTER 7: CBD SKIN CARE MARKET BY REGION
7.1. Overview
7.1.1. Market size and forecast, by region
7.2. North America
7.2.1. Key market trends, growth factors and opportunities
7.2.2. Market size and forecast, by Product Type
7.2.3. Market size and forecast, by Source
7.2.4. Market size and forecast, by Distribution Channel
7.2.5. Market size and forecast, by country
7.2.5.1. U.S.
7.2.5.1.1. Market size and forecast by Product Type
7.2.5.1.2. Market size and forecast by Form
7.2.5.1.3. Market size and forecast by Distribution Channel
7.2.5.2. Canada
7.2.5.2.1. Market size and forecast by Product Type
7.2.5.2.2. Market size and forecast by Form
7.2.5.2.3. Market size and forecast by Distribution Channel
7.2.5.3. Mexico
7.2.5.3.1. Market size and forecast by Product Type
7.2.5.3.2. Market size and forecast by Form
7.2.5.3.3. Market size and forecast by Distribution Channel
7.3. Europe
7.3.1. Key market trends, growth factors and opportunities
7.3.2. Market size and forecast, by Product Type
7.3.3. Market size and forecast, by Source
7.3.4. Market size and forecast, by Distribution Channel
7.3.5. Market size and forecast, by country
7.3.5.1. Germany
7.3.5.1.1. Market size and forecast by Product Type
7.3.5.1.2. Market size and forecast by Form
7.3.5.1.3. Market size and forecast by Distribution Channel
7.3.5.2. UK
7.3.5.2.1. Market size and forecast by Product Type
7.3.5.2.2. Market size and forecast by Form
7.3.5.2.3. Market size and forecast by Distribution Channel
7.3.5.3. France
7.3.5.3.1. Market size and forecast by Product Type
7.3.5.3.2. Market size and forecast by Form
7.3.5.3.3. Market size and forecast by Distribution Channel
7.3.5.4. Italy
7.3.5.4.1. Market size and forecast by Product Type
7.3.5.4.2. Market size and forecast by Form
7.3.5.4.3. Market size and forecast by Distribution Channel
7.3.5.5. Spain
7.3.5.5.1. Market size and forecast by Product Type
7.3.5.5.2. Market size and forecast by Form
7.3.5.5.3. Market size and forecast by Distribution Channel
7.3.5.6. Rest of Europe
7.3.5.6.1. Market size and forecast by Product Type
7.3.5.6.2. Market size and forecast by Form
7.3.5.6.3. Market size and forecast by Distribution Channel
7.4. Asia-Pacific
7.4.1. Key market trends, growth factors and opportunities
7.4.2. Market size and forecast, by Product Type
7.4.3. Market size and forecast, by Source
7.4.4. Market size and forecast, by Distribution Channel
7.4.5. Market size and forecast, by country
7.4.5.1. China
7.4.5.1.1. Market size and forecast by Product Type
7.4.5.1.2. Market size and forecast by Form
7.4.5.1.3. Market size and forecast by Distribution Channel
7.4.5.2. India
7.4.5.2.1. Market size and forecast by Product Type
7.4.5.2.2. Market size and forecast by Form
7.4.5.2.3. Market size and forecast by Distribution Channel
7.4.5.3. Japan
7.4.5.3.1. Market size and forecast by Product Type
7.4.5.3.2. Market size and forecast by Form
7.4.5.3.3. Market size and forecast by Distribution Channel
7.4.5.4. Australia
7.4.5.4.1. Market size and forecast by Product Type
7.4.5.4.2. Market size and forecast by Form
7.4.5.4.3. Market size and forecast by Distribution Channel
7.4.5.5. South Korea
7.4.5.5.1. Market size and forecast by Product Type
7.4.5.5.2. Market size and forecast by Form
7.4.5.5.3. Market size and forecast by Distribution Channel
7.4.5.6. Rest of APAC
7.4.5.6.1. Market size and forecast by Product Type
7.4.5.6.2. Market size and forecast by Form
7.4.5.6.3. Market size and forecast by Distribution Channel
7.5. LAMEA
7.5.1. Key market trends, growth factors and opportunities
7.5.2. Market size and forecast, by Product Type
7.5.3. Market size and forecast, by Source
7.5.4. Market size and forecast, by Distribution Channel
7.5.5. Market size and forecast, by country
7.5.5.1. Latin America
7.5.5.1.1. Market size and forecast by Product Type
7.5.5.1.2. Market size and forecast by Form
7.5.5.1.3. Market size and forecast by Distribution Channel
7.5.5.2. Middle East
7.5.5.2.1. Market size and forecast by Product Type
7.5.5.2.2. Market size and forecast by Form
7.5.5.2.3. Market size and forecast by Distribution Channel
7.5.5.3. Africa
7.5.5.3.1. Market size and forecast by Product Type
7.5.5.3.2. Market size and forecast by Form
7.5.5.3.3. Market size and forecast by Distribution Channel
CHAPTER 8: COMPETITION LANDSCAPE
8.1. Market Player Positioning
8.2. Product Mapping
8.3. Competitive Dashboard
8.4. Competitive Heatmap
8.5. Key developments
8.5.1. Product launch
8.5.2. Partnership
CHAPTER 9: COMPANY PROFILES
9.1. Cannuka, LLC
9.1.1. Company overview
9.1.2. Key Executives
9.1.3. Company snapshot
9.1.4. Product portfolio
9.2. The Elixinol Group
9.2.1. Company overview
9.2.2. Key Executives
9.2.3. Company snapshot
9.2.4. Operating business segments
9.2.5. Product portfolio
9.2.6. Business performance
9.2.7. Key strategic moves and developments
9.3. Endoca BV
9.3.1. Company overview
9.3.2. Key Executive
9.3.3. Company snapshot
9.3.4. Product portfolio
9.3.5. Key strategic moves and developments
9.4. FAB CBD
9.4.1. Company overview
9.4.2. Company snapshot
9.4.3. Product portfolio
9.5. Kapu Maku LLC
9.5.1. Company overview
9.5.2. Company snapshot
9.5.3. Product portfolio
9.6. KIEHL'S LLC (L'ORÉAL)
9.6.1. Company overview
9.6.1. Key Executives
9.6.2. Company snapshot
9.6.3. Operating business segments
9.6.4. Product portfolio
9.6.5. Business performance
9.7. LEEF ORGANICS LTD
9.7.1. Company overview
9.7.2. Company snapshot
9.7.3. Product portfolio
9.8. Lord Jones
9.8.1. Company overview
9.8.2. Company snapshot
9.8.3. Product portfolio
9.9. Medical Marijuana, Inc.
9.9.1. Company overview
9.9.2. Key Executives
9.9.3. Company snapshot
9.9.4. Product portfolio
9.9.5. Business performance
9.10. VERTLYBALM
9.10.1. Company overview
9.10.2. Company snapshot
9.10.3. Product portfolio
LIST OF TABLES
TABLE 01. GLOBAL CBD SKIN CARE MARKET REVENUE, BY PRODUCT TYPE, 2018–2026 ($MILLION)
TABLE 02. GLOBAL CBD SKIN CARE OILS MARKET REVENUE, BY REGION, 2018–2026 ($MILLION)
TABLE 03. GLOBAL CBD SKIN CARE LOTION AND CREAMS MARKET REVENUE, BY REGION, 2018–2026 ($MILLION)
TABLE 04. GLOBAL CBD SKIN CARE MASKS AND SERUMS MARKET REVENUE, BY REGION, 2018–2026 ($MILLION)
TABLE 05. GLOBAL CBD SKIN CARE BATH AND SOAPS MARKET REVENUE, BY REGION, 2018–2026 ($MILLION)
TABLE 06. GLOBAL OTHERS CBD SKIN CARE MARKET REVENUE, BY REGION, 2018–2026 ($MILLION)
TABLE 07. GLOBAL CBD SKIN CARE MARKET REVENUE, BY SOURCE, 2018–2026 ($MILLION)
TABLE 08. GLOBAL HEMP CBD SKIN CARE MARKET REVENUE, BY REGION, 2018–2026 ($MILLION)
TABLE 09. GLOBAL MARIJUANA CBD SKIN CARE MARKET REVENUE, BY REGION, 2018–2026 ($MILLION)
TABLE 10. GLOBAL CBD SKIN CARE MARKET REVENUE, BY DISTRIBUTION CHANNEL 2018–2026 ($MILLION)
TABLE 11. GLOBAL CBD SKIN CARE MARKET REVENUE FOR DEPARTMENTAL STORES, BY REGION, 2018–2026 ($MILLION)
TABLE 12. GLOBAL CBD SKIN CARE MARKET REVENUE FOR E-COMMERCE, BY REGION, 2018–2026 ($MILLION)
TABLE 13. GLOBAL CBD SKIN CARE MARKET REVENUE FOR HYPERMARKETS/SUPERMARKETS, BY REGION, 2018–2026 ($MILLION)
TABLE 14. GLOBAL CBD SKIN CARE MARKET REVENUE FOR RETAIL PHARMACIES, BY REGION, 2018–2026 ($MILLION)
TABLE 15. GLOBAL CBD SKIN CARE MARKET REVENUE FOR OTHERS, BY REGION, 2018–2026 ($MILLION)
TABLE 16. GLOBAL CBD SKIN CARE MARKET REVENUE, BY REGION, 2018–2026 ($MILLION)
TABLE 17. NORTH AMERICA CBD SKIN CARE MARKET REVENUE, BY PRODUCT TYPE, 2018–2026 ($MILLION)
TABLE 18. NORTH AMERICA CBD SKIN CARE MARKET REVENUE, BY SOURCE, 2018–2026 ($MILLION)
TABLE 19. NORTH AMERICA CBD SKIN CARE MARKET REVENUE, BY DISTRIBUTION CHANNEL, 2018–2026 ($MILLION)
TABLE 20. NORTH AMERICA CBD SKIN CARE MARKET REVENUE, BY COUNTRY, 2018–2026 ($MILLION)
TABLE 21. U.S. CBD SKIN CARE MARKET REVENUE, BY PRODUCT TYPE, 2018–2026 ($MILLION)
TABLE 22. U.S. CBD SKIN CARE MARKET REVENUE, BY FORM, 2018–2026 ($MILLION)
TABLE 23. U.S. CBD SKIN CARE MARKET REVENUE, BY DISTRIBUTION CHANNEL, 2018–2026 ($MILLION)
TABLE 24. CANADA CBD SKIN CARE MARKET REVENUE, BY PRODUCT TYPE, 2018–2026 ($MILLION)
TABLE 25. CANADA CBD SKIN CARE MARKET REVENUE, BY FORM, 2018–2026 ($MILLION)
TABLE 26. CANADA CBD SKIN CARE MARKET REVENUE, BY DISTRIBUTION CHANNEL, 2018–2026 ($MILLION)
TABLE 27. MEXICO CBD SKIN CARE MARKET REVENUE, BY PRODUCT TYPE, 2018–2026 ($MILLION)
TABLE 28. MEXICO CBD SKIN CARE MARKET REVENUE, BY FORM, 2018–2026 ($MILLION)
TABLE 29. MEXICO CBD SKIN CARE MARKET REVENUE, BY DISTRIBUTION CHANNEL, 2018–2026 ($MILLION)
TABLE 30. EUROPE CBD SKIN CARE MARKET REVENUE, BY PRODUCT TYPE, 2018–2026 ($MILLION)
TABLE 31. EUROPE CBD SKIN CARE MARKET REVENUE, BY SOURCE, 2018–2026 ($MILLION)
TABLE 32. EUROPE CBD SKIN CARE MARKET REVENUE, BY DISTRIBUTION CHANNEL, 2018–2026 ($MILLION)
TABLE 33. EUROPE CBD SKIN CARE MARKET REVENUE, BY COUNTRY, 2018–2026 ($MILLION)
TABLE 34. GERMANY CBD SKIN CARE MARKET REVENUE, BY PRODUCT TYPE, 2018–2026 ($MILLION)
TABLE 35. GERMANY CBD SKIN CARE MARKET REVENUE, BY FORM, 2018–2026 ($MILLION)
TABLE 36. GERMANY CBD SKIN CARE MARKET REVENUE, BY DISTRIBUTION CHANNEL, 2018–2026 ($MILLION)
TABLE 37. UK CBD SKIN CARE MARKET REVENUE, BY PRODUCT TYPE, 2018–2026 ($MILLION)
TABLE 38. UK CBD SKIN CARE MARKET REVENUE, BY FORM, 2018–2026 ($MILLION)
TABLE 39. UK CBD SKIN CARE MARKET REVENUE, BY DISTRIBUTION CHANNEL, 2018–2026 ($MILLION)
TABLE 40. FRANCE CBD SKIN CARE MARKET REVENUE, BY PRODUCT TYPE, 2018–2026 ($MILLION)
TABLE 41. FRANCE CBD SKIN CARE MARKET REVENUE, BY FORM, 2018–2026 ($MILLION)
TABLE 42. FRANCE CBD SKIN CARE MARKET REVENUE, BY DISTRIBUTION CHANNEL, 2018–2026 ($MILLION)
TABLE 43. ITALY CBD SKIN CARE MARKET REVENUE, BY PRODUCT TYPE, 2018–2026 ($MILLION)
TABLE 44. ITALY CBD SKIN CARE MARKET REVENUE, BY FORM, 2018–2026 ($MILLION)
TABLE 45. ITALY CBD SKIN CARE MARKET REVENUE, BY DISTRIBUTION CHANNEL, 2018–2026 ($MILLION)
TABLE 46. SPAIN CBD SKIN CARE MARKET REVENUE, BY PRODUCT TYPE, 2018–2026 ($MILLION)
TABLE 47. SPAIN CBD SKIN CARE MARKET REVENUE, BY FORM, 2018–2026 ($MILLION)
TABLE 48. SPAIN CBD SKIN CARE MARKET REVENUE, BY DISTRIBUTION CHANNEL, 2018–2026 ($MILLION)
TABLE 49. REST OF EUROPE CBD SKIN CARE MARKET REVENUE, BY PRODUCT TYPE, 2018–2026 ($MILLION)
TABLE 50. REST OF EUROPE CBD SKIN CARE MARKET REVENUE, BY FORM, 2018–2026 ($MILLION)
TABLE 51. REST OF EUROPE CBD SKIN CARE MARKET REVENUE, BY DISTRIBUTION CHANNEL, 2018–2026 ($MILLION)
TABLE 52. ASIA-PACIFIC CBD SKIN CARE MARKET REVENUE, BY PRODUCT TYPE, 2018–2026 ($MILLION)
TABLE 53. ASIA-PACIFIC CBD SKIN CARE MARKET REVENUE, BY SOURCE, 2018–2026 ($MILLION)
TABLE 54. ASIA-PACIFIC CBD SKIN CARE MARKET REVENUE, BY DISTRIBUTION CHANNEL, 2018–2026 ($MILLION)
TABLE 55. ASIA-PACIFIC CBD SKIN CARE MARKET REVENUE, BY COUNTRY, 2018–2026 ($MILLION)
TABLE 56. CHINA CBD SKIN CARE MARKET REVENUE, BY PRODUCT TYPE, 2018–2026 ($MILLION)
TABLE 57. CHINA CBD SKIN CARE MARKET REVENUE, BY FORM, 2018–2026 ($MILLION)
TABLE 58. CHINA CBD SKIN CARE MARKET REVENUE, BY DISTRIBUTION CHANNEL, 2018–2026 ($MILLION)
TABLE 59. INDIA CBD SKIN CARE MARKET REVENUE, BY PRODUCT TYPE, 2018–2026 ($MILLION)
TABLE 60. INDIA CBD SKIN CARE MARKET REVENUE, BY FORM, 2018–2026 ($MILLION)
TABLE 61. INDIA CBD SKIN CARE MARKET REVENUE, BY DISTRIBUTION CHANNEL, 2018–2026 ($MILLION)
TABLE 62. JAPAN CBD SKIN CARE MARKET REVENUE, BY PRODUCT TYPE, 2018–2026 ($MILLION)
TABLE 63. JAPAN CBD SKIN CARE MARKET REVENUE, BY FORM, 2018–2026 ($MILLION)
TABLE 64. JAPAN CBD SKIN CARE MARKET REVENUE, BY DISTRIBUTION CHANNEL, 2018–2026 ($MILLION)
TABLE 65. AUSTRALIA CBD SKIN CARE MARKET REVENUE, BY PRODUCT TYPE, 2018–2026 ($MILLION)
TABLE 66. AUSTRALIA CBD SKIN CARE MARKET REVENUE, BY FORM, 2018–2026 ($MILLION)
TABLE 67. AUSTRALIA CBD SKIN CARE MARKET REVENUE, BY DISTRIBUTION CHANNEL, 2018–2026 ($MILLION)
TABLE 68. SOUTH KOREA CBD SKIN CARE MARKET REVENUE, BY PRODUCT TYPE, 2018–2026 ($MILLION)
TABLE 69. SOUTH KOREA CBD SKIN CARE MARKET REVENUE, BY FORM, 2018–2026 ($MILLION)
TABLE 70. SOUTH KOREA CBD SKIN CARE MARKET REVENUE, BY DISTRIBUTION CHANNEL, 2018–2026 ($MILLION)
TABLE 71. REST OF APAC CBD SKIN CARE MARKET REVENUE, BY PRODUCT TYPE, 2018–2026 ($MILLION)
TABLE 72. REST OF APAC CBD SKIN CARE MARKET REVENUE, BY FORM, 2018–2026 ($MILLION)
TABLE 73. REST OF APAC CBD SKIN CARE MARKET REVENUE, BY DISTRIBUTION CHANNEL, 2018–2026 ($MILLION)
TABLE 74. LAMEA CBD SKIN CARE MARKET REVENUE, BY PRODUCT TYPE, 2018–2026 ($MILLION)
TABLE 75. LAMEA CBD SKIN CARE MARKET REVENUE, BY SOURCE, 2018–2026 ($MILLION)
TABLE 76. LAMEA CBD SKIN CARE MARKET REVENUE, BY DISTRIBUTION CHANNEL, 2018–2026 ($MILLION)
TABLE 77. LAMEA CBD SKIN CARE MARKET REVENUE, BY COUNTRY, 2018–2026 ($MILLION)
TABLE 78. LATIN AMERICA CBD SKIN CARE MARKET REVENUE, BY PRODUCT TYPE, 2018–2026 ($MILLION)
TABLE 79. LATIN AMERICA CBD SKIN CARE MARKET REVENUE, BY FORM, 2018–2026 ($MILLION)
TABLE 80. LATIN AMERICA CBD SKIN CARE MARKET REVENUE, BY DISTRIBUTION CHANNEL, 2018–2026 ($MILLION)
TABLE 81. MIDDLE EAST CBD SKIN CARE MARKET REVENUE, BY PRODUCT TYPE, 2018–2026 ($MILLION)
TABLE 82. MIDDLE EAST CBD SKIN CARE MARKET REVENUE, BY FORM, 2018–2026 ($MILLION)
TABLE 83. MIDDLE EAST CBD SKIN CARE MARKET REVENUE, BY DISTRIBUTION CHANNEL, 2018–2026 ($MILLION)
TABLE 84. AFRICA CBD SKIN CARE MARKET REVENUE, BY PRODUCT TYPE, 2018–2026 ($MILLION)
TABLE 85. AFRICA CBD SKIN CARE MARKET REVENUE, BY FORM, 2018–2026 ($MILLION)
TABLE 86. AFRICA CBD SKIN CARE MARKET REVENUE, BY DISTRIBUTION CHANNEL, 2018–2026 ($MILLION)
TABLE 87. CANNUKA, LLC: KEY EXECUTIVES
TABLE 88. CANNUKA, LLC: COMPANY SNAPSHOT
TABLE 89. CANNUKA, LLC: PRODUCT PORTFOLIO
TABLE 90. THE ELIXINOL GROUP: KEY EXECUTIVES
TABLE 91. THE ELIXINOL GROUP: COMPANY SNAPSHOT
TABLE 92. THE ELIXINOL GROUP: OPERATING SEGMENTS
TABLE 93. THE ELIXINOL GROUP: PRODUCT PORTFOLIO
TABLE 94. THE ELIXINOL GROUP: NET SALES, 2016–2018 ($MILLION)
TABLE 95. ENDOCA BV: KEY EXECUTIVE
TABLE 96. ENDOCA BV: COMPANY SNAPSHOT
TABLE 97. ENDOCA BV: PRODUCT PORTFOLIO
TABLE 98. FAB CBD: COMPANY SNAPSHOT
TABLE 99. FAB CBD: PRODUCT PORTFOLIO
TABLE 100. KAPU MAKU LLC: COMPANY SNAPSHOT
TABLE 101. KAPU MAKU LLC: PRODUCT PORTFOLIO
TABLE 102. KIEHL'S LLC (L'ORÉAL): KEY EXECUTIVES
TABLE 103. KIEHL’S LLC (L’ORÉAL): COMPANY SNAPSHOT
TABLE 104. KIEHL'S LLC (L'ORÉAL): OPERATING SEGMENTS
TABLE 105. KIEHL’S LLC (L’ORÉAL): PRODUCT PORTFOLIO
TABLE 106. KIEHL'S LLC (L'ORÉAL): NET SALES, 2016–2018 ($MILLION)
TABLE 107. LEEF ORGANICS LTD: COMPANY SNAPSHOT
TABLE 108. LEEF ORGANICS LTD: PRODUCT PORTFOLIO
TABLE 109. LORD JONES: COMPANY SNAPSHOT
TABLE 110. LORD JONES: PRODUCT PORTFOLIO
TABLE 111. MEDICAL MARIJUANA, INC.: KEY EXECUTIVES
TABLE 112. MEDICAL MARIJUANA, INC.: COMPANY SNAPSHOT
TABLE 113. MEDICAL MARIJUANA, INC.: PRODUCT PORTFOLIO
TABLE 114. MEDICAL MARIJUANA, INC.: NET SALES, 2016–2018 ($MILLION)
TABLE 115. VERTLYBALM: COMPANY SNAPSHOT
TABLE 116. VERTLYBALM: PRODUCT PORTFOLIO
LIST OF FIGURES
FIGURE 01. CBD SKIN CARE MARKET SNAPSHOT
FIGURE 02. CBD SKIN CARE MARKET: SEGMENTATION
FIGURE 03. PARENT MARKET OVERVIEW: NATURAL COSMETICS MARKET (2018)
FIGURE 04. TOP INVESTMENT POCKETS
FIGURE 05. VALUE CHAIN ANALYSIS
FIGURE 06. CBD SKIN CARE MARKET: PORTER’S FIVE FORCES MODEL
FIGURE 07. CBD SKIN CARE MARKET: DRIVERS, RESTRAINTS, AND OPPORTUNITIES
FIGURE 08. CBD SKIN CARE MARKET, BY PRODUCT TYPE, 2019 (%)
FIGURE 09. COMPARATIVE SHARE ANALYSIS OF GLOBAL CBD SKIN CARE OILS MARKET, BY COUNTRY 2018 & 2026 (%)
FIGURE 10. COMPARATIVE SHARE ANALYSIS OF GLOBAL CBD SKIN CARE LOTION AND CREAMS MARKET, BY COUNTRY 2018 & 2026 (%)
FIGURE 11. COMPARATIVE SHARE ANALYSIS OF GLOBAL CBD SKIN CARE MASKS AND SERUMS MARKET, BY COUNTRY 2018 & 2026 (%)
FIGURE 12. COMPARATIVE SHARE ANALYSIS OF GLOBAL CBD SKIN CARE BATH AND SOAPS MARKET, BY COUNTRY 2018 & 2026 (%)
FIGURE 13. COMPARATIVE SHARE ANALYSIS OF GLOBAL OTHERS CBD SKIN CARE MARKET, BY COUNTRY 2018 & 2026 (%)
FIGURE 14. CBD SKIN CARE MARKET, BY SOURCE, 2019 (%)
FIGURE 15. COMPARATIVE SHARE ANALYSIS OF GLOBAL HEMP CBD SKIN CARE MARKET, BY COUNTRY 2018 & 2026 (%)
FIGURE 16. COMPARATIVE SHARE ANALYSIS OF GLOBAL MARIJUANA CBD SKIN CARE MARKET, BY COUNTRY 2018 & 2026 (%)
FIGURE 17. GLOBAL CBD SKIN CARE MARKET, BY DISTRIBUTION CHANNEL, 2019 (%)
FIGURE 18. COMPARATIVE SHARE ANALYSIS OF GLOBAL CBD SKIN CARE MARKET FOR DEPARTMENTAL STORES, BY COUNTRY 2018 & 2026 (%)
FIGURE 19. COMPARATIVE SHARE ANALYSIS OF GLOBAL CBD SKIN CARE MARKET FOR E-COMMERCE, BY COUNTRY 2018 & 2026 (%)
FIGURE 20. COMPARATIVE SHARE ANALYSIS OF GLOBAL CBD SKIN CARE MARKET FOR HYPERMARKETS/SUPERMARKETS, BY COUNTRY 2018 & 2026 (%)
FIGURE 21. COMPARATIVE SHARE ANALYSIS OF GLOBAL CBD SKIN CARE MARKET FOR RETAIL PHARMACIES, BY COUNTRY 2018 & 2026 (%)
FIGURE 22. COMPARATIVE SHARE ANALYSIS OF GLOBAL CBD SKIN CARE MARKET FOR OTHERS, BY COUNTRY 2018 & 2026 (%)
FIGURE 23. CBD SKIN CARE MARKET, BY REGION, 2019 (%)
FIGURE 24. U.S. CBD SKIN CARE MARKET REVENUE, 2018–2026 ($MILLION)
FIGURE 25. CANADA CBD SKIN CARE MARKET REVENUE, 2018–2026 ($MILLION)
FIGURE 26. MEXICO CBD SKIN CARE MARKET REVENUE, 2018–2026 ($MILLION)
FIGURE 27. GERMANY CBD SKIN CARE MARKET REVENUE, 2018–2026 ($MILLION)
FIGURE 28. UK CBD SKIN CARE MARKET REVENUE, 2018–2026 ($MILLION)
FIGURE 29. FRANCE CBD SKIN CARE MARKET REVENUE, 2018–2026 ($MILLION)
FIGURE 30. FRANCE CBD SKIN CARE MARKET REVENUE, 2018–2026 ($MILLION)
FIGURE 31. SPAIN CBD SKIN CARE MARKET REVENUE, 2018–2026 ($MILLION)
FIGURE 32. REST OF EUROPE CBD SKIN CARE MARKET REVENUE, 2018–2026 ($MILLION)
FIGURE 33. CHINA CBD SKIN CARE MARKET REVENUE, 2018–2026 ($MILLION)
FIGURE 34. INDIA CBD SKIN CARE MARKET REVENUE, 2018–2026 ($MILLION)
FIGURE 35. JAPAN CBD SKIN CARE MARKET REVENUE, 2018–2026 ($MILLION)
FIGURE 36. AUSTRALIA CBD SKIN CARE MARKET REVENUE, 2018–2026 ($MILLION)
FIGURE 37. SOUTH KOREA CBD SKIN CARE MARKET REVENUE, 2018–2026 ($MILLION)
FIGURE 38. REST OF APAC CBD SKIN CARE MARKET REVENUE, 2018–2026 ($MILLION)
FIGURE 39. LATIN AMERICA CBD SKIN CARE MARKET REVENUE, 2018–2026 ($MILLION)
FIGURE 40. MIDDLE EAST CBD SKIN CARE MARKET REVENUE, 2018–2026 ($MILLION)
FIGURE 41. AFRICA CBD SKIN CARE MARKET REVENUE, 2018–2026 ($MILLION)
FIGURE 42. CBD SKINCARE MARKET, MARKET PLAYER POSITIONING 2018
FIGURE 43. PRODUCT MAPPING OF TOP 10 KEY PLAYERS
FIGURE 44. COMPETITIVE DASHBOARD OF TOP 10 KEY PLAYERS
FIGURE 45. COMPETITIVE HEATMAP OF TOP 10 KEY PLAYERS
FIGURE 46. THE ELIXINOL GROUP: NET SALES, 2016–2018 ($MILLION)
FIGURE 47. THE ELIXINOL GROUP: REVENUE SHARE BY SEGMENT, 2018 (%)
FIGURE 48. KIEHL'S LLC (L'ORÉAL): NET SALES, 2016–2018 ($MILLION)
FIGURE 49. KIEHL'S LLC (L'ORÉAL): REVENUE SHARE BY SEGMENT, 2018 (%)
FIGURE 50. KIEHL'S LLC (L'ORÉAL): REVENUE SHARE BY REGION, 2018 (%)
FIGURE 51. MEDICAL MARIJUANA, INC.: NET SALES, 2016–2018 ($MILLION)
Stringent government regulations and compliances are expected to boost the growth of CBD oil in personal care applications. Close monitoring on hemp and marijuana cultivations for cosmetic products from regulatory authorities is playing an important role in increasing the overall production of CBD based skin care products. Many organizations and authorities have implemented certain regulations on the use of CBD oil in cosmetic products. For example, European Union provided some details on the use of CBD oil under cosmetics regulation CE 1223/2009. This regulatory prohibits the use of narcotics in cosmetic products. This regulation considers cannabis, cannabis resin, extracts, and tinctures as narcotics and excluded seed and leaves. Hence, cannabidiol, for cosmetic product, can only be derived from seeds or leaves not accompanied by the tops.
The market is strongly regulated by government authorities. The scope and usage of cannabidiol varies from country to country. In Canada, cannabis sativa seed oil is authorized with an amount of THC of 10 μg/g. The close watch from these regulatory bodies enforce the production process to follow set GMP during manufacturing. As a result, the manufacturers are focusing on setting up new production facilities for their CBD product portfolio. These companies are innovatively promoting their product offering through various channel strategies and are mainly focusing on e-commerce platforms. These stakeholders are anticipated to witness significant growth in CBD skin care products owing to the outstanding benefits and “natural” content.
Q1. What is the total market value of global CBD Skin Care Market?
A. The global CBD skin care was valued at $633.6 million in 2018.
Q2. How much will the global CBD Skin Care Market be worth in the future?
A. The global CBD skin care is projected to reach $3,484.0 million by 2026, registering a CAGR of 24.8% from 2019 to 2026.
Q3. Which region will provide more business opportunities for CBD Skin Care in coming years?
A. North America and Europe will provide more business opportunities for CBD Skin Care products in coming years. The US, EU5 countries would be largest consumer of CBD skin care product in future.
Q4. Who are the key players in CBD Skin Care?
A. The key players in CBD skin care market are Kiehl’s LLC, Cannuka LLC, Leef Organics, Medical Marijuana Inc., Lord Jones, Kapu Maku LLC, VERTLYBALM, Elixinol Global Limited, Fab CBD Company, and Endoca LLC
Q5. Which is the leading segment in the CBD Skin Care?
A. Oils, lotion and cream are the leading segments in the CBD skin care market. CBD oil has anti-inflammatory benefits which makes CBD a suitable ingredient for acne-prone skin, while its calming benefits help reactive skin look and feel better. These benefits of CBD oils are making it a desirable product for skincare.
Q6. What will be CBD Skin Care Market growth in 2026?
A. The CBD Skin Care Market is projected to register a CAGR of 24.8% from 2019 to 2026.
Q7. What would be forecast period in the market report?
A. The forecast period in the CBD skin care market report is from 2019 to 2026.
Q8. Who are the active players in the CBD Skin Care Market?
A. The active players in the CBD skin care market are Kiehl’s LLC, Cannuka LLC, Leef Organics, Medical Marijuana Inc., Lord Jones, Kapu Maku LLC, VERTLYBALM, Elixinol Global Limited, Fab CBD Company, Endoca LLC, L’Oreal, Varm Cosmo, L’Eela, Apothecanna, Charlotte’s Web Holdings, Kana Skincare, Josie Maran Cosmetics, Cronos Group, CBD Biotech, Estee Lauder etc.
Q9. What are the CBD Skin Care Market trends?
A. CBD masks when applied topically helps in reducing the redness and inflammation and it also helps in improving skin conditions such as rosecea, rashes, irritation, and acne. CBD can also reduce oil production to balance the condition of the skin and can provide a mattifying effect.
Download Sample
Purchase Full Report of
CBD Skin Care Market
- Online Only
- $3,456
- Online cloud access only
- Restricted print, copy, paste & download
- Read only
- Free quarterly industry update
- Free report update (Within 180 days)
- Subscription model sign in
- Data Pack
- $3,840
- Restricted to one authorized user
- One print only
- Available in
Excel - Free quarterly industry update
- Free report update (Within 180 days)
- Subscription model sign in
- Single User
- $5,769
- Restricted to one authorized user
- One print only
- Available in Excel & PDF
- Free quarterly industry update
- Free report update (Within 180 days)
- Subscription model sign in
- Five Users
- $6,450
- Limited to five authorized users
- Print upto five copies
- Available in Excel & PDF
- Free quarterly industry update
- Free report update (Within 180 days)
- Subscription model sign in
-
Enterprise
License/PDF - $8,995
- Unlimited
within
company/enterprise - Available in Excel & PDF
- Free quarterly industry update
- Free report update (Within 180 days)
- Subscription model sign in
- Library Membership
- $ 699/mo
- Published Content
E-access - Company Profiles
E-access - Newly Added Content Access
- 10 PDF
Downloads - 5 Excel Data
Pack Downloads - 250 Company Profiles PDF Downloads
-
Start reading instantly.
Buy Now
This title and over 12,000+ are available on the Avenue Library. T&C*.
*Taxes/Fees, if applicable will be added during checkout. All prices in USD
Why Allied Market Research?
Infallible Methodology
To ensure high-level data integrity, accurate analysis, and impeccable forecasts
Analyst Support
For complete satisfaction
Customization
On-demand customization of scope of the report to exactly meet your needs
TARGETED MARKET VIEW
Targeted market view to provide pertinent information and save time of readers
Featured Reports
Get fresh content delivered
Get insights on topics that are crucial for your business. Stay abreast of your interest areas.
Why Allied Market Research?
Infallible Methodology
To ensure high-level data integrity, accurate analysis, and impeccable forecasts
Analyst Support
For complete satisfaction
Customization
On-demand customization of scope of the report to exactly meet your needs
TARGETED MARKET VIEW
Targeted market view to provide pertinent information and save time of readers