0
New
New
2023
Skin Care Products Market

Skin Care Products Market

by Type (Face Cream, Body Lotion, Face Wash, Others), by End User (Women, Men), by Price Point (Mass, Premium), by Distribution Channel (Supermarkets and Hypermarkets, Specialty stores, Online Channels, Others): Global Opportunity Analysis and Industry Forecast, 2022-2031

Report Code: A01515
Apr 2023 | Pages: 300
Tables: 182
Charts: 87
  • Formats*:

  • pdf

    Single User License, Five User
    License & Enterprise User License

  • xls

    Data Pack Excel License

  • ppt

    It comes with the additional cost
    of $2500.00 contact sales.


Skin Care Products Market Research, 2031

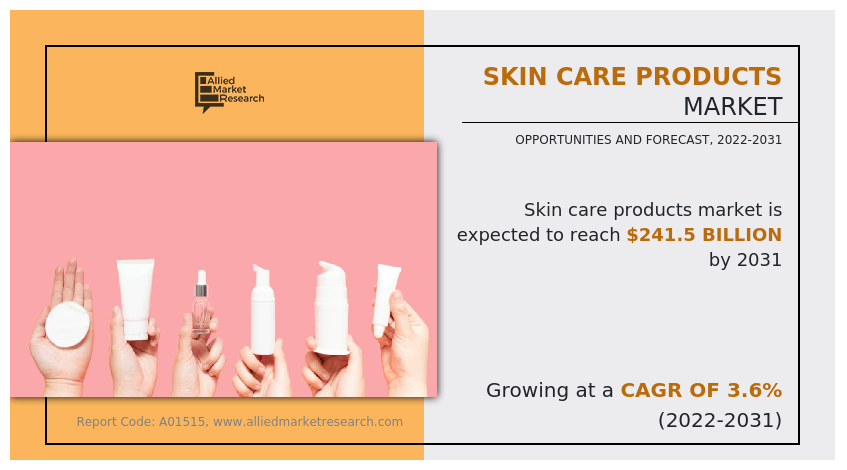
The global skin care products market was valued at $170.7 billion in 2021, and is projected to reach $241.5 billion by 2031, growing at a CAGR of 3.6% from 2022 to 2031.

Increase in demand for dermatological skin care items among beauty-conscious consumers worldwide, combined with increasingly effective product formulas employed by skin care product makers, are driving the market's growth. Furthermore, the usage of natural, nature derived, and organic raw materials for creation of skin care products spanning various price points to appeal to people of all economic positions would help the market grow enormously.

Face creams, body lotions, face washes, and other skin care items are available in the skin care products market. Skin care products are specialized items that are used to cure damaged skin and to give the skin a natural beauty and radiance. These products assist in moisturizing dry skin, removing excess oil from oily skin, and promote the overall health and wellness of the skin. As these products are designed to perform various functions, it is critical to utilize diverse skin care solutions for different purposes. 

Cosmetics have evolved into a vital component of the contemporary individual's lifestyle. As a result of modern standards of personal appearance and etiquette, a surge in consciousness of exterior beauty has turned into one of the primary driving forces in favour of using skin care items, driving the skin care products market demand. Global population growth, in addition to increasing per capita income, has increased the demand for skin care products. Consumers all over the world are changing their lifestyles as a result of rapid economic progress and an increase in disposable income. Customers are getting more worried about their skin as they are becoming more aware of the need of skin care and hygiene, and as a result, they are buying skin care products. Men, in addition to women, are increasing the use of skin care products in their everyday lives, moving the global skin care products market ahead. This change in lifestyle has led to the expansion of the global skin care and cosmetics businesses. As a result, changing lifestyle choices in emerging markets have aided the expansion of the global skin care products industry. 

Consumers of all ages use skin care products such as moisturizers, lotion, skin lightening cream, toner, serum, sunscreen, body lotion, and body oil, among many others, to avoid premature ageing, acne, and black patches and to enhance their beauty. Many individuals are gravitating towards skin care products to protect and maintain their skin from damage and imperfections caused by climate change. Furthermore, many customers are increasingly educating themselves to better grasp their distinct skin kinds and the specific needs of their skin, which also is contributing to a surge in the sale of skin care products that suit their skin types, helping to increase the skin care products market size. Younger customers are also increasing their need for skin care products in order to begin creating a good skin care regimen at a younger age, which is fuelling the expansion of the skin care products market. 

Raw material price increase has a significant impact on product manufacturing costs, resulting in an increase in the market price of the finished product. This is one of the key problems hindering the expansion of the global skin care products sector. Increased prices in skin care products will diminish demand in developing nations such as India and China, where clients are price sensitive. High costs are expected to result in a stronger effect on emerging economies than that on established ones that include the U.S. and the UK; nonetheless, cost conscious customers in such regions also will suffer as product prices rise. This puts a limit on the skin care products industry. Furthermore, advancements in skin care product packaging materials, including recycled plastics and cardboards, result in an extra increase in product price, in order to make up margins for skin care product makers. The rise in the cost of components and packaging materials has a detrimental impact on the skin care products market. 

Engaged players in the skin care products market are developing novel goods to capture the attention of consumers. To avoid sun damage to consumers' skin, innovative products including face creams and body lotions with greater Sun Protection Factor (SPF) in addition to skin cooling components such as aloe or coconut butter are being developed. Furthermore, in order to appeal to clients who seek cruelty-free skin care products, several companies are including natural and nature-derived ingredients in their product lines, with many of the substances being totally vegan. Numerous skin care product makers are also creating gender neutral cosmetics that are ideal for the skin of men, women, and non-binary consumers, which will help boost the skin care products market in the future. 

Skin Care Products Market

Segmental Overview

The skin care products market is segmented into End User, Price Point, Type and Distribution Channel. The skin care products market is segmented on the basis of type, end user, price point, distribution channel, and region. By type, the skin care products market is classified into face cream, body lotion, face wash, and others. Depending on end user, the market is categorized into women and men. By price point, the market is divided across mass and premium. According to the distribution channel used for the sale of skin care products the market is segmented into supermarkets and hypermarkets, specialty stores, online channels, and others. By region, the market is divided across North America (the U.S., Canada, and Mexico), Europe (UK, Germany, France, Italy, Spain, Netherlands, Rest of Europe), Asia-Pacific (China, Japan, India, South Korea, Australia, and rest of Asia-Pacific), and LAMEA (Brazil, Argentina, Saudi Arabia, United Arab Emirates, South Africa, and the Rest of LAMEA).   

Skin Care Products Market

By Type

Face creams are utilized to improve the appearance of the skin on the face. These creams are designed to replenish the skin's nutrition, erase dark spots, and give the skin a healthy glow. Face creams are designed to fit specific skin types to minimize issues because the skin on the face is thin, and a non-compatible cream may cause skin injury. Due to these reasons, face creams hold a significant skin care products market Share. Body lotion is a means to keep the skin moisturized. These lotions are designed to moisturize the thicker skin on the body and can be used all over the body beginning at the neck. Body lotions are oily, but they are generally suitable for oily skin types since they are readily absorbed by the body and may be used in little amounts. Face wash is generally used to cleanse the face and remove dirt and oil from the skin. Facial washes are commonly used to exfoliate dead skin cells and revitalize the skin, resulting in a glow and luminosity. Face washes are designed to suit both men's and women's skin types, as there is a significant difference in oil production and skin quality between the sexes. Serums, scrubs, packs, toners, and other skin care products are also available. As more people are becoming aware of the advantages and uses of these goods, their use has grown over the past several years. 

Skin Care Products Market

By End User

Women are more likely to use skincare products than men because they have a stronger desire to keep their skin healthy and youthful looking. Due to women's increased curiosity about various kinds of skin care products and their uses for improving skin health, the majority of items on the market are geared towards women. Women's skin care products come in a variety of smells, such as citrus, floral, herbal, vanilla, and other aromas of a like nature, all of which contribute to the pleasant scent of the product. Women are more likely to buy skin care items when the packaging for those goods is made to be visually pleasing. In general, men have thicker skin and wider pores than women. They thus generate significantly more sebum, which results in oilier skin. Men also naturally have drier skin than women do because of increased body hair development, although use of skin care products is lower in men since they have less concern about their skin's health. Men are adopting skin care regimens and products at a higher rate as a result of increased awareness of the value of skin care and effective skin care practices among males. Future skin care products market growth will also be aided by an increase in the production of skin care products tailored exclusively for the needs of male skin. 

Skin Care Products Market

By Price Point

Mass produced skin care products that are created in large quantities are used to hydrate the skin and give it a healthy glow. These products are generally accessible in convenient places like grocery stores, superstores, and online sellers. Mass-produced skin care items are frequently bought because of their regular use and many daily applications. The inherent characteristics of the skin on the applicant's body are enhanced by the use of high-end skin care products. Due to their long-lasting effects and ability to trap in hydration without leaving the skin appearing greasy or oily, these products are not used frequently during the day. They are primarily available in specialty shops, brand stores, and online channels due to their higher costs and slightly reduced availability. 

Skin Care Products Market

By Distribution Channel

The self-service shops known as supermarkets and hypermarkets offer a vast selection of products. Consumers are more able to associate a brand with a shopper when they can find skin care from a variety of brands and categories in one location. Due to their extensive inventory, exclusive deals, and wide range of products, the supermarkets and hypermarkets are significant sales channels in the international market. Retail facilities known as specialty stores offer a wide range of goods that belong to the same category. These specialty shops are well-versed in the different varieties and types of skin care products, which are frequently sold at exorbitant prices. Also, they offer premium, value-added items, which are often pricey. Virtual retailers that operate online sell products and services to customers. Online skin care product shopping is growing in popularity as a result of the internet's global use. Due to the convenience of online shopping, the availability of 24-hour customer support, and the wide variety of product possibilities, online retailers are growing in popularity among consumers. Skin care products are sold in brand stores, general stores, travel retail stores, and other establishments. These channels of skin care product sales are not as effective as offering a broader choice of products because of space and product limitations but they do help the market for skin care products grow, providing a positive outlook for the skin care products market forecast. 

Skin Care Products Market

By Region

North America is the second-largest region for skin care product use. It is a significant market for skin care goods because there are many high-end skin care and personal care companies there, and ordinary skin care products are widely available. With many prestigious luxury skin care companies in the region, Europe is the biggest consumer of skin care products in the world as well as one of the leading producers and users of both premium and affordable skin care products. Among the biggest producers and exporters of skin care goods are the UK, France, and Italy. In the Asia-Pacific area, skin care products are extensively used, and luxury skin care brand adoption is on the rise. By making skin care goods more accessible to customers in the area, local skin care businesses help to advance the market. Among the major users of skin care goods in LAMEA are Brazil, Saudi Arabia, and the United Arab Emirates. Customers have a wide range of options because of the region's abundance of local and foreign skin care product manufacturers. 

Competition Analysis

Some of the major players analyzed in this report are Estee Lauder Companies Inc., Johnson & Johnson, Kao Corporation, LOREAL S. A., LVMH, Procter & Gamble, Revlon, Inc., Shiseido Company, Limited, Unilever, and Weleda AG. The companies in the market adopted strategies such as mergers, product launches, partnerships, expansions, acquisitions, and others for maintaining a strong position in the market.

Examples of Mergers include:

  • Kao Corporation announced to merge two beauty counseling companies namely, Sofina Beauty Counseling Co., Ltd. and Kanebo Beauty Counseling Co., Ltd., to establish Kao Beauty Brands Counseling Co., Ltd., and strengthen brand communications and expand its customer base.

Examples of Product Launches include:

  • The Procter & Gamble Company, through its brand Gillette, launched its first dermaplaning skincare collection. This new collection includes a cleansing primer, dermaplaning razor and hydrating serum.
  • Shiseido Company, Limited through its brand Sidekick, launched two new moisturizers namely, hybrid tone-on moisturizer and hybrid essence-in-gel.

Examples of Partnerships include:

  • Kao Corporation partnered with Mitsui & Co., Ltd., in order to expand the skin care business in Brazil.

Examples of Expansions include:

  • Shiseido Company, Limited established Osaka Ibaraki factory and West Japan distribution center in Ibaraki City, Osaka as a supply chain base for the production and distribution of prestige skincare products.

Key Benefits For Stakeholders

  • This report provides a quantitative analysis of the market segments, current trends, estimations, and dynamics of the skin care products market analysis from 2021 to 2031 to identify the prevailing skin care products market opportunities.
  • The market research is offered along with information related to key drivers, restraints, and opportunities.
  • Porter's five forces analysis highlights the potency of buyers and suppliers to enable stakeholders make profit-oriented business decisions and strengthen their supplier-buyer network.
  • In-depth analysis of the skin care products market segmentation assists to determine the prevailing market opportunities.
  • Major countries in each region are mapped according to their revenue contribution to the global market.
  • Market player positioning facilitates benchmarking and provides a clear understanding of the present position of the market players.
  • The report includes the analysis of the regional as well as global skin care products market trends, key players, market segments, application areas, and market growth strategies.

Skin Care Products Market Report Highlights

Aspects Details
Market Size By 2031 USD 241.5 billion
Growth Rate CAGR of 3.6%
Forecast period 2021 - 2031
Report Pages 300
By Type
  • Face Cream
    • Sub Type
      • Skin Brightening Cream
      • Anti Aging Cream
      • Sun Protection Cream
  • Body Lotion
  • Face Wash
  • Others
By End User
  • Women
  • Men
By Price Point
  • Mass
  • Premium
By Distribution Channel
  • Online Channels
  • Others
  • Supermarkets and Hypermarkets
  • Specialty stores
By Region
  • North America  (U.S., Canada, Mexico)
  • Europe  (UK, Germany, France, Italy, Spain, Netherlands, Rest of Europe)
  • Asia-Pacific  (China, Japan, India, South Korea, Australia, Rest of Asia-Pacific)
  • LAMEA  (Brazil, Argentina, Saudi Arabia, United Arab Emirates, South Africa, Rest of LAMEA)
Key Market Players Weleda AG, Unilever PLC, Revlon, Inc., The Estee Lauder Companies Inc., Kao Corporation, The Procter & Gamble Company, LOREAL S. A., Johnson & Johnson, LVMH, Shiseido Company, Limited

Analyst Review

According to the CXOs of several leading companies, Skin care products make up some of the most widely used and common cosmetics and personal care items in the world. Most people across the world use skin care products on a regular basis to either renew or eradicate skin damage caused by the sun, pollution, dust, and a variety of other factors. The large range of products and companies available in the skin care products market provides consumers with multiple options, which aids in market expansion. 

Economical skin care products have grown to be the most popular type of skin care products, particularly among middle- and lower-income consumers, due to their ease of availability and inexpensive prices. Furthermore, since these products tend to be most extensively used, the majority of the key manufacturers of skin care products appeal to the economic category. Nonetheless, as the global standard of living improves, there is a growing consumer appetite for premium products. Several brands are attempting to develop premium variations of their economic goods with the goal to strengthen consumer connections and make the shift from economic to premium products with ease with the support of familiar names, while also keeping the brands' economic versions. 

Organic and nature-derived skin care items will become more popular in the future as consumer preferences for ecological, green, and vegan products grow. Most players are also shifting towards synthetic ingredient-free skin care products to protect consumers' skin. The rising popularity of serums, scrubs, packs, toners, and other types of skin care products in emerging countries will lead to the expansion of the skin care products market. Additionally, greater innovations produced by skin care product manufacturers to provide superior outcomes to their consumers will promote market growth. 

 
  • CHAPTER 1: INTRODUCTION

    • 1.1. Report description

    • 1.2. Key market segments

    • 1.3. Key benefits to the stakeholders

    • 1.4. Research Methodology

      • 1.4.1. Primary research

      • 1.4.2. Secondary research

      • 1.4.3. Analyst tools and models

  • CHAPTER 2: EXECUTIVE SUMMARY

    • 2.1. CXO Perspective

  • CHAPTER 3: MARKET OVERVIEW

    • 3.1. Market definition and scope

    • 3.2. Key findings

      • 3.2.1. Top impacting factors

      • 3.2.2. Top investment pockets

    • 3.3. Porter’s five forces analysis

      • 3.3.1. Moderate bargaining power of suppliers

      • 3.3.2. Low threat of new entrants

      • 3.3.3. Low threat of substitutes

      • 3.3.4. High intensity of rivalry

      • 3.3.5. High bargaining power of buyers

    • 3.4. Market dynamics

      • 3.4.1. Drivers

        • 3.4.1.1. Changing lifestyle patterns in emerging countries due to rapid urbanization
        • 3.4.1.2. Rising awareness towards skin care with advanced skin care products
        • 3.4.1.3. Increasing demand for skin care products

      • 3.4.2. Restraints

        • 3.4.2.1. Increasing prices of packaging and ingredients
        • 3.4.2.2. Probable negative effects of chemical ingredients

      • 3.4.3. Opportunities

        • 3.4.3.1. New product innovation
        • 3.4.3.2. Increasing investment in emerging countries

    • 3.5. COVID-19 Impact Analysis on the market

    • 3.6. Market Share Analysis

    • 3.7. Brand Share Analysis

    • 3.8. Value Chain Analysis

  • CHAPTER 4: SKIN CARE PRODUCTS MARKET, BY TYPE

    • 4.1. Overview

      • 4.1.1. Market size and forecast

    • 4.2. Face Cream

      • 4.2.1. Key market trends, growth factors and opportunities

      • 4.2.2. Market size and forecast, by region

      • 4.2.3. Market share analysis by country

      • 4.2.4. Face Cream Skin Care Products Market by Sub Type

        • 4.2.4.1. Skin Brightening Cream Market size and forecast, by region
        • 4.2.4.2. Anti Aging Cream Market size and forecast, by region
        • 4.2.4.3. Sun Protection Cream Market size and forecast, by region
    • 4.3. Body Lotion

      • 4.3.1. Key market trends, growth factors and opportunities

      • 4.3.2. Market size and forecast, by region

      • 4.3.3. Market share analysis by country

    • 4.4. Face Wash

      • 4.4.1. Key market trends, growth factors and opportunities

      • 4.4.2. Market size and forecast, by region

      • 4.4.3. Market share analysis by country

    • 4.5. Others

      • 4.5.1. Key market trends, growth factors and opportunities

      • 4.5.2. Market size and forecast, by region

      • 4.5.3. Market share analysis by country

  • CHAPTER 5: SKIN CARE PRODUCTS MARKET, BY END USER

    • 5.1. Overview

      • 5.1.1. Market size and forecast

    • 5.2. Women

      • 5.2.1. Key market trends, growth factors and opportunities

      • 5.2.2. Market size and forecast, by region

      • 5.2.3. Market share analysis by country

    • 5.3. Men

      • 5.3.1. Key market trends, growth factors and opportunities

      • 5.3.2. Market size and forecast, by region

      • 5.3.3. Market share analysis by country

  • CHAPTER 6: SKIN CARE PRODUCTS MARKET, BY PRICE POINT

    • 6.1. Overview

      • 6.1.1. Market size and forecast

    • 6.2. Mass

      • 6.2.1. Key market trends, growth factors and opportunities

      • 6.2.2. Market size and forecast, by region

      • 6.2.3. Market share analysis by country

    • 6.3. Premium

      • 6.3.1. Key market trends, growth factors and opportunities

      • 6.3.2. Market size and forecast, by region

      • 6.3.3. Market share analysis by country

  • CHAPTER 7: SKIN CARE PRODUCTS MARKET, BY DISTRIBUTION CHANNEL

    • 7.1. Overview

      • 7.1.1. Market size and forecast

    • 7.2. Supermarkets and Hypermarkets

      • 7.2.1. Key market trends, growth factors and opportunities

      • 7.2.2. Market size and forecast, by region

      • 7.2.3. Market share analysis by country

    • 7.3. Specialty stores

      • 7.3.1. Key market trends, growth factors and opportunities

      • 7.3.2. Market size and forecast, by region

      • 7.3.3. Market share analysis by country

    • 7.4. Online Channels

      • 7.4.1. Key market trends, growth factors and opportunities

      • 7.4.2. Market size and forecast, by region

      • 7.4.3. Market share analysis by country

    • 7.5. Others

      • 7.5.1. Key market trends, growth factors and opportunities

      • 7.5.2. Market size and forecast, by region

      • 7.5.3. Market share analysis by country

  • CHAPTER 8: SKIN CARE PRODUCTS MARKET, BY REGION

    • 8.1. Overview

      • 8.1.1. Market size and forecast By Region

    • 8.2. North America

      • 8.2.1. Key trends and opportunities

      • 8.2.2. Market size and forecast, by Type

        • 8.2.2.1. North America Face Cream Skin Care Products Market by Sub Type
      • 8.2.3. Market size and forecast, by End User

      • 8.2.4. Market size and forecast, by Price Point

      • 8.2.5. Market size and forecast, by Distribution Channel

      • 8.2.6. Market size and forecast, by country

        • 8.2.6.1. U.S.
          • 8.2.6.1.1. Key market trends, growth factors and opportunities
          • 8.2.6.1.2. Market size and forecast, by Type
          • 8.2.6.1.3. Market size and forecast, by End User
          • 8.2.6.1.4. Market size and forecast, by Price Point
          • 8.2.6.1.5. Market size and forecast, by Distribution Channel
        • 8.2.6.2. Canada
          • 8.2.6.2.1. Key market trends, growth factors and opportunities
          • 8.2.6.2.2. Market size and forecast, by Type
          • 8.2.6.2.3. Market size and forecast, by End User
          • 8.2.6.2.4. Market size and forecast, by Price Point
          • 8.2.6.2.5. Market size and forecast, by Distribution Channel
        • 8.2.6.3. Mexico
          • 8.2.6.3.1. Key market trends, growth factors and opportunities
          • 8.2.6.3.2. Market size and forecast, by Type
          • 8.2.6.3.3. Market size and forecast, by End User
          • 8.2.6.3.4. Market size and forecast, by Price Point
          • 8.2.6.3.5. Market size and forecast, by Distribution Channel
    • 8.3. Europe

      • 8.3.1. Key trends and opportunities

      • 8.3.2. Market size and forecast, by Type

        • 8.3.2.1. Europe Face Cream Skin Care Products Market by Sub Type
      • 8.3.3. Market size and forecast, by End User

      • 8.3.4. Market size and forecast, by Price Point

      • 8.3.5. Market size and forecast, by Distribution Channel

      • 8.3.6. Market size and forecast, by country

        • 8.3.6.1. UK
          • 8.3.6.1.1. Key market trends, growth factors and opportunities
          • 8.3.6.1.2. Market size and forecast, by Type
          • 8.3.6.1.3. Market size and forecast, by End User
          • 8.3.6.1.4. Market size and forecast, by Price Point
          • 8.3.6.1.5. Market size and forecast, by Distribution Channel
        • 8.3.6.2. Germany
          • 8.3.6.2.1. Key market trends, growth factors and opportunities
          • 8.3.6.2.2. Market size and forecast, by Type
          • 8.3.6.2.3. Market size and forecast, by End User
          • 8.3.6.2.4. Market size and forecast, by Price Point
          • 8.3.6.2.5. Market size and forecast, by Distribution Channel
        • 8.3.6.3. France
          • 8.3.6.3.1. Key market trends, growth factors and opportunities
          • 8.3.6.3.2. Market size and forecast, by Type
          • 8.3.6.3.3. Market size and forecast, by End User
          • 8.3.6.3.4. Market size and forecast, by Price Point
          • 8.3.6.3.5. Market size and forecast, by Distribution Channel
        • 8.3.6.4. Italy
          • 8.3.6.4.1. Key market trends, growth factors and opportunities
          • 8.3.6.4.2. Market size and forecast, by Type
          • 8.3.6.4.3. Market size and forecast, by End User
          • 8.3.6.4.4. Market size and forecast, by Price Point
          • 8.3.6.4.5. Market size and forecast, by Distribution Channel
        • 8.3.6.5. Spain
          • 8.3.6.5.1. Key market trends, growth factors and opportunities
          • 8.3.6.5.2. Market size and forecast, by Type
          • 8.3.6.5.3. Market size and forecast, by End User
          • 8.3.6.5.4. Market size and forecast, by Price Point
          • 8.3.6.5.5. Market size and forecast, by Distribution Channel
        • 8.3.6.6. Netherlands
          • 8.3.6.6.1. Key market trends, growth factors and opportunities
          • 8.3.6.6.2. Market size and forecast, by Type
          • 8.3.6.6.3. Market size and forecast, by End User
          • 8.3.6.6.4. Market size and forecast, by Price Point
          • 8.3.6.6.5. Market size and forecast, by Distribution Channel
        • 8.3.6.7. Rest of Europe
          • 8.3.6.7.1. Key market trends, growth factors and opportunities
          • 8.3.6.7.2. Market size and forecast, by Type
          • 8.3.6.7.3. Market size and forecast, by End User
          • 8.3.6.7.4. Market size and forecast, by Price Point
          • 8.3.6.7.5. Market size and forecast, by Distribution Channel
    • 8.4. Asia-Pacific

      • 8.4.1. Key trends and opportunities

      • 8.4.2. Market size and forecast, by Type

        • 8.4.2.1. Asia-Pacific Face Cream Skin Care Products Market by Sub Type
      • 8.4.3. Market size and forecast, by End User

      • 8.4.4. Market size and forecast, by Price Point

      • 8.4.5. Market size and forecast, by Distribution Channel

      • 8.4.6. Market size and forecast, by country

        • 8.4.6.1. China
          • 8.4.6.1.1. Key market trends, growth factors and opportunities
          • 8.4.6.1.2. Market size and forecast, by Type
          • 8.4.6.1.3. Market size and forecast, by End User
          • 8.4.6.1.4. Market size and forecast, by Price Point
          • 8.4.6.1.5. Market size and forecast, by Distribution Channel
        • 8.4.6.2. Japan
          • 8.4.6.2.1. Key market trends, growth factors and opportunities
          • 8.4.6.2.2. Market size and forecast, by Type
          • 8.4.6.2.3. Market size and forecast, by End User
          • 8.4.6.2.4. Market size and forecast, by Price Point
          • 8.4.6.2.5. Market size and forecast, by Distribution Channel
        • 8.4.6.3. India
          • 8.4.6.3.1. Key market trends, growth factors and opportunities
          • 8.4.6.3.2. Market size and forecast, by Type
          • 8.4.6.3.3. Market size and forecast, by End User
          • 8.4.6.3.4. Market size and forecast, by Price Point
          • 8.4.6.3.5. Market size and forecast, by Distribution Channel
        • 8.4.6.4. South Korea
          • 8.4.6.4.1. Key market trends, growth factors and opportunities
          • 8.4.6.4.2. Market size and forecast, by Type
          • 8.4.6.4.3. Market size and forecast, by End User
          • 8.4.6.4.4. Market size and forecast, by Price Point
          • 8.4.6.4.5. Market size and forecast, by Distribution Channel
        • 8.4.6.5. Australia
          • 8.4.6.5.1. Key market trends, growth factors and opportunities
          • 8.4.6.5.2. Market size and forecast, by Type
          • 8.4.6.5.3. Market size and forecast, by End User
          • 8.4.6.5.4. Market size and forecast, by Price Point
          • 8.4.6.5.5. Market size and forecast, by Distribution Channel
        • 8.4.6.6. Rest of Asia-Pacific
          • 8.4.6.6.1. Key market trends, growth factors and opportunities
          • 8.4.6.6.2. Market size and forecast, by Type
          • 8.4.6.6.3. Market size and forecast, by End User
          • 8.4.6.6.4. Market size and forecast, by Price Point
          • 8.4.6.6.5. Market size and forecast, by Distribution Channel
    • 8.5. LAMEA

      • 8.5.1. Key trends and opportunities

      • 8.5.2. Market size and forecast, by Type

        • 8.5.2.1. LAMEA Face Cream Skin Care Products Market by Sub Type
      • 8.5.3. Market size and forecast, by End User

      • 8.5.4. Market size and forecast, by Price Point

      • 8.5.5. Market size and forecast, by Distribution Channel

      • 8.5.6. Market size and forecast, by country

        • 8.5.6.1. Brazil
          • 8.5.6.1.1. Key market trends, growth factors and opportunities
          • 8.5.6.1.2. Market size and forecast, by Type
          • 8.5.6.1.3. Market size and forecast, by End User
          • 8.5.6.1.4. Market size and forecast, by Price Point
          • 8.5.6.1.5. Market size and forecast, by Distribution Channel
        • 8.5.6.2. Argentina
          • 8.5.6.2.1. Key market trends, growth factors and opportunities
          • 8.5.6.2.2. Market size and forecast, by Type
          • 8.5.6.2.3. Market size and forecast, by End User
          • 8.5.6.2.4. Market size and forecast, by Price Point
          • 8.5.6.2.5. Market size and forecast, by Distribution Channel
        • 8.5.6.3. Saudi Arabia
          • 8.5.6.3.1. Key market trends, growth factors and opportunities
          • 8.5.6.3.2. Market size and forecast, by Type
          • 8.5.6.3.3. Market size and forecast, by End User
          • 8.5.6.3.4. Market size and forecast, by Price Point
          • 8.5.6.3.5. Market size and forecast, by Distribution Channel
        • 8.5.6.4. United Arab Emirates
          • 8.5.6.4.1. Key market trends, growth factors and opportunities
          • 8.5.6.4.2. Market size and forecast, by Type
          • 8.5.6.4.3. Market size and forecast, by End User
          • 8.5.6.4.4. Market size and forecast, by Price Point
          • 8.5.6.4.5. Market size and forecast, by Distribution Channel
        • 8.5.6.5. South Africa
          • 8.5.6.5.1. Key market trends, growth factors and opportunities
          • 8.5.6.5.2. Market size and forecast, by Type
          • 8.5.6.5.3. Market size and forecast, by End User
          • 8.5.6.5.4. Market size and forecast, by Price Point
          • 8.5.6.5.5. Market size and forecast, by Distribution Channel
        • 8.5.6.6. Rest of LAMEA
          • 8.5.6.6.1. Key market trends, growth factors and opportunities
          • 8.5.6.6.2. Market size and forecast, by Type
          • 8.5.6.6.3. Market size and forecast, by End User
          • 8.5.6.6.4. Market size and forecast, by Price Point
          • 8.5.6.6.5. Market size and forecast, by Distribution Channel
  • CHAPTER 9: COMPETITIVE LANDSCAPE

    • 9.1. Introduction

    • 9.2. Top winning strategies

    • 9.3. Product Mapping of Top 10 Player

    • 9.4. Competitive Dashboard

    • 9.5. Competitive Heatmap

    • 9.6. Top player positioning, 2021

  • CHAPTER 10: COMPANY PROFILES

    • 10.1. Johnson & Johnson

      • 10.1.1. Company overview

      • 10.1.2. Key Executives

      • 10.1.3. Company snapshot

      • 10.1.4. Operating business segments

      • 10.1.5. Product portfolio

      • 10.1.6. Business performance

      • 10.1.7. Key strategic moves and developments

    • 10.2. Kao Corporation

      • 10.2.1. Company overview

      • 10.2.2. Key Executives

      • 10.2.3. Company snapshot

      • 10.2.4. Operating business segments

      • 10.2.5. Product portfolio

      • 10.2.6. Business performance

      • 10.2.7. Key strategic moves and developments

    • 10.3. LOREAL S. A.

      • 10.3.1. Company overview

      • 10.3.2. Key Executives

      • 10.3.3. Company snapshot

      • 10.3.4. Operating business segments

      • 10.3.5. Product portfolio

      • 10.3.6. Business performance

      • 10.3.7. Key strategic moves and developments

    • 10.4. LVMH

      • 10.4.1. Company overview

      • 10.4.2. Key Executives

      • 10.4.3. Company snapshot

      • 10.4.4. Operating business segments

      • 10.4.5. Product portfolio

      • 10.4.6. Business performance

      • 10.4.7. Key strategic moves and developments

    • 10.5. The Procter & Gamble Company

      • 10.5.1. Company overview

      • 10.5.2. Key Executives

      • 10.5.3. Company snapshot

      • 10.5.4. Operating business segments

      • 10.5.5. Product portfolio

      • 10.5.6. Business performance

      • 10.5.7. Key strategic moves and developments

    • 10.6. Revlon, Inc.

      • 10.6.1. Company overview

      • 10.6.2. Key Executives

      • 10.6.3. Company snapshot

      • 10.6.4. Operating business segments

      • 10.6.5. Product portfolio

      • 10.6.6. Business performance

      • 10.6.7. Key strategic moves and developments

    • 10.7. Shiseido Company, Limited

      • 10.7.1. Company overview

      • 10.7.2. Key Executives

      • 10.7.3. Company snapshot

      • 10.7.4. Operating business segments

      • 10.7.5. Product portfolio

      • 10.7.6. Business performance

      • 10.7.7. Key strategic moves and developments

    • 10.8. Unilever PLC

      • 10.8.1. Company overview

      • 10.8.2. Key Executives

      • 10.8.3. Company snapshot

      • 10.8.4. Operating business segments

      • 10.8.5. Product portfolio

      • 10.8.6. Business performance

      • 10.8.7. Key strategic moves and developments

    • 10.9. Weleda AG

      • 10.9.1. Company overview

      • 10.9.2. Key Executives

      • 10.9.3. Company snapshot

      • 10.9.4. Operating business segments

      • 10.9.5. Product portfolio

    • 10.10. The Estee Lauder Companies Inc.

      • 10.10.1. Company overview

      • 10.10.2. Key Executives

      • 10.10.3. Company snapshot

      • 10.10.4. Operating business segments

      • 10.10.5. Product portfolio

      • 10.10.6. Business performance

      • 10.10.7. Key strategic moves and developments

  • LIST OF TABLES

  • TABLE 01. GLOBAL SKIN CARE PRODUCTS MARKET, BY TYPE, 2021-2031 ($MILLION)
    TABLE 02. SKIN CARE PRODUCTS MARKET FOR FACE CREAM, BY REGION, 2021-2031 ($MILLION)
    TABLE 03. GLOBAL FACE CREAM SKIN CARE PRODUCTS MARKET, BY SUB TYPE, 2021-2031 ($MILLION)
    TABLE 04. SKIN CARE PRODUCTS MARKET FOR SKIN BRIGHTENING CREAM, BY REGION, 2021-2031 ($MILLION)
    TABLE 05. SKIN CARE PRODUCTS MARKET FOR ANTI AGING CREAM, BY REGION, 2021-2031 ($MILLION)
    TABLE 06. SKIN CARE PRODUCTS MARKET FOR SUN PROTECTION CREAM, BY REGION, 2021-2031 ($MILLION)
    TABLE 07. SKIN CARE PRODUCTS MARKET FOR BODY LOTION, BY REGION, 2021-2031 ($MILLION)
    TABLE 08. SKIN CARE PRODUCTS MARKET FOR FACE WASH, BY REGION, 2021-2031 ($MILLION)
    TABLE 09. SKIN CARE PRODUCTS MARKET FOR OTHERS, BY REGION, 2021-2031 ($MILLION)
    TABLE 10. GLOBAL SKIN CARE PRODUCTS MARKET, BY END USER, 2021-2031 ($MILLION)
    TABLE 11. SKIN CARE PRODUCTS MARKET FOR WOMEN, BY REGION, 2021-2031 ($MILLION)
    TABLE 12. SKIN CARE PRODUCTS MARKET FOR MEN, BY REGION, 2021-2031 ($MILLION)
    TABLE 13. GLOBAL SKIN CARE PRODUCTS MARKET, BY PRICE POINT, 2021-2031 ($MILLION)
    TABLE 14. SKIN CARE PRODUCTS MARKET FOR MASS, BY REGION, 2021-2031 ($MILLION)
    TABLE 15. SKIN CARE PRODUCTS MARKET FOR PREMIUM, BY REGION, 2021-2031 ($MILLION)
    TABLE 16. GLOBAL SKIN CARE PRODUCTS MARKET, BY DISTRIBUTION CHANNEL, 2021-2031 ($MILLION)
    TABLE 17. SKIN CARE PRODUCTS MARKET FOR SUPERMARKETS AND HYPERMARKETS, BY REGION, 2021-2031 ($MILLION)
    TABLE 18. SKIN CARE PRODUCTS MARKET FOR SPECIALTY STORES, BY REGION, 2021-2031 ($MILLION)
    TABLE 19. SKIN CARE PRODUCTS MARKET FOR ONLINE CHANNELS, BY REGION, 2021-2031 ($MILLION)
    TABLE 20. SKIN CARE PRODUCTS MARKET FOR OTHERS, BY REGION, 2021-2031 ($MILLION)
    TABLE 21. SKIN CARE PRODUCTS MARKET, BY REGION, 2021-2031 ($MILLION)
    TABLE 22. NORTH AMERICA SKIN CARE PRODUCTS MARKET, BY TYPE, 2021-2031 ($MILLION)
    TABLE 23. NORTH AMERICA FACE CREAM SKIN CARE PRODUCTS MARKET, BY SUB TYPE, 2021-2031 ($MILLION)
    TABLE 24. NORTH AMERICA SKIN CARE PRODUCTS MARKET, BY END USER, 2021-2031 ($MILLION)
    TABLE 25. NORTH AMERICA SKIN CARE PRODUCTS MARKET, BY PRICE POINT, 2021-2031 ($MILLION)
    TABLE 26. NORTH AMERICA SKIN CARE PRODUCTS MARKET, BY DISTRIBUTION CHANNEL, 2021-2031 ($MILLION)
    TABLE 27. NORTH AMERICA SKIN CARE PRODUCTS MARKET, BY COUNTRY, 2021-2031 ($MILLION)
    TABLE 28. U.S. SKIN CARE PRODUCTS MARKET, BY TYPE, 2021-2031 ($MILLION)
    TABLE 29. U.S. SKIN CARE PRODUCTS MARKET, BY END USER, 2021-2031 ($MILLION)
    TABLE 30. U.S. SKIN CARE PRODUCTS MARKET, BY PRICE POINT, 2021-2031 ($MILLION)
    TABLE 31. U.S. SKIN CARE PRODUCTS MARKET, BY DISTRIBUTION CHANNEL, 2021-2031 ($MILLION)
    TABLE 32. CANADA SKIN CARE PRODUCTS MARKET, BY TYPE, 2021-2031 ($MILLION)
    TABLE 33. CANADA SKIN CARE PRODUCTS MARKET, BY END USER, 2021-2031 ($MILLION)
    TABLE 34. CANADA SKIN CARE PRODUCTS MARKET, BY PRICE POINT, 2021-2031 ($MILLION)
    TABLE 35. CANADA SKIN CARE PRODUCTS MARKET, BY DISTRIBUTION CHANNEL, 2021-2031 ($MILLION)
    TABLE 36. MEXICO SKIN CARE PRODUCTS MARKET, BY TYPE, 2021-2031 ($MILLION)
    TABLE 37. MEXICO SKIN CARE PRODUCTS MARKET, BY END USER, 2021-2031 ($MILLION)
    TABLE 38. MEXICO SKIN CARE PRODUCTS MARKET, BY PRICE POINT, 2021-2031 ($MILLION)
    TABLE 39. MEXICO SKIN CARE PRODUCTS MARKET, BY DISTRIBUTION CHANNEL, 2021-2031 ($MILLION)
    TABLE 40. EUROPE SKIN CARE PRODUCTS MARKET, BY TYPE, 2021-2031 ($MILLION)
    TABLE 41. EUROPE FACE CREAM SKIN CARE PRODUCTS MARKET, BY SUB TYPE, 2021-2031 ($MILLION)
    TABLE 42. EUROPE SKIN CARE PRODUCTS MARKET, BY END USER, 2021-2031 ($MILLION)
    TABLE 43. EUROPE SKIN CARE PRODUCTS MARKET, BY PRICE POINT, 2021-2031 ($MILLION)
    TABLE 44. EUROPE SKIN CARE PRODUCTS MARKET, BY DISTRIBUTION CHANNEL, 2021-2031 ($MILLION)
    TABLE 45. EUROPE SKIN CARE PRODUCTS MARKET, BY COUNTRY, 2021-2031 ($MILLION)
    TABLE 46. UK SKIN CARE PRODUCTS MARKET, BY TYPE, 2021-2031 ($MILLION)
    TABLE 47. UK SKIN CARE PRODUCTS MARKET, BY END USER, 2021-2031 ($MILLION)
    TABLE 48. UK SKIN CARE PRODUCTS MARKET, BY PRICE POINT, 2021-2031 ($MILLION)
    TABLE 49. UK SKIN CARE PRODUCTS MARKET, BY DISTRIBUTION CHANNEL, 2021-2031 ($MILLION)
    TABLE 50. GERMANY SKIN CARE PRODUCTS MARKET, BY TYPE, 2021-2031 ($MILLION)
    TABLE 51. GERMANY SKIN CARE PRODUCTS MARKET, BY END USER, 2021-2031 ($MILLION)
    TABLE 52. GERMANY SKIN CARE PRODUCTS MARKET, BY PRICE POINT, 2021-2031 ($MILLION)
    TABLE 53. GERMANY SKIN CARE PRODUCTS MARKET, BY DISTRIBUTION CHANNEL, 2021-2031 ($MILLION)
    TABLE 54. FRANCE SKIN CARE PRODUCTS MARKET, BY TYPE, 2021-2031 ($MILLION)
    TABLE 55. FRANCE SKIN CARE PRODUCTS MARKET, BY END USER, 2021-2031 ($MILLION)
    TABLE 56. FRANCE SKIN CARE PRODUCTS MARKET, BY PRICE POINT, 2021-2031 ($MILLION)
    TABLE 57. FRANCE SKIN CARE PRODUCTS MARKET, BY DISTRIBUTION CHANNEL, 2021-2031 ($MILLION)
    TABLE 58. ITALY SKIN CARE PRODUCTS MARKET, BY TYPE, 2021-2031 ($MILLION)
    TABLE 59. ITALY SKIN CARE PRODUCTS MARKET, BY END USER, 2021-2031 ($MILLION)
    TABLE 60. ITALY SKIN CARE PRODUCTS MARKET, BY PRICE POINT, 2021-2031 ($MILLION)
    TABLE 61. ITALY SKIN CARE PRODUCTS MARKET, BY DISTRIBUTION CHANNEL, 2021-2031 ($MILLION)
    TABLE 62. SPAIN SKIN CARE PRODUCTS MARKET, BY TYPE, 2021-2031 ($MILLION)
    TABLE 63. SPAIN SKIN CARE PRODUCTS MARKET, BY END USER, 2021-2031 ($MILLION)
    TABLE 64. SPAIN SKIN CARE PRODUCTS MARKET, BY PRICE POINT, 2021-2031 ($MILLION)
    TABLE 65. SPAIN SKIN CARE PRODUCTS MARKET, BY DISTRIBUTION CHANNEL, 2021-2031 ($MILLION)
    TABLE 66. NETHERLANDS SKIN CARE PRODUCTS MARKET, BY TYPE, 2021-2031 ($MILLION)
    TABLE 67. NETHERLANDS SKIN CARE PRODUCTS MARKET, BY END USER, 2021-2031 ($MILLION)
    TABLE 68. NETHERLANDS SKIN CARE PRODUCTS MARKET, BY PRICE POINT, 2021-2031 ($MILLION)
    TABLE 69. NETHERLANDS SKIN CARE PRODUCTS MARKET, BY DISTRIBUTION CHANNEL, 2021-2031 ($MILLION)
    TABLE 70. REST OF EUROPE SKIN CARE PRODUCTS MARKET, BY TYPE, 2021-2031 ($MILLION)
    TABLE 71. REST OF EUROPE SKIN CARE PRODUCTS MARKET, BY END USER, 2021-2031 ($MILLION)
    TABLE 72. REST OF EUROPE SKIN CARE PRODUCTS MARKET, BY PRICE POINT, 2021-2031 ($MILLION)
    TABLE 73. REST OF EUROPE SKIN CARE PRODUCTS MARKET, BY DISTRIBUTION CHANNEL, 2021-2031 ($MILLION)
    TABLE 74. ASIA-PACIFIC SKIN CARE PRODUCTS MARKET, BY TYPE, 2021-2031 ($MILLION)
    TABLE 75. ASIA-PACIFIC FACE CREAM SKIN CARE PRODUCTS MARKET, BY SUB TYPE, 2021-2031 ($MILLION)
    TABLE 76. ASIA-PACIFIC SKIN CARE PRODUCTS MARKET, BY END USER, 2021-2031 ($MILLION)
    TABLE 77. ASIA-PACIFIC SKIN CARE PRODUCTS MARKET, BY PRICE POINT, 2021-2031 ($MILLION)
    TABLE 78. ASIA-PACIFIC SKIN CARE PRODUCTS MARKET, BY DISTRIBUTION CHANNEL, 2021-2031 ($MILLION)
    TABLE 79. ASIA-PACIFIC SKIN CARE PRODUCTS MARKET, BY COUNTRY, 2021-2031 ($MILLION)
    TABLE 80. CHINA SKIN CARE PRODUCTS MARKET, BY TYPE, 2021-2031 ($MILLION)
    TABLE 81. CHINA SKIN CARE PRODUCTS MARKET, BY END USER, 2021-2031 ($MILLION)
    TABLE 82. CHINA SKIN CARE PRODUCTS MARKET, BY PRICE POINT, 2021-2031 ($MILLION)
    TABLE 83. CHINA SKIN CARE PRODUCTS MARKET, BY DISTRIBUTION CHANNEL, 2021-2031 ($MILLION)
    TABLE 84. JAPAN SKIN CARE PRODUCTS MARKET, BY TYPE, 2021-2031 ($MILLION)
    TABLE 85. JAPAN SKIN CARE PRODUCTS MARKET, BY END USER, 2021-2031 ($MILLION)
    TABLE 86. JAPAN SKIN CARE PRODUCTS MARKET, BY PRICE POINT, 2021-2031 ($MILLION)
    TABLE 87. JAPAN SKIN CARE PRODUCTS MARKET, BY DISTRIBUTION CHANNEL, 2021-2031 ($MILLION)
    TABLE 88. INDIA SKIN CARE PRODUCTS MARKET, BY TYPE, 2021-2031 ($MILLION)
    TABLE 89. INDIA SKIN CARE PRODUCTS MARKET, BY END USER, 2021-2031 ($MILLION)
    TABLE 90. INDIA SKIN CARE PRODUCTS MARKET, BY PRICE POINT, 2021-2031 ($MILLION)
    TABLE 91. INDIA SKIN CARE PRODUCTS MARKET, BY DISTRIBUTION CHANNEL, 2021-2031 ($MILLION)
    TABLE 92. SOUTH KOREA SKIN CARE PRODUCTS MARKET, BY TYPE, 2021-2031 ($MILLION)
    TABLE 93. SOUTH KOREA SKIN CARE PRODUCTS MARKET, BY END USER, 2021-2031 ($MILLION)
    TABLE 94. SOUTH KOREA SKIN CARE PRODUCTS MARKET, BY PRICE POINT, 2021-2031 ($MILLION)
    TABLE 95. SOUTH KOREA SKIN CARE PRODUCTS MARKET, BY DISTRIBUTION CHANNEL, 2021-2031 ($MILLION)
    TABLE 96. AUSTRALIA SKIN CARE PRODUCTS MARKET, BY TYPE, 2021-2031 ($MILLION)
    TABLE 97. AUSTRALIA SKIN CARE PRODUCTS MARKET, BY END USER, 2021-2031 ($MILLION)
    TABLE 98. AUSTRALIA SKIN CARE PRODUCTS MARKET, BY PRICE POINT, 2021-2031 ($MILLION)
    TABLE 99. AUSTRALIA SKIN CARE PRODUCTS MARKET, BY DISTRIBUTION CHANNEL, 2021-2031 ($MILLION)
    TABLE 100. REST OF ASIA-PACIFIC SKIN CARE PRODUCTS MARKET, BY TYPE, 2021-2031 ($MILLION)
    TABLE 101. REST OF ASIA-PACIFIC SKIN CARE PRODUCTS MARKET, BY END USER, 2021-2031 ($MILLION)
    TABLE 102. REST OF ASIA-PACIFIC SKIN CARE PRODUCTS MARKET, BY PRICE POINT, 2021-2031 ($MILLION)
    TABLE 103. REST OF ASIA-PACIFIC SKIN CARE PRODUCTS MARKET, BY DISTRIBUTION CHANNEL, 2021-2031 ($MILLION)
    TABLE 104. LAMEA SKIN CARE PRODUCTS MARKET, BY TYPE, 2021-2031 ($MILLION)
    TABLE 105. LAMEA FACE CREAM SKIN CARE PRODUCTS MARKET, BY SUB TYPE, 2021-2031 ($MILLION)
    TABLE 106. LAMEA SKIN CARE PRODUCTS MARKET, BY END USER, 2021-2031 ($MILLION)
    TABLE 107. LAMEA SKIN CARE PRODUCTS MARKET, BY PRICE POINT, 2021-2031 ($MILLION)
    TABLE 108. LAMEA SKIN CARE PRODUCTS MARKET, BY DISTRIBUTION CHANNEL, 2021-2031 ($MILLION)
    TABLE 109. LAMEA SKIN CARE PRODUCTS MARKET, BY COUNTRY, 2021-2031 ($MILLION)
    TABLE 110. BRAZIL SKIN CARE PRODUCTS MARKET, BY TYPE, 2021-2031 ($MILLION)
    TABLE 111. BRAZIL SKIN CARE PRODUCTS MARKET, BY END USER, 2021-2031 ($MILLION)
    TABLE 112. BRAZIL SKIN CARE PRODUCTS MARKET, BY PRICE POINT, 2021-2031 ($MILLION)
    TABLE 113. BRAZIL SKIN CARE PRODUCTS MARKET, BY DISTRIBUTION CHANNEL, 2021-2031 ($MILLION)
    TABLE 114. ARGENTINA SKIN CARE PRODUCTS MARKET, BY TYPE, 2021-2031 ($MILLION)
    TABLE 115. ARGENTINA SKIN CARE PRODUCTS MARKET, BY END USER, 2021-2031 ($MILLION)
    TABLE 116. ARGENTINA SKIN CARE PRODUCTS MARKET, BY PRICE POINT, 2021-2031 ($MILLION)
    TABLE 117. ARGENTINA SKIN CARE PRODUCTS MARKET, BY DISTRIBUTION CHANNEL, 2021-2031 ($MILLION)
    TABLE 118. SAUDI ARABIA SKIN CARE PRODUCTS MARKET, BY TYPE, 2021-2031 ($MILLION)
    TABLE 119. SAUDI ARABIA SKIN CARE PRODUCTS MARKET, BY END USER, 2021-2031 ($MILLION)
    TABLE 120. SAUDI ARABIA SKIN CARE PRODUCTS MARKET, BY PRICE POINT, 2021-2031 ($MILLION)
    TABLE 121. SAUDI ARABIA SKIN CARE PRODUCTS MARKET, BY DISTRIBUTION CHANNEL, 2021-2031 ($MILLION)
    TABLE 122. UNITED ARAB EMIRATES SKIN CARE PRODUCTS MARKET, BY TYPE, 2021-2031 ($MILLION)
    TABLE 123. UNITED ARAB EMIRATES SKIN CARE PRODUCTS MARKET, BY END USER, 2021-2031 ($MILLION)
    TABLE 124. UNITED ARAB EMIRATES SKIN CARE PRODUCTS MARKET, BY PRICE POINT, 2021-2031 ($MILLION)
    TABLE 125. UNITED ARAB EMIRATES SKIN CARE PRODUCTS MARKET, BY DISTRIBUTION CHANNEL, 2021-2031 ($MILLION)
    TABLE 126. SOUTH AFRICA SKIN CARE PRODUCTS MARKET, BY TYPE, 2021-2031 ($MILLION)
    TABLE 127. SOUTH AFRICA SKIN CARE PRODUCTS MARKET, BY END USER, 2021-2031 ($MILLION)
    TABLE 128. SOUTH AFRICA SKIN CARE PRODUCTS MARKET, BY PRICE POINT, 2021-2031 ($MILLION)
    TABLE 129. SOUTH AFRICA SKIN CARE PRODUCTS MARKET, BY DISTRIBUTION CHANNEL, 2021-2031 ($MILLION)
    TABLE 130. REST OF LAMEA SKIN CARE PRODUCTS MARKET, BY TYPE, 2021-2031 ($MILLION)
    TABLE 131. REST OF LAMEA SKIN CARE PRODUCTS MARKET, BY END USER, 2021-2031 ($MILLION)
    TABLE 132. REST OF LAMEA SKIN CARE PRODUCTS MARKET, BY PRICE POINT, 2021-2031 ($MILLION)
    TABLE 133. REST OF LAMEA SKIN CARE PRODUCTS MARKET, BY DISTRIBUTION CHANNEL, 2021-2031 ($MILLION)
    TABLE 134. JOHNSON & JOHNSON: KEY EXECUTIVES
    TABLE 135. JOHNSON & JOHNSON: COMPANY SNAPSHOT
    TABLE 136. JOHNSON & JOHNSON: PRODUCT SEGMENTS
    TABLE 137. JOHNSON & JOHNSON: PRODUCT PORTFOLIO
    TABLE 138. JOHNSON & JOHNSON: KEY STRATERGIES
    TABLE 139. KAO CORPORATION: KEY EXECUTIVES
    TABLE 140. KAO CORPORATION: COMPANY SNAPSHOT
    TABLE 141. KAO CORPORATION: PRODUCT SEGMENTS
    TABLE 142. KAO CORPORATION: PRODUCT PORTFOLIO
    TABLE 143. KAO CORPORATION: KEY STRATERGIES
    TABLE 144. LOREAL S. A.: KEY EXECUTIVES
    TABLE 145. LOREAL S. A.: COMPANY SNAPSHOT
    TABLE 146. LOREAL S. A.: PRODUCT SEGMENTS
    TABLE 147. LOREAL S. A.: PRODUCT PORTFOLIO
    TABLE 148. LOREAL S. A.: KEY STRATERGIES
    TABLE 149. LVMH: KEY EXECUTIVES
    TABLE 150. LVMH: COMPANY SNAPSHOT
    TABLE 151. LVMH: PRODUCT SEGMENTS
    TABLE 152. LVMH: PRODUCT PORTFOLIO
    TABLE 153. LVMH: KEY STRATERGIES
    TABLE 154. THE PROCTER & GAMBLE COMPANY: KEY EXECUTIVES
    TABLE 155. THE PROCTER & GAMBLE COMPANY: COMPANY SNAPSHOT
    TABLE 156. THE PROCTER & GAMBLE COMPANY: PRODUCT SEGMENTS
    TABLE 157. THE PROCTER & GAMBLE COMPANY: PRODUCT PORTFOLIO
    TABLE 158. THE PROCTER & GAMBLE COMPANY: KEY STRATERGIES
    TABLE 159. REVLON, INC.: KEY EXECUTIVES
    TABLE 160. REVLON, INC.: COMPANY SNAPSHOT
    TABLE 161. REVLON, INC.: PRODUCT SEGMENTS
    TABLE 162. REVLON, INC.: PRODUCT PORTFOLIO
    TABLE 163. REVLON, INC.: KEY STRATERGIES
    TABLE 164. SHISEIDO COMPANY, LIMITED: KEY EXECUTIVES
    TABLE 165. SHISEIDO COMPANY, LIMITED: COMPANY SNAPSHOT
    TABLE 166. SHISEIDO COMPANY, LIMITED: PRODUCT SEGMENTS
    TABLE 167. SHISEIDO COMPANY, LIMITED: PRODUCT PORTFOLIO
    TABLE 168. SHISEIDO COMPANY, LIMITED: KEY STRATERGIES
    TABLE 169. UNILEVER PLC: KEY EXECUTIVES
    TABLE 170. UNILEVER PLC: COMPANY SNAPSHOT
    TABLE 171. UNILEVER PLC: PRODUCT SEGMENTS
    TABLE 172. UNILEVER PLC: PRODUCT PORTFOLIO
    TABLE 173. UNILEVER PLC: KEY STRATERGIES
    TABLE 174. WELEDA AG: KEY EXECUTIVES
    TABLE 175. WELEDA AG: COMPANY SNAPSHOT
    TABLE 176. WELEDA AG: PRODUCT SEGMENTS
    TABLE 177. WELEDA AG: PRODUCT PORTFOLIO
    TABLE 178. THE ESTEE LAUDER COMPANIES INC.: KEY EXECUTIVES
    TABLE 179. THE ESTEE LAUDER COMPANIES INC.: COMPANY SNAPSHOT
    TABLE 180. THE ESTEE LAUDER COMPANIES INC.: PRODUCT SEGMENTS
    TABLE 181. THE ESTEE LAUDER COMPANIES INC.: PRODUCT PORTFOLIO
    TABLE 182. THE ESTEE LAUDER COMPANIES INC.: KEY STRATERGIES
  • LIST OF FIGURES

  • FIGURE 01. SKIN CARE PRODUCTS MARKET, 2021-2031
    FIGURE 02. SEGMENTATION OF SKIN CARE PRODUCTS MARKET, 2021-2031
    FIGURE 03. TOP INVESTMENT POCKETS IN SKIN CARE PRODUCTS MARKET (2022-2031)
    FIGURE 04. PORTER FIVE-1
    FIGURE 05. PORTER FIVE-2
    FIGURE 06. PORTER FIVE-3
    FIGURE 07. PORTER FIVE-4
    FIGURE 08. PORTER FIVE-5
    FIGURE 09. DRIVERS, RESTRAINTS AND OPPORTUNITIES: GLOBALSKIN CARE PRODUCTS MARKET
    FIGURE 10. MARKET SHARE ANALYSIS: SKIN CARE PRODUCTS MARKET
    FIGURE 11. VALUE CHAIN ANALYSIS: SKIN CARE PRODUCTS MARKET
    FIGURE 12. SKIN CARE PRODUCTS MARKET, BY TYPE, 2021(%)
    FIGURE 13. COMPARATIVE SHARE ANALYSIS OF SKIN CARE PRODUCTS MARKET FOR FACE CREAM, BY COUNTRY 2021 AND 2031(%)
    FIGURE 14. COMPARATIVE SHARE ANALYSIS OF SKIN CARE PRODUCTS MARKET FOR BODY LOTION, BY COUNTRY 2021 AND 2031(%)
    FIGURE 15. COMPARATIVE SHARE ANALYSIS OF SKIN CARE PRODUCTS MARKET FOR FACE WASH, BY COUNTRY 2021 AND 2031(%)
    FIGURE 16. COMPARATIVE SHARE ANALYSIS OF SKIN CARE PRODUCTS MARKET FOR OTHERS, BY COUNTRY 2021 AND 2031(%)
    FIGURE 17. SKIN CARE PRODUCTS MARKET, BY END USER, 2021(%)
    FIGURE 18. COMPARATIVE SHARE ANALYSIS OF SKIN CARE PRODUCTS MARKET FOR WOMEN, BY COUNTRY 2021 AND 2031(%)
    FIGURE 19. COMPARATIVE SHARE ANALYSIS OF SKIN CARE PRODUCTS MARKET FOR MEN, BY COUNTRY 2021 AND 2031(%)
    FIGURE 20. SKIN CARE PRODUCTS MARKET, BY PRICE POINT, 2021(%)
    FIGURE 21. COMPARATIVE SHARE ANALYSIS OF SKIN CARE PRODUCTS MARKET FOR MASS, BY COUNTRY 2021 AND 2031(%)
    FIGURE 22. COMPARATIVE SHARE ANALYSIS OF SKIN CARE PRODUCTS MARKET FOR PREMIUM, BY COUNTRY 2021 AND 2031(%)
    FIGURE 23. SKIN CARE PRODUCTS MARKET, BY DISTRIBUTION CHANNEL, 2021(%)
    FIGURE 24. COMPARATIVE SHARE ANALYSIS OF SKIN CARE PRODUCTS MARKET FOR SUPERMARKETS AND HYPERMARKETS, BY COUNTRY 2021 AND 2031(%)
    FIGURE 25. COMPARATIVE SHARE ANALYSIS OF SKIN CARE PRODUCTS MARKET FOR SPECIALTY STORES, BY COUNTRY 2021 AND 2031(%)
    FIGURE 26. COMPARATIVE SHARE ANALYSIS OF SKIN CARE PRODUCTS MARKET FOR ONLINE CHANNELS, BY COUNTRY 2021 AND 2031(%)
    FIGURE 27. COMPARATIVE SHARE ANALYSIS OF SKIN CARE PRODUCTS MARKET FOR OTHERS, BY COUNTRY 2021 AND 2031(%)
    FIGURE 28. SKIN CARE PRODUCTS MARKET BY REGION, 2021
    FIGURE 29. U.S. SKIN CARE PRODUCTS MARKET, 2021-2031 ($MILLION)
    FIGURE 30. CANADA SKIN CARE PRODUCTS MARKET, 2021-2031 ($MILLION)
    FIGURE 31. MEXICO SKIN CARE PRODUCTS MARKET, 2021-2031 ($MILLION)
    FIGURE 32. UK SKIN CARE PRODUCTS MARKET, 2021-2031 ($MILLION)
    FIGURE 33. GERMANY SKIN CARE PRODUCTS MARKET, 2021-2031 ($MILLION)
    FIGURE 34. FRANCE SKIN CARE PRODUCTS MARKET, 2021-2031 ($MILLION)
    FIGURE 35. ITALY SKIN CARE PRODUCTS MARKET, 2021-2031 ($MILLION)
    FIGURE 36. SPAIN SKIN CARE PRODUCTS MARKET, 2021-2031 ($MILLION)
    FIGURE 37. NETHERLANDS SKIN CARE PRODUCTS MARKET, 2021-2031 ($MILLION)
    FIGURE 38. REST OF EUROPE SKIN CARE PRODUCTS MARKET, 2021-2031 ($MILLION)
    FIGURE 39. CHINA SKIN CARE PRODUCTS MARKET, 2021-2031 ($MILLION)
    FIGURE 40. JAPAN SKIN CARE PRODUCTS MARKET, 2021-2031 ($MILLION)
    FIGURE 41. INDIA SKIN CARE PRODUCTS MARKET, 2021-2031 ($MILLION)
    FIGURE 42. SOUTH KOREA SKIN CARE PRODUCTS MARKET, 2021-2031 ($MILLION)
    FIGURE 43. AUSTRALIA SKIN CARE PRODUCTS MARKET, 2021-2031 ($MILLION)
    FIGURE 44. REST OF ASIA-PACIFIC SKIN CARE PRODUCTS MARKET, 2021-2031 ($MILLION)
    FIGURE 45. BRAZIL SKIN CARE PRODUCTS MARKET, 2021-2031 ($MILLION)
    FIGURE 46. ARGENTINA SKIN CARE PRODUCTS MARKET, 2021-2031 ($MILLION)
    FIGURE 47. SAUDI ARABIA SKIN CARE PRODUCTS MARKET, 2021-2031 ($MILLION)
    FIGURE 48. UNITED ARAB EMIRATES SKIN CARE PRODUCTS MARKET, 2021-2031 ($MILLION)
    FIGURE 49. SOUTH AFRICA SKIN CARE PRODUCTS MARKET, 2021-2031 ($MILLION)
    FIGURE 50. REST OF LAMEA SKIN CARE PRODUCTS MARKET, 2021-2031 ($MILLION)
    FIGURE 51. TOP WINNING STRATEGIES, BY YEAR
    FIGURE 52. TOP WINNING STRATEGIES, BY DEVELOPMENT
    FIGURE 53. TOP WINNING STRATEGIES, BY COMPANY
    FIGURE 54. PRODUCT MAPPING OF TOP 10 PLAYERS
    FIGURE 55. COMPETITIVE DASHBOARD
    FIGURE 56. COMPETITIVE HEATMAP: SKIN CARE PRODUCTS MARKET
    FIGURE 57. TOP PLAYER POSITIONING, 2021
    FIGURE 58. JOHNSON & JOHNSON: NET SALES, 2020-2022 ($MILLION)
    FIGURE 59. JOHNSON & JOHNSON: REVENUE SHARE BY SEGMENT, 2022 (%)
    FIGURE 60. JOHNSON & JOHNSON: REVENUE SHARE BY REGION, 2022 (%)
    FIGURE 61. KAO CORPORATION: NET REVENUE, 2019-2021 ($MILLION)
    FIGURE 62. KAO CORPORATION: REVENUE SHARE BY SEGMENT, 2021 (%)
    FIGURE 63. KAO CORPORATION: REVENUE SHARE BY REGION, 2021 (%)
    FIGURE 64. LOREAL S. A.: NET SALES, 2019-2021 ($MILLION)
    FIGURE 65. LOREAL S. A.: REVENUE SHARE BY SEGMENT, 2021 (%)
    FIGURE 66. LOREAL S. A.: REVENUE SHARE BY REGION, 2021 (%)
    FIGURE 67. LVMH: NET REVENUE, 2020-2022 ($MILLION)
    FIGURE 68. LVMH: REVENUE SHARE BY SEGMENT, 2021 (%)
    FIGURE 69. LVMH: REVENUE SHARE BY REGION, 2022 (%)
    FIGURE 70. THE PROCTER & GAMBLE COMPANY: NET REVENUE, 2019-2021 ($MILLION)
    FIGURE 71. THE PROCTER & GAMBLE COMPANY: RESEARCH & DEVELOPMENT EXPENDITURE, 2019-2021 ($MILLION)
    FIGURE 72. THE PROCTER & GAMBLE COMPANY: REVENUE SHARE BY SEGMENT, 2021 (%)
    FIGURE 73. THE PROCTER & GAMBLE COMPANY: REVENUE SHARE BY REGION, 2021 (%)
    FIGURE 74. REVLON, INC.: NET SALES, 2019-2021 ($MILLION)
    FIGURE 75. REVLON, INC.: RESEARCH & DEVELOPMENT EXPENDITURE, 2019-2021 ($MILLION)
    FIGURE 76. REVLON, INC.: REVENUE SHARE BY SEGMENT, 2021 (%)
    FIGURE 77. REVLON, INC.: REVENUE SHARE BY REGION, 2021 (%)
    FIGURE 78. SHISEIDO COMPANY, LIMITED: NET SALES, 2020-2022 ($MILLION)
    FIGURE 79. SHISEIDO COMPANY, LIMITED: REVENUE SHARE BY SEGMENT, 2021 (%)
    FIGURE 80. UNILEVER PLC: NET REVENUE, 2020-2022 ($MILLION)
    FIGURE 81. UNILEVER PLC: RESEARCH & DEVELOPMENT EXPENDITURE, 2020-2022 ($MILLION)
    FIGURE 82. UNILEVER PLC: REVENUE SHARE BY SEGMENT, 2022 (%)
    FIGURE 83. UNILEVER PLC: REVENUE SHARE BY REGION, 2022 (%)
    FIGURE 84. THE ESTEE LAUDER COMPANIES INC.: NET SALES, 2020-2022 ($MILLION)
    FIGURE 85. THE ESTEE LAUDER COMPANIES INC.: RESEARCH & DEVELOPMENT EXPENDITURE, 2020-2022 ($MILLION)
    FIGURE 86. THE ESTEE LAUDER COMPANIES INC.: REVENUE SHARE BY SEGMENT, 2022 (%)
    FIGURE 87. THE ESTEE LAUDER COMPANIES INC.: REVENUE SHARE BY REGION, 2022 (%)


The global skin care products market, which is in its growth stage and contribution to the global skin care products market, would increase significantly within the next six years. Increasing awareness towards skin care among customers has fueled the market. Moreover owing to the urbanization and modern lifestyle, the demand for skin care products has increased over the last decade, and is expected to increase during the forecast period.

High requirement for sun protection, antiaging, blemishes, wrinkles, fine lines, protection from pollution products has attracted several companies to invest in the skin care products industry. Some of the major innovations in the skin care product industry are sunscreen, skin brightening cream, antiaging cream, acne treatment, multi-beneficial skin care product, which further support growth of the market.

Geographically, the global skin care products market is analyzed across North America, Europe, Asia-Pacific, and LAMEA. Asia-Pacific was the highest revenue contributor, valued at $53,641 million in 2016. This region is further expected to attain a market value of $74,385 million by 2024, growing at a CAGR of 4.1%.

PURCHASE OPTIONS

Call or Email us

U.S.-Canada Toll-free: +1-800-792-5285
Int'l : +1-503-894-6022
Europe : +44-845-528-1300
Email : help@alliedmarketresearch.com
 
FREQUENTLY ASKED QUESTIONS?

A. The skin care products market was valued at $170,724.8 million in 2021, and is estimated to reach $241,517.7 million by 2031, registering a CAGR of 3.6% from 2022 to 2031.

A. The global skin care products market registered a CAGR of 3.6% from 2022 to 2031.

A. Raise the query and paste the link of the specific report and our sales executive will revert with the sample.

A. The forecast period in the skin care products market report is from 2022 to 2031.

A. The top companies that hold the market share in the skin care products market include Estee Lauder Companies Inc., LVMH, LOREAL S. A., and Procter & Gamble.

A. The skin care products market report has 4 segments. The segments are type, end user, price point, and distribution channel.

A. The emerging countries in the skin care products market are likely to grow at a CAGR of more than 6.5% from 2022 to 2031.

A. Following COVID-19, greater consumers focus on skincare activities, and an increase in consumers’ inclination towards improving skin health while at home led to the growth of the market. Retention of skin care habits in the post pandemic period will further provide a boost to the skin care market.

A. Europe will dominate the skin care products market by the end of 2031.

Looking for Customization?

 Customization Request

Have a Question?

 Speak with Analyst

Any Confusion?

 Inquire Before Buying

Have a glance of the Report

  Request Sample
RELATED TAGS

Purchase Full Report of
Skin Care Products Market

Start reading instantly.
This Report and over 67,069+ more Reports, Available with Avenue Library. T&C*.

  • Online Only
  • $3,570
  • Online cloud access only
  • Restricted print, copy, paste & download
  • Read only
  • Free industry update
    (Within 180 days)
  • Free report update in next update cycle
    (Apr 2024 - Apr 2025)
  • Data Pack
  • $3,840
  • Restricted to one authorized user
  • One print only
  • Available in
    Excel
  • Free industry update
    (Within 180 days)
  •   Free report update in next update cycle
    (Apr 2024 - Apr 2025)
  • Single User
  • $5,730
  • Restricted to one authorized user
  • One print only
  • Available in
    PDF
  • Free industry update
    (Within 180 days)
  •   Free report update in next update cycle
    (Apr 2024 - Apr 2025)
  • Five Users
  • $6,450
  • Limited to five authorized users
  • Print upto five copies
  • Available in
    PDF
  • Free industry update
    (Within 180 days)
  •   Free report update in next update cycle
    (Apr 2024 - Apr 2025)
  • Enterprise
    License/PDF

  • $9,600
  • Unlimited
    within
    company/enterprise
  • Available in Excel & PDF
  • Free industry update
    (Within 180 days)
  •   Free report update in next update cycle
    (Apr 2024 - Apr 2025)
  • Library
    Membership

  • $999 $ 1,175
    Per User/ Per month/ Billed annually
  • Published Content
    E-access
  • Company Profiles
    E-access
  • Newly Added Content Access
  • 10 PDF
    Downloads
  • 5 Excel Data
    Pack Downloads
  • 250 Company Profiles PDF Downloads
  • Buy Now

*Taxes/Fees, if applicable will be added during checkout. All prices in USD

RELATED REPORTS
 

Why Allied Market Research?


Infallible Methodology

To ensure high-level data integrity, accurate analysis, and impeccable forecasts

Analyst Support

For complete satisfaction

Customization

On-demand customization of scope of the report to exactly meet your needs

TARGETED MARKET VIEW

Targeted market view to provide pertinent information and save time of readers

Get fresh content delivered

Get insights on topics that are crucial for your business. Stay abreast of your interest areas.

Get Industry Data Alerts

Why Allied Market Research?

Infallible Methodology

To ensure high-level data integrity, accurate analysis, and impeccable forecasts

Analyst Support

For complete satisfaction

Customization

On-demand customization of scope of the report to exactly meet your needs

TARGETED MARKET VIEW

Targeted market view to provide pertinent information and save time of readers