0
2022
Chilled And Deli Food Market

Chilled and Deli Food Market

by Product Type(Meats, Pies & Savory Appetizers, Pre-Packed Sandwiches, Prepared Salads, and Others), Packaging (Tins, Cans, Plastic Packs, Cardboard, and Others), and Distribution Channel (Hypermarkets/Supermarkets, Specialty Stores, Food Service Outlets, Online Channel, and Others): Global Opportunity Analysis and Industry Forecast, 2022-2031

✷  Report Code: A01506
Feb 2022 | Pages: 280
Tables: 141
Charts: 63
  • Formats*:

  • pdf

    Single User License, Five User
    License & Enterprise User License

  • xls

    Data Pack Excel License

  • ppt

    It comes with the additional cost
    of $2500.00 contact sales.


COVID-19

Pandemic disrupted the entire world and affected many industries.

Get detailed COVID-19 impact analysis on the Chilled And Deli Food Market

Request Now !

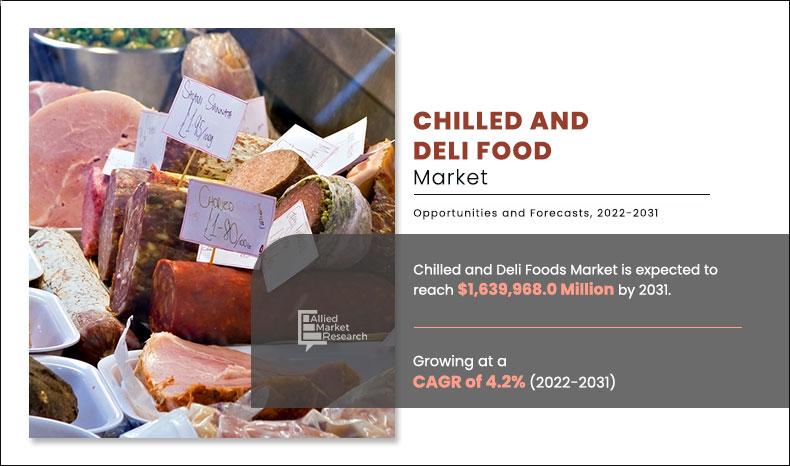
The global chilled and deli food market was valued at $888,628 million in 2020, and is projected to reach $1,639,968 million by 2031, registering a CAGR of 4.2% from 2022 to 2031. Chilled and deli food are ready-to -eat products, which can be easily consumed and stored at a low temperature. The global chilled and deli food market size is expected to witness notable growth in the coming years due to increase in demand for ready-to-cook food items. Chilled and deli food has become an important part of the consumers life.  In addition, change in lifestyle demographics is another driving factor for the growth of this market.

The COVID-19 pandemic disrupted food & beverage supply chains all across the globe. Consumption habits of consumers have changed by the perception of the risk associated with COVID-19. Consumer's fear of potential food & beverages shortages has fueled the hoarding trend. The hoarding had led to an increase in demand for chilled and deli food products and the companies were unable to meet the market demand. The vaccination drive and lockdown practices to limit the spread of the virus globally are likely to aid in the growth of the chilled and deli food market in regaining its position in the food & beverage sector.

However, the usage of nitrates and nitrites in deli food products cause cardiovascular problem in consumers that is negatively impacting the chilled and deli food market growth. Consumers look for the products that are nitrates free and are good in quality.

Chilled-and-Deli-Food-Market

The chilled and deli food market is segmented on the basis of product type, packaging, distribution channel, and region. On the basis of product type, the market is segmented into meats, pies & savory appetizers, pre-packed sandwiches, prepared salads, and others. By packaging, the market is segmented into tins, cans, plastic packs, cardboard, and others. On the basis of distribution channel, the market is segmented into hypermarkets/supermarkets, convenience stores, specialty stores, food service outlets, online channel, and others. Region wise, the market is analyzed across North America (the U.S., Canada, and Mexico), Europe (Germany, UK, France, Italy, Russia, Spain, and rest of Europe), Asia-Pacific (China, Japan, India, Australia, South Korea, and rest of Asia-Pacific), and LAMEA (Brazil, Saudi Arabia, South Africa, and rest of LAMEA).

According to chilled and deli food market trends, on the basis of product type, the pies & savory appetizers segment dominated the global market in 2020 and is expected to be dominant during the chilled and deli food market forecast period. The pies & savory appetizers segment was valued at $255,674.2 million in 2020 and is expected to reach $454,259.2 million by 2031, with a CAGR of 3.9%. Pies & savory appetizers are the most popular deli food products offered by the manufacturers from all across the globe. The introduction of savory appetizers in meat variants has provided a unique taste that has grabbed the interest of the consumers.

On the basis of packaging, the plastic packs segment was valued at $378,159.2 million in 2020 and is expected to reach $631,589.5 million by 2031, with a CAGR of 3.3%. Plastic packs are a reliable material for packaging as it is cost-effective and provides complete protection from cross contaminations.

Chilled and Deli Food Market
By Product Type

Your browser does not support the canvas element.

Prepared Salads segment would exhibit the highest CAGR of 5.5% during 2022-2031, owing to the increased demand of healthy food alternatives by the consumers in order to maintain proper health condition.

Get more information on this report : Request Sample Pages

According to the chilled and deli food market analysis, by distribution channel, the online channel segment was valued at $94,306.6 million in 2020 and is projected to reach $204,459.8 million by 2031, registering a CAGR of 5.8%. Factors such as changes in purchasing habits and the increase inpopularity of e-commerce channels have boosted the distribution of chilled and deli foods through online channels. The emerging economies, such as India and China, have witnessed significant adoption of chilled and deli foods due to urbanization, economic growth, and surge in middle-class population.

Chilled and Deli Food Market
By Packaging

Your browser does not support the canvas element.

Others segment would exhibit the highest CAGR of 6.1% during 2022-2031, owing to the increased usage laminated papers by manufacturing companies for packaging of deli food to tackle environmental degradation.

Get more information on this report : Request Sample Pages

Region wise, North America dominated the chilled and deli food market in 2021, and is expected to be dominant during the forecast period. The dominance in the market is largely due to existence of deli food operations in North America, and the availability of several variants of products and flavors that are preferred by the consumers according to their taste. Increase in demand for ready-to-eat foods in the population of North America drives the growth of the chilled and deli food products.

Chilled and Deli Food Market
By Distribution Channel

Your browser does not support the canvas element.

Online Channel segment would exhibit the highest CAGR of 5.8% during 2022-2031, owing to the increased association of internet and e-shopping with consumers in developing region.

Get more information on this report : Request Sample Pages

The players operating in the global chilled and deli food market have adopted various developmental strategies to expand their chilled and deli food market share, increase profitability, and remain competitive in the market. The key players profiled in this report include Astral Foods Ltd., BRF S.A., Hormel Foods Corporation, JBS S.A., Samworth Brothers Limited, The Kraft Heinz Company, Tyson Foods, Inc, Waitrose & Partners, Wm Morrison Supermarkets, and 2 Sisters Food Group.

Chilled and Deli Food Market
By Region

2031
Europe 
North America
Asia Pacific
LAMEA

Asia-Pacific would exhibit the highest CAGR of 5.6% during 2022-2031, owing to the increase in westernization and adaption of innovative chilled and deli food products among consumers in the region.

Get more information on this report : Request Sample Pages

Key Benefits For Stakeholders

  • The report provides a quantitative analysis of the current market trends, estimations, and dynamics of the market size from 2022-2031 to identify the prevailing opportunities.
  • Porter’s five forces analysis highlights the potency of buyers and suppliers to enable stakeholders to make profit-oriented business decisions and strengthen their supplier–buyer network.
  • In-depth analysis and the market size and segmentation assist to determine the prevailing chilled and deli food market opportunities.
  • The major countries in each region are mapped according to their revenue contribution to the market.
  • The market player positioning segment facilitates benchmarking and provides a clear understanding of the present position of the market players in the chilled and deli food industry.

Chilled and Deli Food Market Report Highlights

Aspects Details
By Product Type
  • Meats
  • Pies & Savory Appetizers
  • Pre-packed Sandwiches
  • Prepared Salads
  • Others
By Packaging
  • Tins
  • Cans
  • Plastic packs
  • Cardboard
  • Others
By Distribution Channel
  • Hypermarkets/Supermarkets
  • Specialty Stores
  • Food Service Outlets
  • Online Channel
  • Others
By Region
  • North America  (U.S., Canada, Mexico)
  • Europe  (Germany, UK, France, Italy, Russia, Spain, Rest of Europe)
  • Asia-Pacific  (China, Japan, India, Australia, South Korea, Rest of Asia-Pacific)
  • LAMEA  (Brazil, Saudi Arabia, South Africa, Rest of LAMEA)
 

CHAPTER 1:  INTRODUCTION

1.1.Report Description
1.2.Key Market Segments
1.3.Key Benefits
1.4.Research Methodology

1.4.1.Primary Research
1.4.2.Secondary Research
1.4.3.Analyst Tools and Models

CHAPTER 2:  EXECUTIVE SUMMARY

2.1.CXO Perspective

CHAPTER 3:  MARKET LANDSCAPE

3.1.Market Definition and Scope
3.2.Key Findings

3.2.1.Top Investment Pockets
3.2.2.Top Winning Strategies

3.3.Porter's Five Forces Analysis

3.3.1.Bargaining Power of Suppliers
3.3.2.Threat of New Entrants
3.3.3.Threat of Substitutes
3.3.4.Competitive Rivalry
3.3.5.Bargaining Power among Buyers

3.4.Market Share Analysis/Top Player Positioning

3.4.1.Market Share Analysis/Top Player Positioning 2020

3.5.Market Dynamics

3.5.1.Drivers
3.5.2.Restraints
3.5.3.Opportunities

3.6.  COVID-19 Impact Analysis
3.7.Pricing Analysis
3.8.Value Chain Analysis
3.9. Market Share Analysis
3.10.Competitive Heatmap

CHAPTER 4:  CHILLED AND DELI FOOD MARKET, BY PRODUCT TYPE

4.1.Market Overview

4.1.1Market Size and Forecast, By Product Type

4.2.Meats

4.2.1.Key Market Trends, Growth Factors and Opportunities
4.2.2.Market Size and Forecast, By Region 
4.2.3.Market Share Analysis, By Country

4.3.Pies And Savory Appetizers

4.3.1.Key Market Trends, Growth Factors and Opportunities
4.3.2.Market Size and Forecast, By Region 
4.3.3.Market Share Analysis, By Country

4.4.Pre-Packed Sandwiches

4.4.1.Key Market Trends, Growth Factors and Opportunities
4.4.2.Market Size and Forecast, By Region 
4.4.3.Market Share Analysis, By Country

4.5.Prepared Salads

4.5.1.Key Market Trends, Growth Factors and Opportunities
4.5.2.Market Size and Forecast, By Region 
4.5.3.Market Share Analysis, By Country

4.6.Others

4.6.1.Key Market Trends, Growth Factors and Opportunities
4.6.2.Market Size and Forecast, By Region 
4.6.3.Market Share Analysis, By Country

CHAPTER 5:  CHILLED AND DELI FOOD MARKET, BY PACKAGING

5.1.Market Overview

5.1.1Market Size and Forecast, By Packaging

5.2.Tins

5.2.1.Key Market Trends, Growth Factors and Opportunities
5.2.2.Market Size and Forecast, By Region 
5.2.3.Market Share Analysis, By Country

5.3.Cans

5.3.1.Key Market Trends, Growth Factors and Opportunities
5.3.2.Market Size and Forecast, By Region 
5.3.3.Market Share Analysis, By Country

5.4.Plastic Packs

5.4.1.Key Market Trends, Growth Factors and Opportunities
5.4.2.Market Size and Forecast, By Region 
5.4.3.Market Share Analysis, By Country

5.5.Cardboard

5.5.1.Key Market Trends, Growth Factors and Opportunities
5.5.2.Market Size and Forecast, By Region 
5.5.3.Market Share Analysis, By Country

5.6.Others

5.6.1.Key Market Trends, Growth Factors and Opportunities
5.6.2.Market Size and Forecast, By Region 
5.6.3.Market Share Analysis, By Country

CHAPTER 6:  CHILLED AND DELI FOOD MARKET, BY DISTRIBUTION CHANNEL

6.1.Market Overview

6.1.1Market Size and Forecast, By Distribution Channel

6.2.Hypermarkets/Supermarkets

6.2.1.Key Market Trends, Growth Factors and Opportunities
6.2.2.Market Size and Forecast, By Region 
6.2.3.Market Share Analysis, By Country

6.3.Specialty Stores

6.3.1.Key Market Trends, Growth Factors and Opportunities
6.3.2.Market Size and Forecast, By Region 
6.3.3.Market Share Analysis, By Country

6.4.Food Service Outlets

6.4.1.Key Market Trends, Growth Factors and Opportunities
6.4.2.Market Size and Forecast, By Region 
6.4.3.Market Share Analysis, By Country

6.5.Online Channel

6.5.1.Key Market Trends, Growth Factors and Opportunities
6.5.2.Market Size and Forecast, By Region 
6.5.3.Market Share Analysis, By Country

6.6.Others

6.6.1.Key Market Trends, Growth Factors and Opportunities
6.6.2.Market Size and Forecast, By Region 
6.6.3.Market Share Analysis, By Country

CHAPTER 7:  CHILLED AND DELI FOOD MARKET, BY REGION

7.1.Market Overview

7.1.1Market Size and Forecast, By Region

7.2.Europe

7.2.1.Key Market Trends and Opportunities
7.2.2.Market Size and Forecast, By Product Type
7.2.3.Market Size and Forecast, By Packaging
7.2.4.Market Size and Forecast, By Distribution Channel
7.2.5.Market Size and Forecast, By Country
7.2.6.Germany Chilled And Deli Food Market

7.2.6.1.Market Size and Forecast, By Product Type
7.2.6.2.Market Size and Forecast, By Packaging
7.2.6.3.Market Size and Forecast, By Distribution Channel

7.2.7.Uk Chilled And Deli Food Market

7.2.7.1.Market Size and Forecast, By Product Type
7.2.7.2.Market Size and Forecast, By Packaging
7.2.7.3.Market Size and Forecast, By Distribution Channel

7.2.8.France Chilled And Deli Food Market

7.2.8.1.Market Size and Forecast, By Product Type
7.2.8.2.Market Size and Forecast, By Packaging
7.2.8.3.Market Size and Forecast, By Distribution Channel

7.2.9.Italy Chilled And Deli Food Market

7.2.9.1.Market Size and Forecast, By Product Type
7.2.9.2.Market Size and Forecast, By Packaging
7.2.9.3.Market Size and Forecast, By Distribution Channel

7.2.10.Russia Chilled And Deli Food Market

7.2.10.1.Market Size and Forecast, By Product Type
7.2.10.2.Market Size and Forecast, By Packaging
7.2.10.3.Market Size and Forecast, By Distribution Channel

7.2.11.Spain Chilled And Deli Food Market

7.2.11.1.Market Size and Forecast, By Product Type
7.2.11.2.Market Size and Forecast, By Packaging
7.2.11.3.Market Size and Forecast, By Distribution Channel

7.2.12.Rest Of Europe Chilled And Deli Food Market

7.2.12.1.Market Size and Forecast, By Product Type
7.2.12.2.Market Size and Forecast, By Packaging
7.2.12.3.Market Size and Forecast, By Distribution Channel

7.3.Asia-Pacific

7.3.1.Key Market Trends and Opportunities
7.3.2.Market Size and Forecast, By Product Type
7.3.3.Market Size and Forecast, By Packaging
7.3.4.Market Size and Forecast, By Distribution Channel
7.3.5.Market Size and Forecast, By Country
7.3.6.China Chilled And Deli Food Market

7.3.6.1.Market Size and Forecast, By Product Type
7.3.6.2.Market Size and Forecast, By Packaging
7.3.6.3.Market Size and Forecast, By Distribution Channel

7.3.7.Japan Chilled And Deli Food Market

7.3.7.1.Market Size and Forecast, By Product Type
7.3.7.2.Market Size and Forecast, By Packaging
7.3.7.3.Market Size and Forecast, By Distribution Channel

7.3.8.India Chilled And Deli Food Market

7.3.8.1.Market Size and Forecast, By Product Type
7.3.8.2.Market Size and Forecast, By Packaging
7.3.8.3.Market Size and Forecast, By Distribution Channel

7.3.9.South Korea Chilled And Deli Food Market

7.3.9.1.Market Size and Forecast, By Product Type
7.3.9.2.Market Size and Forecast, By Packaging
7.3.9.3.Market Size and Forecast, By Distribution Channel

7.3.10.Australia Chilled And Deli Food Market

7.3.10.1.Market Size and Forecast, By Product Type
7.3.10.2.Market Size and Forecast, By Packaging
7.3.10.3.Market Size and Forecast, By Distribution Channel

7.3.11.Rest of Asia Pacific Chilled And Deli Food Market

7.3.11.1.Market Size and Forecast, By Product Type
7.3.11.2.Market Size and Forecast, By Packaging
7.3.11.3.Market Size and Forecast, By Distribution Channel

7.4.North America

7.4.1.Key Market Trends and Opportunities
7.4.2.Market Size and Forecast, By Product Type
7.4.3.Market Size and Forecast, By Packaging
7.4.4.Market Size and Forecast, By Distribution Channel
7.4.5.Market Size and Forecast, By Country
7.4.6.United States Chilled And Deli Food Market

7.4.6.1.Market Size and Forecast, By Product Type
7.4.6.2.Market Size and Forecast, By Packaging
7.4.6.3.Market Size and Forecast, By Distribution Channel

7.4.7.Canada Chilled And Deli Food Market

7.4.7.1.Market Size and Forecast, By Product Type
7.4.7.2.Market Size and Forecast, By Packaging
7.4.7.3.Market Size and Forecast, By Distribution Channel

7.4.8.Mexico Chilled And Deli Food Market

7.4.8.1.Market Size and Forecast, By Product Type
7.4.8.2.Market Size and Forecast, By Packaging
7.4.8.3.Market Size and Forecast, By Distribution Channel

7.5.LAMEA

7.5.1.Key Market Trends and Opportunities
7.5.2.Market Size and Forecast, By Product Type
7.5.3.Market Size and Forecast, By Packaging
7.5.4.Market Size and Forecast, By Distribution Channel
7.5.5.Market Size and Forecast, By Country
7.5.6.Brazil Chilled And Deli Food Market

7.5.6.1.Market Size and Forecast, By Product Type
7.5.6.2.Market Size and Forecast, By Packaging
7.5.6.3.Market Size and Forecast, By Distribution Channel

7.5.7.Saudi Arabia Chilled And Deli Food Market

7.5.7.1.Market Size and Forecast, By Product Type
7.5.7.2.Market Size and Forecast, By Packaging
7.5.7.3.Market Size and Forecast, By Distribution Channel

7.5.8.South Africa Chilled And Deli Food Market

7.5.8.1.Market Size and Forecast, By Product Type
7.5.8.2.Market Size and Forecast, By Packaging
7.5.8.3.Market Size and Forecast, By Distribution Channel

7.5.9.Rest of LAMEA Chilled And Deli Food Market

7.5.9.1.Market Size and Forecast, By Product Type
7.5.9.2.Market Size and Forecast, By Packaging
7.5.9.3.Market Size and Forecast, By Distribution Channel

CHAPTER 8:  COMPANY PROFILES

8.1.Astral Foods Ltd.

8.1.1.Company Overview
8.1.2.Key Executives
8.1.3.Company snapshot
8.1.4.Operating business segments
8.1.5.Product portfolio
8.1.6.Business Performance
8.1.7.Key Strategic Moves and Developments

8.2.BRF S.A.

8.2.1.Company Overview
8.2.2.Key Executives
8.2.3.Company snapshot
8.2.4.Operating business segments
8.2.5.Product portfolio
8.2.6.Business Performance
8.2.7.Key Strategic Moves and Developments

8.3.Hormel Foods Corporation

8.3.1.Company Overview
8.3.2.Key Executives
8.3.3.Company snapshot
8.3.4.Operating business segments
8.3.5.Product portfolio
8.3.6.Business Performance
8.3.7.Key Strategic Moves and Developments

8.4.JBS S.A.

8.4.1.Company Overview
8.4.2.Key Executives
8.4.3.Company snapshot
8.4.4.Operating business segments
8.4.5.Product portfolio
8.4.6.Business Performance
8.4.7.Key Strategic Moves and Developments

8.5.Samworth Brothers Limited

8.5.1.Company Overview
8.5.2.Key Executives
8.5.3.Company snapshot
8.5.4.Operating business segments
8.5.5.Product portfolio
8.5.6.Business Performance
8.5.7.Key Strategic Moves and Developments

8.6.The Kraft Heinz Company

8.6.1.Company Overview
8.6.2.Key Executives
8.6.3.Company snapshot
8.6.4.Operating business segments
8.6.5.Product portfolio
8.6.6.Business Performance
8.6.7.Key Strategic Moves and Developments

8.7.Tyson Foods, Inc

8.7.1.Company Overview
8.7.2.Key Executives
8.7.3.Company snapshot
8.7.4.Operating business segments
8.7.5.Product portfolio
8.7.6.Business Performance
8.7.7.Key Strategic Moves and Developments

8.8.Waitrose And Partners

8.8.1.Company Overview
8.8.2.Key Executives
8.8.3.Company snapshot
8.8.4.Operating business segments
8.8.5.Product portfolio
8.8.6.Business Performance
8.8.7.Key Strategic Moves and Developments

8.9.Wm Morrison Supermarkets

8.9.1.Company Overview
8.9.2.Key Executives
8.9.3.Company snapshot
8.9.4.Operating business segments
8.9.5.Product portfolio
8.9.6.Business Performance
8.9.7.Key Strategic Moves and Developments

8.10.2 Sisters Food Group.

8.10.1.Company Overview
8.10.2.Key Executives
8.10.3.Company snapshot
8.10.4.Operating business segments
8.10.5.Product portfolio
8.10.6.Business Performance
8.10.7.Key Strategic Moves and Developments 

Note: *Details on financial performance and strategic moves and developments may not be captured for
unlisted companies.
*List of companies profiled in this TOC is tentative and may change after detailed analysis.
*Market size and forecast will be provided from 2020-2031, and forecast period would be 2022-2031.
*The provided information and segments are for representation purpose only. The actual information
delivered would change significantly as per findings during the course of study and upon its
completion.

LIST OF TABLES

TABLE 1.GLOBAL CHILLED AND DELI FOOD MARKET, BY PRODUCT TYPE, 2020-2031 ($MILLION)
TABLE 2.GLOBAL CHILLED AND DELI FOOD MARKET FOR MEATS, BY REGION, 2020-2031 ($MILLION)
TABLE 3.GLOBAL CHILLED AND DELI FOOD MARKET FOR PIES AND SAVORY APPETIZERS, BY REGION, 2020-2031 ($MILLION)
TABLE 4.GLOBAL CHILLED AND DELI FOOD MARKET FOR PRE-PACKED SANDWICHES, BY REGION, 2020-2031 ($MILLION)
TABLE 5.GLOBAL CHILLED AND DELI FOOD MARKET FOR PREPARED SALADS, BY REGION, 2020-2031 ($MILLION)
TABLE 6.GLOBAL CHILLED AND DELI FOOD MARKET FOR OTHERS, BY REGION, 2020-2031 ($MILLION)
TABLE 7.GLOBAL CHILLED AND DELI FOOD MARKET, BY PACKAGING, 2020-2031 ($MILLION)
TABLE 8.GLOBAL CHILLED AND DELI FOOD MARKET FOR TINS, BY REGION, 2020-2031 ($MILLION)
TABLE 9.GLOBAL CHILLED AND DELI FOOD MARKET FOR CANS, BY REGION, 2020-2031 ($MILLION)
TABLE 10.GLOBAL CHILLED AND DELI FOOD MARKET FOR PLASTIC PACKS, BY REGION, 2020-2031 ($MILLION)
TABLE 11.GLOBAL CHILLED AND DELI FOOD MARKET FOR CARDBOARD, BY REGION, 2020-2031 ($MILLION)
TABLE 12.GLOBAL CHILLED AND DELI FOOD MARKET FOR OTHERS, BY REGION, 2020-2031 ($MILLION)
TABLE 13.GLOBAL CHILLED AND DELI FOOD MARKET, BY DISTRIBUTION CHANNEL, 2020-2031 ($MILLION)
TABLE 14.GLOBAL CHILLED AND DELI FOOD MARKET FOR HYPERMARKETS/SUPERMARKETS, BY REGION, 2020-2031 ($MILLION)
TABLE 15.GLOBAL CHILLED AND DELI FOOD MARKET FOR SPECIALTY STORES, BY REGION, 2020-2031 ($MILLION)
TABLE 16.GLOBAL CHILLED AND DELI FOOD MARKET FOR FOOD SERVICE OUTLETS, BY REGION, 2020-2031 ($MILLION)
TABLE 17.GLOBAL CHILLED AND DELI FOOD MARKET FOR ONLINE CHANNEL, BY REGION, 2020-2031 ($MILLION)
TABLE 18.GLOBAL CHILLED AND DELI FOOD MARKET FOR OTHERS, BY REGION, 2020-2031 ($MILLION)
TABLE 19.GLOBAL CHILLED AND DELI FOOD MARKET, BY REGION, 2020-2031 ($MILLION)
TABLE 20.EUROPE CHILLED AND DELI FOOD, BY PRODUCT TYPE, 2020-2031 ($MILLION)
TABLE 21.EUROPE CHILLED AND DELI FOOD, BY PACKAGING, 2020-2031 ($MILLION)
TABLE 22.EUROPE CHILLED AND DELI FOOD, BY DISTRIBUTION CHANNEL, 2020-2031 ($MILLION)
TABLE 23.GERMANY CHILLED AND DELI FOOD, BY PRODUCT TYPE, 2020-2031 ($MILLION)
TABLE 24.GERMANY CHILLED AND DELI FOOD, BY PACKAGING, 2020-2031 ($MILLION)
TABLE 25.GERMANY CHILLED AND DELI FOOD, BY DISTRIBUTION CHANNEL, 2020-2031 ($MILLION)
TABLE 26.UK CHILLED AND DELI FOOD, BY PRODUCT TYPE, 2020-2031 ($MILLION)
TABLE 27.UK CHILLED AND DELI FOOD, BY PACKAGING, 2020-2031 ($MILLION)
TABLE 28.UK CHILLED AND DELI FOOD, BY DISTRIBUTION CHANNEL, 2020-2031 ($MILLION)
TABLE 29.FRANCE CHILLED AND DELI FOOD, BY PRODUCT TYPE, 2020-2031 ($MILLION)
TABLE 30.FRANCE CHILLED AND DELI FOOD, BY PACKAGING, 2020-2031 ($MILLION)
TABLE 31.FRANCE CHILLED AND DELI FOOD, BY DISTRIBUTION CHANNEL, 2020-2031 ($MILLION)
TABLE 32.ITALY CHILLED AND DELI FOOD, BY PRODUCT TYPE, 2020-2031 ($MILLION)
TABLE 33.ITALY CHILLED AND DELI FOOD, BY PACKAGING, 2020-2031 ($MILLION)
TABLE 34.ITALY CHILLED AND DELI FOOD, BY DISTRIBUTION CHANNEL, 2020-2031 ($MILLION)
TABLE 35.RUSSIA CHILLED AND DELI FOOD, BY PRODUCT TYPE, 2020-2031 ($MILLION)
TABLE 36.RUSSIA CHILLED AND DELI FOOD, BY PACKAGING, 2020-2031 ($MILLION)
TABLE 37.RUSSIA CHILLED AND DELI FOOD, BY DISTRIBUTION CHANNEL, 2020-2031 ($MILLION)
TABLE 38.SPAIN CHILLED AND DELI FOOD, BY PRODUCT TYPE, 2020-2031 ($MILLION)
TABLE 39.SPAIN CHILLED AND DELI FOOD, BY PACKAGING, 2020-2031 ($MILLION)
TABLE 40.SPAIN CHILLED AND DELI FOOD, BY DISTRIBUTION CHANNEL, 2020-2031 ($MILLION)
TABLE 41.REST OF EUROPE CHILLED AND DELI FOOD, BY PRODUCT TYPE, 2020-2031 ($MILLION)
TABLE 42.REST OF EUROPE CHILLED AND DELI FOOD, BY PACKAGING, 2020-2031 ($MILLION)
TABLE 43.REST OF EUROPE CHILLED AND DELI FOOD, BY DISTRIBUTION CHANNEL, 2020-2031 ($MILLION)
TABLE 44.ASIA-PACIFIC CHILLED AND DELI FOOD, BY PRODUCT TYPE, 2020-2031 ($MILLION)
TABLE 45.ASIA-PACIFIC CHILLED AND DELI FOOD, BY PACKAGING, 2020-2031 ($MILLION)
TABLE 46.ASIA-PACIFIC CHILLED AND DELI FOOD, BY DISTRIBUTION CHANNEL, 2020-2031 ($MILLION)
TABLE 47.CHINA CHILLED AND DELI FOOD, BY PRODUCT TYPE, 2020-2031 ($MILLION)
TABLE 48.CHINA CHILLED AND DELI FOOD, BY PACKAGING, 2020-2031 ($MILLION)
TABLE 49.CHINA CHILLED AND DELI FOOD, BY DISTRIBUTION CHANNEL, 2020-2031 ($MILLION)
TABLE 50.JAPAN CHILLED AND DELI FOOD, BY PRODUCT TYPE, 2020-2031 ($MILLION)
TABLE 51.JAPAN CHILLED AND DELI FOOD, BY PACKAGING, 2020-2031 ($MILLION)
TABLE 52.JAPAN CHILLED AND DELI FOOD, BY DISTRIBUTION CHANNEL, 2020-2031 ($MILLION)
TABLE 53.INDIA CHILLED AND DELI FOOD, BY PRODUCT TYPE, 2020-2031 ($MILLION)
TABLE 54.INDIA CHILLED AND DELI FOOD, BY PACKAGING, 2020-2031 ($MILLION)
TABLE 55.INDIA CHILLED AND DELI FOOD, BY DISTRIBUTION CHANNEL, 2020-2031 ($MILLION)
TABLE 56.SOUTH KOREA CHILLED AND DELI FOOD, BY PRODUCT TYPE, 2020-2031 ($MILLION)
TABLE 57.SOUTH KOREA CHILLED AND DELI FOOD, BY PACKAGING, 2020-2031 ($MILLION)
TABLE 58.SOUTH KOREA CHILLED AND DELI FOOD, BY DISTRIBUTION CHANNEL, 2020-2031 ($MILLION)
TABLE 59.AUSTRALIA CHILLED AND DELI FOOD, BY PRODUCT TYPE, 2020-2031 ($MILLION)
TABLE 60.AUSTRALIA CHILLED AND DELI FOOD, BY PACKAGING, 2020-2031 ($MILLION)
TABLE 61.AUSTRALIA CHILLED AND DELI FOOD, BY DISTRIBUTION CHANNEL, 2020-2031 ($MILLION)
TABLE 62.REST OF ASIA PACIFIC CHILLED AND DELI FOOD, BY PRODUCT TYPE, 2020-2031 ($MILLION)
TABLE 63.REST OF ASIA PACIFIC CHILLED AND DELI FOOD, BY PACKAGING, 2020-2031 ($MILLION)
TABLE 64.REST OF ASIA PACIFIC CHILLED AND DELI FOOD, BY DISTRIBUTION CHANNEL, 2020-2031 ($MILLION)
TABLE 65.NORTH AMERICA CHILLED AND DELI FOOD, BY PRODUCT TYPE, 2020-2031 ($MILLION)
TABLE 66.NORTH AMERICA CHILLED AND DELI FOOD, BY PACKAGING, 2020-2031 ($MILLION)
TABLE 67.NORTH AMERICA CHILLED AND DELI FOOD, BY DISTRIBUTION CHANNEL, 2020-2031 ($MILLION)
TABLE 68.UNITED STATES CHILLED AND DELI FOOD, BY PRODUCT TYPE, 2020-2031 ($MILLION)
TABLE 69.UNITED STATES CHILLED AND DELI FOOD, BY PACKAGING, 2020-2031 ($MILLION)
TABLE 70.UNITED STATES CHILLED AND DELI FOOD, BY DISTRIBUTION CHANNEL, 2020-2031 ($MILLION)
TABLE 71.CANADA CHILLED AND DELI FOOD, BY PRODUCT TYPE, 2020-2031 ($MILLION)
TABLE 72.CANADA CHILLED AND DELI FOOD, BY PACKAGING, 2020-2031 ($MILLION)
TABLE 73.CANADA CHILLED AND DELI FOOD, BY DISTRIBUTION CHANNEL, 2020-2031 ($MILLION)
TABLE 74.MEXICO CHILLED AND DELI FOOD, BY PRODUCT TYPE, 2020-2031 ($MILLION)
TABLE 75.MEXICO CHILLED AND DELI FOOD, BY PACKAGING, 2020-2031 ($MILLION)
TABLE 76.MEXICO CHILLED AND DELI FOOD, BY DISTRIBUTION CHANNEL, 2020-2031 ($MILLION)
TABLE 77.LAMEA CHILLED AND DELI FOOD, BY PRODUCT TYPE, 2020-2031 ($MILLION)
TABLE 78.LAMEA CHILLED AND DELI FOOD, BY PACKAGING, 2020-2031 ($MILLION)
TABLE 79.LAMEA CHILLED AND DELI FOOD, BY DISTRIBUTION CHANNEL, 2020-2031 ($MILLION)
TABLE 80.BRAZIL CHILLED AND DELI FOOD, BY PRODUCT TYPE, 2020-2031 ($MILLION)
TABLE 81.BRAZIL CHILLED AND DELI FOOD, BY PACKAGING, 2020-2031 ($MILLION)
TABLE 82.BRAZIL CHILLED AND DELI FOOD, BY DISTRIBUTION CHANNEL, 2020-2031 ($MILLION)
TABLE 83.SAUDI ARABIA CHILLED AND DELI FOOD, BY PRODUCT TYPE, 2020-2031 ($MILLION)
TABLE 84.SAUDI ARABIA CHILLED AND DELI FOOD, BY PACKAGING, 2020-2031 ($MILLION)
TABLE 85.SAUDI ARABIA CHILLED AND DELI FOOD, BY DISTRIBUTION CHANNEL, 2020-2031 ($MILLION)
TABLE 86.SOUTH AFRICA CHILLED AND DELI FOOD, BY PRODUCT TYPE, 2020-2031 ($MILLION)
TABLE 87.SOUTH AFRICA CHILLED AND DELI FOOD, BY PACKAGING, 2020-2031 ($MILLION)
TABLE 88.SOUTH AFRICA CHILLED AND DELI FOOD, BY DISTRIBUTION CHANNEL, 2020-2031 ($MILLION)
TABLE 89.REST OF LAMEA CHILLED AND DELI FOOD, BY PRODUCT TYPE, 2020-2031 ($MILLION)
TABLE 90.REST OF LAMEA CHILLED AND DELI FOOD, BY PACKAGING, 2020-2031 ($MILLION)
TABLE 91.REST OF LAMEA CHILLED AND DELI FOOD, BY DISTRIBUTION CHANNEL, 2020-2031 ($MILLION)
TABLE 92.ASTRAL FOODS LTD.: KEY EXECUTIVES
TABLE 93.ASTRAL FOODS LTD.: COMPANY SNAPSHOT
TABLE 94.ASTRAL FOODS LTD.: OPERATING SEGMENTS
TABLE 95.ASTRAL FOODS LTD.: PRODUCT PORTFOLIO
TABLE 96.ASTRAL FOODS LTD.: KEY STRATEGIC MOVES AND DEVELOPMENTS
TABLE 97.BRF S.A.: KEY EXECUTIVES
TABLE 98.BRF S.A.: COMPANY SNAPSHOT
TABLE 99.BRF S.A.: OPERATING SEGMENTS
TABLE 100.BRF S.A.: PRODUCT PORTFOLIO
TABLE 101.BRF S.A.: KEY STRATEGIC MOVES AND DEVELOPMENTS
TABLE 102.HORMEL FOODS CORPORATION: KEY EXECUTIVES
TABLE 103.HORMEL FOODS CORPORATION: COMPANY SNAPSHOT
TABLE 104.HORMEL FOODS CORPORATION: OPERATING SEGMENTS
TABLE 105.HORMEL FOODS CORPORATION: PRODUCT PORTFOLIO
TABLE 106.HORMEL FOODS CORPORATION: KEY STRATEGIC MOVES AND DEVELOPMENTS
TABLE 107.JBS S.A.: KEY EXECUTIVES
TABLE 108.JBS S.A.: COMPANY SNAPSHOT
TABLE 109.JBS S.A.: OPERATING SEGMENTS
TABLE 110.JBS S.A.: PRODUCT PORTFOLIO
TABLE 111.JBS S.A.: KEY STRATEGIC MOVES AND DEVELOPMENTS
TABLE 112.SAMWORTH BROTHERS LIMITED: KEY EXECUTIVES
TABLE 113.SAMWORTH BROTHERS LIMITED: COMPANY SNAPSHOT
TABLE 114.SAMWORTH BROTHERS LIMITED: OPERATING SEGMENTS
TABLE 115.SAMWORTH BROTHERS LIMITED: PRODUCT PORTFOLIO
TABLE 116.SAMWORTH BROTHERS LIMITED: KEY STRATEGIC MOVES AND DEVELOPMENTS
TABLE 117.THE KRAFT HEINZ COMPANY: KEY EXECUTIVES
TABLE 118.THE KRAFT HEINZ COMPANY: COMPANY SNAPSHOT
TABLE 119.THE KRAFT HEINZ COMPANY: OPERATING SEGMENTS
TABLE 120.THE KRAFT HEINZ COMPANY: PRODUCT PORTFOLIO
TABLE 121.THE KRAFT HEINZ COMPANY: KEY STRATEGIC MOVES AND DEVELOPMENTS
TABLE 122.TYSON FOODS, INC: KEY EXECUTIVES
TABLE 123.TYSON FOODS, INC: COMPANY SNAPSHOT
TABLE 124.TYSON FOODS, INC: OPERATING SEGMENTS
TABLE 125.TYSON FOODS, INC: PRODUCT PORTFOLIO
TABLE 126.TYSON FOODS, INC: KEY STRATEGIC MOVES AND DEVELOPMENTS
TABLE 127.WAITROSE AND PARTNERS: KEY EXECUTIVES
TABLE 128.WAITROSE AND PARTNERS: COMPANY SNAPSHOT
TABLE 129.WAITROSE AND PARTNERS: OPERATING SEGMENTS
TABLE 130.WAITROSE AND PARTNERS: PRODUCT PORTFOLIO
TABLE 131.WAITROSE AND PARTNERS: KEY STRATEGIC MOVES AND DEVELOPMENTS
TABLE 132.WM MORRISON SUPERMARKETS: KEY EXECUTIVES
TABLE 133.WM MORRISON SUPERMARKETS: COMPANY SNAPSHOT
TABLE 134.WM MORRISON SUPERMARKETS: OPERATING SEGMENTS
TABLE 135.WM MORRISON SUPERMARKETS: PRODUCT PORTFOLIO
TABLE 136.WM MORRISON SUPERMARKETS: KEY STRATEGIC MOVES AND DEVELOPMENTS
TABLE 137.2 SISTERS FOOD GROUP.: KEY EXECUTIVES
TABLE 138.2 SISTERS FOOD GROUP.: COMPANY SNAPSHOT
TABLE 139.2 SISTERS FOOD GROUP.: OPERATING SEGMENTS
TABLE 140.2 SISTERS FOOD GROUP.: PRODUCT PORTFOLIO
TABLE 141.2 SISTERS FOOD GROUP.: KEY STRATEGIC MOVES AND DEVELOPMENTS

LIST OF FIGURES

FIGURE 1.GLOBAL CHILLED AND DELI FOOD MARKET SEGMENTATION
FIGURE 2.GLOBAL CHILLED AND DELI FOOD MARKET
FIGURE 3.SEGMENTATION CHILLED AND DELI FOOD MARKET
FIGURE 4.TOP INVESTMENT POCKET IN CHILLED AND DELI FOOD MARKET
FIGURE 5.TOP WINNING STRATEGIES, 2019-2021*
FIGURE 6.TOP WINNING STRATEGIES, BY DEVELOPMENT, 2019-2021(%)
FIGURE 7.TOP WINNING STRATEGIES, BY COMPANY, 2019-2021*
FIGURE 8.MODERATE BARGAINING POWER OF BUYERS
FIGURE 9.MODERATE BARGAINING POWER OF SUPPLIERS
FIGURE 10.MODERATE THREAT OF NEW ENTRANTS
FIGURE 11.LOW THREAT OF SUBSTITUTION
FIGURE 12.HIGH COMPETITIVE RIVALRY
FIGURE 13.TOP PLAYER POSITIONING, 2020
FIGURE 14.MARKET SHARE ANALYSIS, 2020
FIGURE 15.RESTRAINTS AND DRIVERS: CHILLED AND DELI FOOD MARKET
FIGURE 16.CHILLED AND DELI FOOD MARKET SEGMENTATION, BY PRODUCT TYPE
FIGURE 17.CHILLED AND DELI FOOD MARKET FOR MEATS, BY COUNTRY, 2020-2031 ($MILLION)
FIGURE 18.CHILLED AND DELI FOOD MARKET FOR PIES AND SAVORY APPETIZERS, BY COUNTRY, 2020-2031 ($MILLION)
FIGURE 19.CHILLED AND DELI FOOD MARKET FOR PRE-PACKED SANDWICHES, BY COUNTRY, 2020-2031 ($MILLION)
FIGURE 20.CHILLED AND DELI FOOD MARKET FOR PREPARED SALADS, BY COUNTRY, 2020-2031 ($MILLION)
FIGURE 21.CHILLED AND DELI FOOD MARKET FOR OTHERS, BY COUNTRY, 2020-2031 ($MILLION)
FIGURE 22.CHILLED AND DELI FOOD MARKET SEGMENTATION, BY PACKAGING
FIGURE 23.CHILLED AND DELI FOOD MARKET FOR TINS, BY COUNTRY, 2020-2031 ($MILLION)
FIGURE 24.CHILLED AND DELI FOOD MARKET FOR CANS, BY COUNTRY, 2020-2031 ($MILLION)
FIGURE 25.CHILLED AND DELI FOOD MARKET FOR PLASTIC PACKS, BY COUNTRY, 2020-2031 ($MILLION)
FIGURE 26.CHILLED AND DELI FOOD MARKET FOR CARDBOARD, BY COUNTRY, 2020-2031 ($MILLION)
FIGURE 27.CHILLED AND DELI FOOD MARKET FOR OTHERS, BY COUNTRY, 2020-2031 ($MILLION)
FIGURE 28.CHILLED AND DELI FOOD MARKET SEGMENTATION, BY DISTRIBUTION CHANNEL
FIGURE 29.CHILLED AND DELI FOOD MARKET FOR HYPERMARKETS/SUPERMARKETS, BY COUNTRY, 2020-2031 ($MILLION)
FIGURE 30.CHILLED AND DELI FOOD MARKET FOR SPECIALTY STORES, BY COUNTRY, 2020-2031 ($MILLION)
FIGURE 31.CHILLED AND DELI FOOD MARKET FOR FOOD SERVICE OUTLETS, BY COUNTRY, 2020-2031 ($MILLION)
FIGURE 32.CHILLED AND DELI FOOD MARKET FOR ONLINE CHANNEL, BY COUNTRY, 2020-2031 ($MILLION)
FIGURE 33.CHILLED AND DELI FOOD MARKET FOR OTHERS, BY COUNTRY, 2020-2031 ($MILLION)
FIGURE 34.ASTRAL FOODS LTD.: NET SALES, 2018-2020 ($MILLION)
FIGURE 35.ASTRAL FOODS LTD.: REVENUE SHARE, BY SEGMENT, 2020 (%)
FIGURE 36.ASTRAL FOODS LTD.: REVENUE SHARE, BY REGION, 2020 (%)
FIGURE 37.BRF S.A.: NET SALES, 2018-2020 ($MILLION)
FIGURE 38.BRF S.A.: REVENUE SHARE, BY SEGMENT, 2020 (%)
FIGURE 39.BRF S.A.: REVENUE SHARE, BY REGION, 2020 (%)
FIGURE 40.HORMEL FOODS CORPORATION: NET SALES, 2018-2020 ($MILLION)
FIGURE 41.HORMEL FOODS CORPORATION: REVENUE SHARE, BY SEGMENT, 2020 (%)
FIGURE 42.HORMEL FOODS CORPORATION: REVENUE SHARE, BY REGION, 2020 (%)
FIGURE 43.JBS S.A.: NET SALES, 2018-2020 ($MILLION)
FIGURE 44.JBS S.A.: REVENUE SHARE, BY SEGMENT, 2020 (%)
FIGURE 45.JBS S.A.: REVENUE SHARE, BY REGION, 2020 (%)
FIGURE 46.SAMWORTH BROTHERS LIMITED: NET SALES, 2018-2020 ($MILLION)
FIGURE 47.SAMWORTH BROTHERS LIMITED: REVENUE SHARE, BY SEGMENT, 2020 (%)
FIGURE 48.SAMWORTH BROTHERS LIMITED: REVENUE SHARE, BY REGION, 2020 (%)
FIGURE 49.THE KRAFT HEINZ COMPANY: NET SALES, 2018-2020 ($MILLION)
FIGURE 50.THE KRAFT HEINZ COMPANY: REVENUE SHARE, BY SEGMENT, 2020 (%)
FIGURE 51.THE KRAFT HEINZ COMPANY: REVENUE SHARE, BY REGION, 2020 (%)
FIGURE 52.TYSON FOODS, INC: NET SALES, 2018-2020 ($MILLION)
FIGURE 53.TYSON FOODS, INC: REVENUE SHARE, BY SEGMENT, 2020 (%)
FIGURE 54.TYSON FOODS, INC: REVENUE SHARE, BY REGION, 2020 (%)
FIGURE 55.WAITROSE AND PARTNERS: NET SALES, 2018-2020 ($MILLION)
FIGURE 56.WAITROSE AND PARTNERS: REVENUE SHARE, BY SEGMENT, 2020 (%)
FIGURE 57.WAITROSE AND PARTNERS: REVENUE SHARE, BY REGION, 2020 (%)
FIGURE 58.WM MORRISON SUPERMARKETS: NET SALES, 2018-2020 ($MILLION)
FIGURE 59.WM MORRISON SUPERMARKETS: REVENUE SHARE, BY SEGMENT, 2020 (%)
FIGURE 60.WM MORRISON SUPERMARKETS: REVENUE SHARE, BY REGION, 2020 (%)
FIGURE 61.2 SISTERS FOOD GROUP.: NET SALES, 2018-2020 ($MILLION)
FIGURE 62.2 SISTERS FOOD GROUP.: REVENUE SHARE, BY SEGMENT, 2020 (%)
FIGURE 63.2 SISTERS FOOD GROUP.: REVENUE SHARE, BY REGION, 2020 (%)


The chilled and deli food market has a substantial scope for growth, globally. The market's contribution to the global market, which is still in its early stages, is expected to rise considerably during the next six years.. These strategies go beyond only the imperishable aspect and emphasize a differentiated offer to satisfy varying functional and sustainability performance needs in different market segments.

Strategic practices among the world’s largest multinational food & beverage enterprises interpret into a trend that they tend to adopt a regional, rather than a global, approach to product offering and development. The important interplay between corporate standards and local conditions is emphasized not only on the products but also on the adopted business models essential to be successful in emerging markets.

Region wise, the market is expected to register an appreciable growth in Asia-Pacific and in most developing countries such as India and China, owing to rise in disposable income demographic. Moreover, chilled and deli foods such as pie & savory appetizers are gaining popularity, and are expected to have huge demand potential in the future.


PURCHASE OPTIONS

Call or Email us

U.S.-Canada Toll-free: +1-800-792-5285
Int'l : +1-503-894-6022
Europe : +44-845-528-1300
Email : help@alliedmarketresearch.com
 
FREQUENTLY ASKED QUESTIONS?

A. The global chilled and deli food market size was valued at $888,628.0 million in 2020, and is estimated to reach $1,639,968.0 million by 2031, registering a CAGR of 4.2% from 2022 to 2031.

A. The forecast period in the chilled and deli food market report is from 2022 to 2031.

A. The base year calculated in the chilled and deli food market report is 2020.

A. The top companies that hold the market share in the chilled and deli food market include BRF S.A., Hormel Foods Corporation, JBS USA S.A., Tyson Foods, Inc., and The Kraftz Heinz Company.

A. The prepared salads segment is the most influencing segment growing in the chilled and deli food market report.

A. North America holds the maximum market share of the chilled and deli food market.

A. The company profile has been selected on the basis of various strategies such as acquisition, business expansion, collaboration, divestiture, partnership, product launch, and sustainability.

A. The global chilled and deli food market size was valued at $888,628.0 million in 2020.

Looking for Customization?

 Customization Request

Have a Question?

 Speak with Analyst

Any Confusion?

 Inquire Before Buying

Have a glance of the Report

  Request Sample
RELATED TAGS

Purchase Full Report of
Chilled And Deli Food Market

Start reading instantly.
This Report and over 66,905+ more Reports, Available with Avenue Library. T&C*.

  • Online Only
  • $3,799
  • Online cloud access only
  • Restricted print, copy, paste & download
  • Read only
  • Free industry update
    (Within 180 days)
  • Free report update in next update cycle
    (Feb 2023 - Feb 2024)
  • Data Pack
  • $4,199
  • Restricted to one authorized user
  • One print only
  • Available in
    Excel
  • Free industry update
    (Within 180 days)
  •   Free report update in next update cycle
    (Feb 2023 - Feb 2024)
  • Single User
  • $5,899
  • Restricted to one authorized user
  • One print only
  • Available in
    PDF
  • Free industry update
    (Within 180 days)
  •   Free report update in next update cycle
    (Feb 2023 - Feb 2024)
  • Five Users
  • $7,099
  • Limited to five authorized users
  • Print upto five copies
  • Available in
    PDF
  • Free industry update
    (Within 180 days)
  •   Free report update in next update cycle
    (Feb 2023 - Feb 2024)
  • Enterprise
    License/PDF

  • $11,500
  • Unlimited
    within
    company/enterprise
  • Available in Excel & PDF
  • Free industry update
    (Within 180 days)
  •   Free report update in next update cycle
    (Feb 2023 - Feb 2024)
  • Library
    Membership

  • $999 $ 1,175
    Per User/ Per month/ Billed annually
  • Published Content
    E-access
  • Company Profiles
    E-access
  • Newly Added Content Access
  • 10 PDF
    Downloads
  • 5 Excel Data
    Pack Downloads
  • 250 Company Profiles PDF Downloads
  • Buy Now

*Taxes/Fees, if applicable will be added during checkout. All prices in USD

RELATED REPORTS
 

Why Allied Market Research?


Infallible Methodology

To ensure high-level data integrity, accurate analysis, and impeccable forecasts

Analyst Support

For complete satisfaction

Customization

On-demand customization of scope of the report to exactly meet your needs

TARGETED MARKET VIEW

Targeted market view to provide pertinent information and save time of readers

Get fresh content delivered

Get insights on topics that are crucial for your business. Stay abreast of your interest areas.

Get Industry Data Alerts

Why Allied Market Research?

Infallible Methodology

To ensure high-level data integrity, accurate analysis, and impeccable forecasts

Analyst Support

For complete satisfaction

Customization

On-demand customization of scope of the report to exactly meet your needs

TARGETED MARKET VIEW

Targeted market view to provide pertinent information and save time of readers