0
2022
Citrus Fiber Market

Citrus Fiber Market

by Application (Bakery, Sauces & Seasonings, Meat & Egg Replacement, Desserts & Ice-Creams, Beverages, Flavorings, & Coatings, Snacks & Meals, and Others), Type (Orange, Tangerines/Mandarins, Grapefruit, Lemon, Lime, And Others): Global Opportunity Analysis and Industry Forecast, 2021-2030

Report Code: A06860
Mar 2022 | Pages: 253
Tables: 139
Charts: 65
  • Formats*:

  • pdf

    Single User License, Five User
    License & Enterprise User License

  • xls

    Data Pack Excel License

  • ppt

    It comes with the additional cost
    of $2500.00 contact sales.


COVID-19

Pandemic disrupted the entire world and affected many industries.

Get detailed COVID-19 impact analysis on the Citrus Fiber Market

Request Now !

The global citrus fiber market size was valued at $390.6 million in 2020, and is projected to reach $659.2 million by 2030, registering a CAGR of 5.5%. The global citrus fiber market is experiencing a significant growth, and is expected to grow considerably in next few years owing to the intensifying need for naturally derived dietary fibers to prevent various diseases. Citrus fiber is a mixture of soluble and insoluble fiber that is derived from pulp or peel or fruit. This is high in antioxidants and serves as dietary fiber. Insoluble citrus fiber contains bioactive compounds, carotene, polyphenols, and notable flavonoids that increase its demand in the processed food industry. It is one of the nutritional fibers which provide many health benefits such as lower risk of obesity, coronary heart disease, stroke, various gastrointestinal (GI) diseases, hypertension, and diabetes. Citrus fiber extracted from orange peel contains a considerable amount of insoluble dietary fiber. It has many health benefits including reducing adsorption of glucose, and starch digestion.

Usage of citrus fiber is gaining traction among processed and packaged food manufacturers due to several functional advantages, which influence the final products. Citrus fibers are neutral in flavor, taste, and fragrance and their inclusion enhances finished product texture and aroma. In certain cases, adding citrus fiber to foods like meat and cheese is cost-effective, as it is possible to reduce the cost of formulating by replacing expensive ingredients with citrus fibers. In addition, citrus fiber-added refined food is easier to cook.

Citrus-Fiber-Market,-2021-2030

Recent years of competition for natural food ingredients in processed food items have also increased demand for citrus fiber. Producers prefer to include citrus fibers in different food items, as it enables them to go for a clean label without worrying about the e-number. The growing health awareness among people is also helping the citrus fiber market to remain profitable.

Busy and hectic lifestyle of consumers is a major factor that boosts demand for fiber supplements across the globe. Presently, people often do not get enough time to properly take care of their diet, owing to their hectic schedule. This results in less intake of fiber, which gives rise to various diseases related to intestine, blood sugar, obesity, and heart. Adequate amount of fiber consumption not only prevents these health risks but also helps to build strong immunity. Therefore, to fulfil necessary requirements of dietary fiber, consumers opt for fiber supplements. This is one of the key factors that propels demand for fiber supplements among the global population, hence, propels growth of the citrus fibers market.

The citrus fibers market is segmented on the basis of application, source, and region. On the basis of application, the market is categorized into bakery, sauces & seasonings, meat & egg replacement, desserts & ice-creams, beverages, flavorings, and coatings, snacks & meals, and others. According to source, it is fragmented into orange, tangerines/mandarins, grapefruit, lemon, lime, and others. Region-wise, the market is analyzed across North America (the U.S., Canada, and Mexico), Europe (the UK, Spain, Germany, France, Italy, Russia, and rest of Europe), Asia-Pacific (China, Japan, India, South Korea, Australia, and rest of Asia-Pacific), and LAMEA (Brazil, Argentina, the United Emirates Arab, South Africa, Saudi Arabia, and rest of LAMEA).
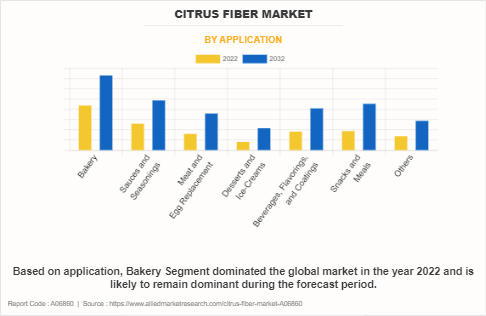
Citrus Fiber Market
By Application

Your browser does not support the canvas element.

Others segment would witness the fastest growth, registering a CAGR of 6.3% during the forecast.

Get more information on this report : Request Sample Pages

Bakery segment in the market held the major share and is likely to remain same throughout the citrus fiber market forecast period. Citrus fibers in the bakery industry increases bread product freshness over time by binding accessible water, particularly water released by starch gluten in wheat to minimize staling. Moreover, this natural ingredient has advantages in baked goods, including moisture retention, oil or fat reduction, emulsification, and shelf-life freshness. Hence, citrus fiber is predicted to grow during the forecast period.
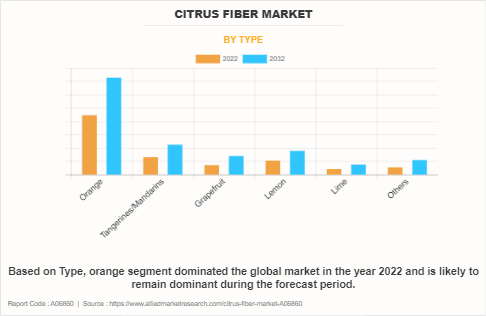
Citrus Fiber Market
By Type

Your browser does not support the canvas element.

Grapefruit segment would witness the fastest growth, registering a CAGR of 6.5% during the forecast period.

Get more information on this report : Request Sample Pages

 Orange segment held the major share in the market. Oranges are low-calorie and high-nutrient citrus fruits. It is popular because of its inherent sweetness, range of varieties available, and variety of uses. Vitamin C content of this famous citrus fruit is particularly well-known. Oranges include a variety of different plant compounds and antioxidants that may help to reduce inflammation and fight diseases. Nutrients in oranges offer a range of health benefits such as antioxidant vitamin C aid to prevent development of cancer-causing free radicals. It is also high in fiber and potassium, both of which are beneficial for heart health.
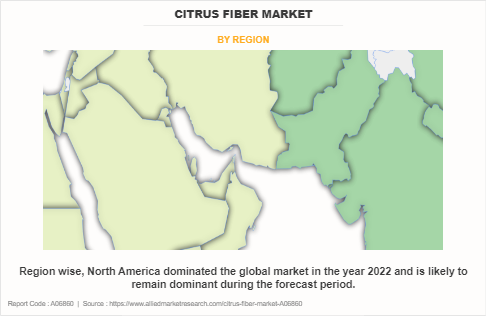
Citrus Fiber Market
By Region

2030
North America 
Europe
Asia-Pacific
LAMEA

Asia-Pacific would witness the fastest growth, registering a CAGR of 6.3% during the forecast period.

Get more information on this report : Request Sample Pages

By region, North America has the highest citrus fiber market share in 2020. Surge in demand for fortified foods & beverages in countries such as the U.S., Canada, and Mexico is leading new path for development of the citrus fibers market in North America. Change in dietary patterns among consumers, combined with growing population of urban people drive growth of the citrus fibers market. Rise in consumption of such fibers in North America lead the citrus fiber market growth.

The players in the citrus fiber market have adopted acquisition as their key development strategy to increase profitability and improve their position in the citrus fiber market.

The key players profiled in the report include AMC Group, Cargill Incorporated, Carolina Ingredients, CEAMSA, Citrus Extracts LLC, CP Kelco, DuPont de Nemours, Inc., Edge Ingredients, FGF Trapani, Fiberstar, Inc., Golden Health, Hebei Lemont Biotechnology Co., Ltd., Herbafood Ingredients GmbH, Ingredients by Nature, JRS Silvateam Ingredients S.r.l., Lucid Colloids Ltd., Nans Products, Naturex SA, Quadra Chemicals Ltd, and Royal DSM.

Key Benefits For Stakeholders

  • This report presents a quantitative analysis of the current Citrus Fiber market trends, estimations, and dynamics of the global citrus fiber market from 2020 to 2030 to identify the prevailing citrus fiber market opportunity.
  • The key countries in all the major regions are mapped based on their market share.
  • Porter’s five forces analysis highlights the potency of buyers and suppliers to enable stakeholders to make profit-oriented business decisions and strengthen their supplier–buyer network.
  • In-depth citrus fiber market analysis of the market segmentation assists in determining the prevailing market opportunities.   
  • Major countries in each region are mapped according to their revenue contribution to the global citrus fiber industry. Market player positioning segment facilitates benchmarking and provides a clear understanding of the present position of the market players.
  • The report includes the analysis of regional as well as global market, key players, market segments, application areas, and growth strategies.

Citrus Fiber Market Report Highlights

Aspects Details
By Application
  • Bakery
  • Sauces & Seasonings
  • Meat & Egg Replacement
  • Desserts & Ice-Creams
  • Beverages, Flavorings, & Coatings
  • Snacks & Meals
  • Others
By Type
  • Orange
  • Tangerines/Mandarins
  • Grapefruit
  • Lemon
  • Lime
  • Others
By Region
  • North America  (U.S., Canada, Mexico)
  • Europe  (Germany, France, UK, Italy, Spain, Russia, Rest of Europe)
  • Asia-Pacific  (China, Japan, India, Australia, South Korea, Rest of Asia-Pacific)
  • LAMEA  (Brazil, Argentina, United Arab Emirates, South Africa, Saudi Arabia, Rest of LAMEA)
 

CHAPTER 1:INTRODUCTION

1.1.Key benefits for stakeholders
1.2.Key market segment
1.3.Research methodology

1.3.1.Secondary research
1.3.2.Primary research
1.3.3.Analyst tools and models

CHAPTER 2:EXECUTIVE SUMMARY

2.1.Key findings of the study
2.2.CXO perspective

CHAPTER 3:MARKET OVERVIEW

3.1.Market definition and scope
3.2.Key findings

3.2.1.Top investment pockets

3.3.Top players positioning
3.4.Porter’s five forces analysis
3.5.Market dynamics

3.5.1.Drivers

3.5.1.1.Numerous health benefits associated with citrus fibers
3.5.1.2.Growth in demand for fiber supplements

3.5.2.Restraints

3.5.2.1.Excess consumption of fiber is unhealthy
3.5.2.2.Variable standards and guidelines across regional regulatory bodies

3.5.3.Opportunities

3.5.3.1.Shift in preference for plant-based foods
3.5.3.2.Increase in demand from developing economies

3.6.Market share analysis

3.6.1.By application
3.6.2.By source
3.6.3.By region

3.7.Impact of COVID-19 on the citrus fiber market

CHAPTER 4:CITRUS FIBER MARKET, BY APPLICATION

4.1.Overview

4.1.1.Market size and forecast

4.2.Bakery

4.2.1.Key market trends, growth factors, and opportunities
4.2.2.Market size and forecast

4.3.Sauces & seasonings

4.3.1.Key market trends, growth factors, and opportunities
4.3.2.Market size and forecast

4.4.Meat & egg replacement

4.4.1.Key market trends, growth factors, and opportunities
4.4.2.Market size and forecast

4.5.Desserts & Ice-creams

4.5.1.Key market trends, growth factors, and opportunities
4.5.2.Market size and forecast

4.6.Beverages, flavorings & coatings

4.6.1.Key market trends, growth factors, and opportunities
4.6.2.Market size and forecast

4.7.Snacks & meals

4.7.1.Key market trends, growth factors, and opportunities
4.7.2.Market size and forecast

4.8.Others

4.8.1.Key market trends, growth factors, and opportunities
4.8.2.Market size and forecast

CHAPTER 5:CITRUS FIBER MARKET, BY SOURCE

5.1.Overview

5.1.1.Market size and forecast

5.2.Orange

5.2.1.Key market trends, growth factors, and opportunities
5.2.2.Market size and forecast

5.3.Tangerines/Mandarins

5.3.1.Key market trends, growth factors, and opportunities
5.3.2.Market size and forecast

5.4.Grapefruit

5.4.1.Key market trends, growth factors, and opportunities
5.4.2.Market size and forecast

5.5.Lemon

5.5.1.Key market trends, growth factors, and opportunities
5.5.2.Market size and forecast

5.6.Lime

5.6.1.Key market trends, growth factors, and opportunities
5.6.2.Market size and forecast

5.7.Others

5.7.1.Key market trends, growth factors, and opportunities
5.7.2.Market size and forecast

CHAPTER 6:CITRUS FIBER MARKET, BY REGION

6.1.Overview

6.1.1.Market size and forecast, by region

6.2.North America

6.2.1.Key market trends, growth factors, and opportunities
6.2.2.Market size and forecast, by Application
6.2.3.Market size and forecast, by Source
6.2.4.Market size and forecast, by country

6.2.4.1.U.S.

6.2.4.1.1.Market size and forecast, by Application
6.2.4.1.2.Market size and forecast, by Source

6.2.4.2.Canada

6.2.4.2.1.Market size and forecast, by Application
6.2.4.2.2.Market size and forecast, by Source

6.2.4.3.Mexico

6.2.4.3.1.Market size and forecast, by Application
6.2.4.3.2.Market size and forecast, by Source

6.3.Europe

6.3.1.Key market trends, growth factors, and opportunities
6.3.2.Market size and forecast, by Application
6.3.3.Market size and forecast, by Source
6.3.4.Market size and forecast, by country

6.3.4.1.Germany

6.3.4.1.1.Market size and forecast, by Application
6.3.4.1.2.Market size and forecast, by Source

6.3.4.2.France

6.3.4.2.1.Market size and forecast, by Application
6.3.4.2.2.Market size and forecast, by Source

6.3.4.3.UK

6.3.4.3.1.Market size and forecast, by Application
6.3.4.3.2.Market size and forecast, by Source

6.3.4.4.Italy

6.3.4.4.1.Market size and forecast, by Application
6.3.4.4.2.Market size and forecast, by Source

6.3.4.5.Spain

6.3.4.5.1.Market size and forecast, by Application
6.3.4.5.2.Market size and forecast, by Source

6.3.4.6.Russia

6.3.4.6.1.Market size and forecast, by Application
6.3.4.6.2.Market size and forecast, by Source

6.3.4.7.Rest of Europe

6.3.4.7.1.Market size and forecast, by Application
6.3.4.7.2.Market size and forecast, by Source

6.4.Asia-Pacific

6.4.1.Key market trends, growth factors, and opportunities
6.4.2.Market size and forecast, by Application
6.4.3.Market size and forecast, by Source
6.4.4.Market size and forecast, by country

6.4.4.1.China

6.4.4.1.1.Market size and forecast, by Application
6.4.4.1.2.Market size and forecast, by Source

6.4.4.2.Japan

6.4.4.2.1.Market size and forecast, by Application
6.4.4.2.2.Market size and forecast, by Source

6.4.4.3.India

6.4.4.3.1.Market size and forecast, by Application
6.4.4.3.2.Market size and forecast, by Source

6.4.4.4.Australia

6.4.4.4.1.Market size and forecast, by Application
6.4.4.4.2.Market size and forecast, by Source

6.4.4.5.South Korea

6.4.4.5.1.Market size and forecast, by Application
6.4.4.5.2.Market size and forecast, by Source

6.4.4.6.Rest of Asia-Pacific

6.4.4.6.1.Market size and forecast, by Application
6.4.4.6.2.Market size and forecast, by Source

6.5.LAMEA

6.5.1.Key market trends, growth factors, and opportunities
6.5.2.Market size and forecast, by Application
6.5.3.Market size and forecast, by Source
6.5.4.Market size and forecast, by country

6.5.4.1.Brazil

6.5.4.1.1.Market size and forecast, by Application
6.5.4.1.2.Market size and forecast, by Source

6.5.4.2.Argentina

6.5.4.2.1.Market size and forecast, by Application
6.5.4.2.2.Market size and forecast, by Source

6.5.4.3.United Arab Emirates

6.5.4.3.1.Market size and forecast, by Application
6.5.4.3.2.Market size and forecast, by Source

6.5.4.4.South Africa

6.5.4.4.1.Market size and forecast, by Application
6.5.4.4.2.Market size and forecast, by Source

6.5.4.5.Saudi Arabia

6.5.4.5.1.Market size and forecast, by Application
6.5.4.5.2.Market size and forecast, by Source

6.5.4.6.Rest of LAMEA

6.5.4.6.1.Market size and forecast, by Application
6.5.4.6.2.Market size and forecast, by Source

CHAPTER 7:COMPETITION LANDSCAPE

7.1.Top winning strategies
7.2.Product mapping
7.3.Competitive dashboard
7.4.Competitive heat map
7.5.Key developments

7.5.1.Acquisition
7.5.2.Joint Venture
7.5.3.Investment
7.5.4.Product Launch

CHAPTER 8:COMPANY PROFILES

8.1.AMC GROUP

8.1.1.Company overview
8.1.2.Key Executives
8.1.3.Company snapshot
8.1.4.Product portfolio

8.2.CARGILL INCORPORATED

8.2.1.Company overview
8.2.2.Key Executives
8.2.3.Company snapshot
8.2.4.Product portfolio
8.2.5.Business performance
8.2.6.Key strategic moves and developments

8.3.CAROLINA INGREDIENTS

8.3.1.Company overview
8.3.2.Key Executives
8.3.3.Company snapshot
8.3.4.Product portfolio

8.4.CEAMSA

8.4.1.Company overview
8.4.2.Key Executives
8.4.3.Company snapshot
8.4.4.Product portfolio

8.5.CITRUS EXTRACTS LLC

8.5.1.Company overview
8.5.2.Key Executives
8.5.3.Company snapshot
8.5.4.Product portfolio

8.6.CP KELCO

8.6.1.Company overview
8.6.2.Key Executives
8.6.3.Company snapshot
8.6.4.Product portfolio
8.6.5.Key strategic moves and developments

8.7.DUPONT DE NEMOURS, INC.

8.7.1.Company overview
8.7.2.Key executives
8.7.3.Company snapshot
8.7.4.Operating business segments
8.7.5.Product portfolio
8.7.6.R&D expenditure
8.7.7.Business performance
8.7.8.Key strategic moves and developments

8.8.EDGE INGREDIENTS

8.8.1.Company overview
8.8.2.Key Executives
8.8.3.Company snapshot
8.8.4.Product portfolio

8.9.FGF TRAPANI

8.9.1.Company overview
8.9.2.Key Executives
8.9.3.Company snapshot
8.9.4.Product portfolio
8.9.5.Key strategic moves and developments

8.10.FIBERSTAR, INC.

8.10.1.Company overview
8.10.2.Key Executives
8.10.3.Company snapshot
8.10.4.Product portfolio
8.10.5.Key strategic moves and developments

8.11.GOLDEN HEALTH

8.11.1.Company overview
8.11.2.Company snapshot
8.11.3.Product portfolio

8.12.HEBEI LEMONT BIOTECHNOLOGY CO., LTD.

8.12.1.Company overview
8.12.2.Company snapshot
8.12.3.Product portfolio

8.13.HERBAFOOD INGREDIENTS GmbH

8.13.1.Company overview
8.13.2.Key Executives
8.13.3.Company snapshot
8.13.4.Product portfolio

8.14.INGREDIENTS BY NATURE

8.14.1.Company overview
8.14.2.Key Executives
8.14.3.Company snapshot
8.14.4.Product portfolio
8.14.5.Key strategic moves and developments

8.15.JRS SILVATEAM INGREDIENTS S.R.L.

8.15.1.Company overview
8.15.2.Key Executives
8.15.3.Company snapshot
8.15.4.Product portfolio
8.15.5.Key strategic moves and developments

8.16.LUCID COLLOIDS LTD.

8.16.1.Company overview
8.16.2.Key Executives
8.16.3.Company snapshot
8.16.4.Product portfolio

8.17.NANS PRODUCTS

8.17.1.Company overview
8.17.2.Key Executives
8.17.3.Company snapshot
8.17.4.Product portfolio

8.18.NATUREX SA

8.18.1.Company overview
8.18.2.Key Executives
8.18.3.Company snapshot
8.18.4.Product portfolio
8.18.5.R&D Expenditure
8.18.6.Business performance

8.19.QUADRA CHEMICALS LTD

8.19.1.Company overview
8.19.2.Key Executives
8.19.3.Company snapshot
8.19.4.Product portfolio

8.20.ROYAL DSM

8.20.1.Company overview
8.20.2.Key executives
8.20.3.Company snapshot
8.20.4.Operating business segments
8.20.5.Product portfolio
8.20.6.R&D expenditure
8.20.7.Business performance
8.20.8.Key strategic moves and developments

LIST OF TABLES

TABLE 01.CITRUS FIBER MARKET REVENUE, BY APPLICATION, 2020–2030 ($MILLION)
TABLE 02.CITRUS FIBER MARKET REVENUE FOR BAKERY, BY REGION, 2020–2030 ($MILLION)
TABLE 03.CITRUS FIBER MARKET REVENUE FOR SAUCES & SEASONINGS, BY REGION, 2020–2030 ($MILLION)
TABLE 04.CITRUS FIBER MARKET REVENUE FOR MEAT & EGG REPLACEMENT, BY REGION, 2020–2030 ($MILLION)
TABLE 05.CITRUS FIBER MARKET REVENUE FOR DESSERTS & ICE-CREAMS, BY REGION, 2020–2030 ($MILLION)
TABLE 06.CITRUS FIBER MARKET REVENUE FOR BEVERAGES, FLAVORINGS, & COATINGS, BY REGION, 
2020–2030 ($MILLION)
TABLE 07.CITRUS FIBER MARKET REVENUE FOR SNACKS & MEALS, BY REGION, 2020–2030 ($MILLION)
TABLE 08.CITRUS FIBER MARKET REVENUE FOR OTHERS, BY REGION, 2020–2030 ($MILLION)
TABLE 09.CITRUS FIBER MARKET REVENUE, BY SOURCE, 2020–2030 ($MILLION)
TABLE 10.ORANGE CITRUS FIBER MARKET REVENUE, BY REGION, 2020–2030 ($MILLION)
TABLE 11.TANGERINES/MANDARINS CITRUS FIBER MARKET REVENUE, BY REGION, 2020–2030 ($MILLION)
TABLE 12.GRAPEFRUIT CITRUS FIBER MARKET REVENUE, BY REGION, 2020–2030 ($MILLION)
TABLE 13.LEMON CITRUS FIBER MARKET REVENUE, BY REGION, 2020–2030 ($MILLION)
TABLE 14.CITRUS FIBER MARKET REVENUE FOR LIME, BY REGION, 2020–2030 ($MILLION)
TABLE 15.CITRUS FIBER MARKET REVENUE FOR OTHERS, BY REGION, 2020–2030 ($MILLION)
TABLE 16.CITRUS FIBER MARKET REVENUE, BY REGION, 2020–2030 ($MILLION)
TABLE 17.NORTH AMERICA CITRUS FIBER MARKET REVENUE, BY APPLICATION, 2020–2030 ($MILLION)
TABLE 18.NORTH AMERICA CITRUS FIBER MARKET REVENUE, BY SOURCE, 2020–2030 ($MILLION)
TABLE 19.NORTH AMERICA CITRUS FIBER MARKET REVENUE, BY COUNTRY, 2020–2030 ($MILLION)
TABLE 20.U.S. CITRUS FIBER MARKET REVENUE, BY APPLICATION, 2020–2030 ($MILLION)
TABLE 21.U.S. CITRUS FIBER MARKET REVENUE, BY SOURCE, 2020–2030 ($MILLION)
TABLE 22.CANADA CITRUS FIBER MARKET REVENUE, BY APPLICATION, 2020–2030 ($MILLION)
TABLE 23.CANADA CITRUS FIBER MARKET REVENUE, BY SOURCE, 2020–2030 ($MILLION)
TABLE 24.MEXICO CITRUS FIBER MARKET REVENUE, BY APPLICATION, 2020–2030 ($MILLION)
TABLE 25.MEXICO CITRUS FIBER MARKET REVENUE, BY SOURCE, 2020–2030 ($MILLION)
TABLE 26.EUROPE CITRUS FIBER MARKET REVENUE, BY APPLICATION, 2020–2030 ($MILLION)
TABLE 27.EUROPE CITRUS FIBER MARKET REVENUE, BY SOURCE, 2020–2030 ($MILLION)
TABLE 28.EUROPE CITRUS FIBER MARKET REVENUE, BY COUNTRY, 2020–2030 ($MILLION)
TABLE 29.GERMANY CITRUS FIBER MARKET REVENUE, BY APPLICATION, 2020–2030 ($MILLION)
TABLE 30.GERMANY CITRUS FIBER MARKET REVENUE, BY SOURCE, 2020–2030 ($MILLION)
TABLE 31.FRANCE CITRUS FIBER MARKET REVENUE, BY APPLICATION, 2020–2030 ($MILLION)
TABLE 32.FRANCE CITRUS FIBER MARKET REVENUE, BY SOURCE, 2020–2030 ($MILLION)
TABLE 33.UK CITRUS FIBER MARKET REVENUE, BY APPLICATION, 2020–2030 ($MILLION)
TABLE 34.UK CITRUS FIBER MARKET REVENUE, BY SOURCE, 2020–2030 ($MILLION)123
TABLE 35.ITALY CITRUS FIBER MARKET REVENUE, BY APPLICATION, 2020–2030 ($MILLION)
TABLE 36.ITALY CITRUS FIBER MARKET REVENUE, BY SOURCE, 2020–2030 ($MILLION)
TABLE 37.SPAIN CITRUS FIBER MARKET REVENUE, BY APPLICATION, 2020–2030 ($MILLION)
TABLE 38.SPAIN CITRUS FIBER MARKET REVENUE, BY SOURCE, 2020–2030 ($MILLION)
TABLE 39.RUSSIA CITRUS FIBER MARKET REVENUE, BY APPLICATION, 2020–2030 ($MILLION)
TABLE 40.RUSSIA CITRUS FIBER MARKET REVENUE, BY SOURCE, 2020–2030 ($MILLION)
TABLE 41.REST OF EUROPE CITRUS FIBER MARKET REVENUE, BY APPLICATION, 2020–2030 ($MILLION)
TABLE 42.REST OF EUROPE CITRUS FIBER MARKET REVENUE, BY SOURCE, 2020–2030 ($MILLION)
TABLE 43.ASIA-PACIFIC CITRUS FIBER MARKET REVENUE, BY APPLICATION, 2020–2030 ($MILLION)
TABLE 44.ASIA-PACIFIC CITRUS FIBER MARKET REVENUE, BY SOURCE, 2020–2030 ($MILLION)
TABLE 45.ASIA-PACIFIC CITRUS FIBER MARKET REVENUE, BY COUNTRY, 2020–2030 ($MILLION)
TABLE 46.CHINA CITRUS FIBER MARKET REVENUE, BY APPLICATION, 2020–2030 ($MILLION)
TABLE 47.CHINA CITRUS FIBER MARKET REVENUE, BY SOURCE, 2020–2030 ($MILLION)
TABLE 48.JAPAN CITRUS FIBER MARKET REVENUE, BY APPLICATION, 2020–2030 ($MILLION)
TABLE 49.JAPAN CITRUS FIBER MARKET REVENUE, BY SOURCE, 2020–2030 ($MILLION)
TABLE 50.INDIA CITRUS FIBER MARKET REVENUE, BY APPLICATION, 2020–2030 ($MILLION)
TABLE 51.INDIA CITRUS FIBER MARKET REVENUE, BY SOURCE, 2020–2030 ($MILLION)
TABLE 52.AUSTRALIA CITRUS FIBER MARKET REVENUE, BY APPLICATION, 2020–2030 ($MILLION)
TABLE 53.AUSTRALIA  CITRUS FIBER MARKET REVENUE, BY SOURCE, 2020–2030 ($MILLION)
TABLE 54.SOUTH KOREA CITRUS FIBER MARKET REVENUE, BY APPLICATION, 2020–2030 ($MILLION)
TABLE 55.SOUTH KOREA CITRUS FIBER MARKET REVENUE, BY SOURCE, 2020–2030 ($MILLION)
TABLE 56.REST OF ASIA-PACIFIC CITRUS FIBER MARKET REVENUE, BY APPLICATION, 2020–2030 ($MILLION)
TABLE 57.REST OF ASIA-PACIFIC CITRUS FIBER MARKET REVENUE, BY SOURCE, 2020–2030 ($MILLION)
TABLE 58.LAMEA CITRUS FIBER MARKET REVENUE, BY APPLICATION, 2020–2030 ($MILLION)
TABLE 59.LAMEA CITRUS FIBER MARKET REVENUE, BY SOURCE, 2020–2030 ($MILLION)
TABLE 60.LAMEA CITRUS FIBER MARKET REVENUE, BY COUNTRY, 2020–2030 ($MILLION)
TABLE 61.BRAZIL CITRUS FIBER MARKET REVENUE, BY APPLICATION, 2020–2030 ($MILLION)
TABLE 62.BRAZIL CITRUS FIBER MARKET REVENUE, BY SOURCE, 2020–2030 ($MILLION)
TABLE 63.ARGENTINA CITRUS FIBER MARKET REVENUE, BY APPLICATION, 2020–2030 ($MILLION)
TABLE 64.ARGENTINA CITRUS FIBER MARKET REVENUE, BY SOURCE, 2020–2030 ($MILLION)
TABLE 65.UNITED ARAB EMIRATES CITRUS FIBER MARKET REVENUE, BY APPLICATION, 2020–2030 ($MILLION)
TABLE 66.UNITED ARAB EMIRATES CITRUS FIBER MARKET REVENUE, BY SOURCE, 2020–2030 ($MILLION)
TABLE 67.SOUTH AFRICA CITRUS FIBER MARKET REVENUE, BY APPLICATION, 2020–2030 ($MILLION)
TABLE 68.SOUTH AFRICA CITRUS FIBER MARKET REVENUE, BY SOURCE, 2020–2030 ($MILLION)
TABLE 69.SAUDI ARABIA CITRUS FIBER MARKET REVENUE, BY APPLICATION, 2020–2030 ($MILLION)
TABLE 70.SAUDI ARABIA CITRUS FIBER MARKET REVENUE, BY SOURCE, 2020–2030 ($MILLION)
TABLE 71.REST OF LAMEA CITRUS FIBER MARKET REVENUE, BY APPLICATION, 2020–2030 ($MILLION)
TABLE 72.REST OF LAMEA CITRUS FIBER MARKET REVENUE, BY SOURCE, 2020–2030 ($MILLION)
TABLE 73.AMC GROUP: KEY EXECUTIVES
TABLE 74.AMC GROUP: COMPANY SNAPSHOT
TABLE 75.AMC GROUP: PRODUCT PORTFOLIO
TABLE 76.CARGILL INCORPORATED: KEY EXECUTIVES
TABLE 77.CARGILL INCORPORATED: COMPANY SNAPSHOT
TABLE 78.CARGILL INCORPORATED PRODUCT PORTFOLIO
TABLE 79.CARGILL INCORPORATED: NET SALES, 2018–2020 ($MILLION)
TABLE 80.CAROLINA INGREDIENTS: KEY EXECUTIVES
TABLE 81.CAROLINA INGREDIENTS: COMPANY SNAPSHOT
TABLE 82.CAROLINA INGREDIENTS: PRODUCT PORTFOLIO
TABLE 83.CEAMSA: KEY EXECUTIVES
TABLE 84.CEAMSA: COMPANY SNAPSHOT
TABLE 85.CEAMSA: PRODUCT PORTFOLIO
TABLE 86.CITRUS EXTRACTS LLC: KEY EXECUTIVES
TABLE 87.CITRUS EXTRACTS LLC: COMPANY SNAPSHOT
TABLE 88.CITRUS EXTRACTS LLC: PRODUCT PORTFOLIO
TABLE 89.CP KELCO: KEY EXECUTIVES
TABLE 90.CP KELCO: COMPANY SNAPSHOT
TABLE 91.CP KELCO: PRODUCT PORTFOLIO
TABLE 92.DUPONT DE NEMOURS, INC.: KEY EXECUTIVES
TABLE 93.DUPONT DE NEMOURS, INC.: COMPANY SNAPSHOT
TABLE 94.DUPONT DE NEMOURS, INC.: OPERATING SEGMENTS
TABLE 95.DUPONT DE NEMOURS, INC.: PRODUCT PORTFOLIO
TABLE 96.DUPONT DE NEMOURS, INC.: R&D EXPENDITURE, 2018–2020 ($MILLION)
TABLE 97.DUPONT DE NEMOURS, INC.: NET SALES, 2018–2020 ($MILLION)
TABLE 98.EDGE INGREDIENTS: KEY EXECUTIVES
TABLE 99.EDGE INGREDIENTS: COMPANY SNAPSHOT
TABLE 100.EDGE INGREDIENTS: PRODUCT PORTFOLIO
TABLE 101.FGF TRAPANI: KEY EXECUTIVES
TABLE 102.FGF TRAPANI: COMPANY SNAPSHOT
TABLE 103.FGF TRAPANI: PRODUCT PORTFOLIO
TABLE 104.FIBERSTAR, INC.: KEY EXECUTIVES
TABLE 105.FIBERSTAR, INC.: COMPANY SNAPSHOT
TABLE 106.FIBERSTAR, INC.: PRODUCT PORTFOLIO
TABLE 107.GOLDEN HEALTH: COMPANY SNAPSHOT
TABLE 108.GOLDEN HEALTH: PRODUCT PORTFOLIO
TABLE 109.HEBEI LEMONT BIOTECHNOLOGY CO., LTD.: COMPANY SNAPSHOT
TABLE 110.HEBEI LEMONT BIOTECHNOLOGY CO., LTD.: PRODUCT PORTFOLIO
TABLE 111.HERBAFOOD INGREDIENTS GMBH: KEY EXECUTIVES
TABLE 112.HERBAFOOD INGREDIENTS GMBH: COMPANY SNAPSHOT
TABLE 113.HERBAFOOD INGREDIENTS GMBH: PRODUCT PORTFOLIO
TABLE 114.INGREDIENTS BY NATURE: KEY EXECUTIVES
TABLE 115.INGREDIENTS BY NATURE: COMPANY SNAPSHOT
TABLE 116.INGREDIENTS BY NATURE: PRODUCT PORTFOLIO
TABLE 117.JRS SILVATEAM INGREDIENTS S.R.L.: KEY EXECUTIVES
TABLE 118.JRS SILVATEAM INGREDIENTS S.R.L.: COMPANY SNAPSHOT
TABLE 119.LIXIL GROUP CORPORATION: PRODUCT PORTFOLIO
TABLE 120.LUCID COLLOIDS LTD.: KEY EXECUTIVES
TABLE 121.LUCID COLLOIDS LTD.: COMPANY SNAPSHOT
TABLE 122.LUCID COLLOIDS LTD.: PRODUCT PORTFOLIO
TABLE 123.NANS PRODUCTS: KEY EXECUTIVES
TABLE 124.NANS PRODUCTS: COMPANY SNAPSHOT
TABLE 125.NANS PRODUCTS: PRODUCT PORTFOLIO
TABLE 126.NATUREX SA: KEY EXECUTIVES
TABLE 127.NATUREX SA: COMPANY SNAPSHOT
TABLE 128.NATUREX SA: PRODUCT PORTFOLIO
TABLE 129.NATUREX SA: R&D EXPENDITURE, 2018–2020 ($MILLION)
TABLE 130.NATUREX SA: NET SALES, 2018–2020 ($MILLION)
TABLE 131.QUADRA CHEMICALS LTD: KEY EXECUTIVES
TABLE 132.QUADRA CHEMICALS LTD: COMPANY SNAPSHOT
TABLE 133.QUADRA CHEMICALS LTD: PRODUCT PORTFOLIO
TABLE 134.ROYAL DSM: KEY EXECUTIVES
TABLE 135.ROYAL DSM: COMPANY SNAPSHOT
TABLE 136.ROYAL DSM: OPERATING SEGMENTS
TABLE 137.ROYAL DSM: PRODUCT PORTFOLIO
TABLE 138.ROYAL DSM.: R&D EXPENDITURE, 2018–2020 ($MILLION)
TABLE 139.ROYAL DSM: NET SALES, 2018–2020 ($MILLION)

LIST OF FIGURES

FIGURE 01.CITRUS FIBER MARKET SNAPSHOT
FIGURE 02.GLOBAL CITRUS FIBER MARKET: SEGMENTATION
FIGURE 03.TOP INVESTMENT POCKETS
FIGURE 04.MODERATE BARGAINING POWER OF SUPPLIERS
FIGURE 05.LOW BARGAINING POWER OF BUYERS
FIGURE 06.LOW THREAT OF SUBSTITUTION
FIGURE 07.MODERATE THREAT OF NEW ENTRANTS
FIGURE 08.MODERATE INTENSITY OF COMPETITIVE RIVALRY
FIGURE 09.CITRUS FIBER MARKET: DRIVERS, RESTRAINTS, AND OPPORTUNITIES
FIGURE 10.CITRUS FIBER MARKET, BY APPLICATION, 2020 (%)
FIGURE 11.COMPARATIVE SHARE ANALYSIS OF CITRUS FIBER MARKET REVENUE FOR BAKERY, BY COUNTRY,  2020 & 2030 (%)
FIGURE 12.COMPARATIVE SHARE ANALYSIS OF CITRUS FIBER MARKET REVENUE FOR SAUCES & SEASONINGS,  2020 & 2030 (%)
FIGURE 13.COMPARATIVE SHARE ANALYSIS OF CITRUS FIBER MARKET REVENUE FOR MEAT & EGG REPLACEMENT,  2020 & 2030 (%)
FIGURE 14.COMPARATIVE SHARE ANALYSIS OF CITRUS FIBER MARKET REVENUE FOR DESSERTS & ICE-CREAMS,  2020 & 2030 (%)
FIGURE 15.COMPARATIVE SHARE ANALYSIS OF CITRUS FIBER MARKET REVENUE FOR BEVERAGES, FLAVORINGS, & COATINGS, 2020 & 2030 (%)
FIGURE 16.COMPARATIVE SHARE ANALYSIS OF CITRUS FIBER MARKET REVENUE FOR SNACKS & MEALS, 2020 & 2030 (%)
FIGURE 17.COMPARATIVE SHARE ANALYSIS OF CITRUS FIBER MARKET REVENUE FOR OTHERS, 
2020 & 2030 (%)
FIGURE 18.CITRUS FIBER MARKET, BY SOURCE, 2020 (%)
FIGURE 19.COMPARATIVE COUNTRY MARKET SHARE ANALYSIS OF ORANGE CITRUS FIBER MARKET,
2020 & 2030 (%)
FIGURE 20.COMPARATIVE COUNTRY MARKET SHARE ANALYSIS OF TANGERINES/MANDARINS CITRUS FIBER MARKET,  2020 & 2030 (%)
FIGURE 21.COMPARATIVE COUNTRY MARKET SHARE ANALYSIS OF GRAPEFRUIT CITRUS FIBER MARKET, 
2020 & 2030 (%)
FIGURE 22.COMPARATIVE COUNTRY MARKET SHARE ANALYSIS OF CITRUS FIBER MARKET REVENUE FOR LEMON,  2020 & 2030 (%)
FIGURE 23.COMPARATIVE COUNTRY MARKET SHARE ANALYSIS OF CITRUS FIBER MARKET REVENUE FOR LIME,  2020 & 2030 (%)
FIGURE 24.COMPARATIVE COUNTRY MARKET SHARE ANALYSIS OF CITRUS FIBER MARKET REVENUE FOR OTHERS,  2020 & 2030 (%)
FIGURE 25.CITRUS FIBER MARKET, BY REGION, 2020 (%)
FIGURE 26.U.S. CITRUS FIBER MARKET REVENUE, 2020–2030 ($MILLION)
FIGURE 27.CANADA CITRUS FIBER MARKET REVENUE, 2020–2030 ($MILLION)
FIGURE 28.MEXICO CITRUS FIBER MARKET REVENUE, 2020–2030 ($MILLION)
FIGURE 29.GERMANY CITRUS FIBER MARKET REVENUE, 2020–2030 ($MILLION)
FIGURE 30.FRANCE CITRUS FIBER MARKET REVENUE, 2020–2030 ($MILLION)
FIGURE 31.UK CITRUS FIBER MARKET REVENUE, 2020–2030 ($MILLION)
FIGURE 32.ITALY CITRUS FIBER MARKET REVENUE, 2020–2030 ($MILLION)
FIGURE 33.SPAIN CITRUS FIBER MARKET REVENUE, 2020–2030 ($MILLION)
FIGURE 34.RUSSIA CITRUS FIBER MARKET REVENUE, 2020–2030 ($MILLION)
FIGURE 35.REST OF EUROPE CITRUS FIBER MARKET REVENUE, 2020–2030 ($MILLION)
FIGURE 36.CHINA CITRUS FIBER MARKET REVENUE, 2020–2030 ($MILLION)
FIGURE 37.JAPAN CITRUS FIBER MARKET REVENUE, 2020–2030 ($MILLION)
FIGURE 38.INDIA CITRUS FIBER MARKET REVENUE, 2020–2030 ($MILLION)
FIGURE 39.AUSTRALIA  CITRUS FIBER MARKET REVENUE, 2020–2030 ($MILLION)
FIGURE 40.SOUTH KOREA CITRUS FIBER MARKET REVENUE, 2020–2030 ($MILLION)
FIGURE 41.REST OF ASIA-PACIFIC CITRUS FIBER MARKET REVENUE, 2020–2030 ($MILLION)
FIGURE 42.BRAZIL CITRUS FIBER MARKET REVENUE, 2020–2030 ($MILLION)
FIGURE 43.ARGENTINA CITRUS FIBER MARKET REVENUE, 2020–2030 ($MILLION)
FIGURE 44.UNITED ARAB EMIRATES CITRUS FIBER MARKET REVENUE, 2020–2030 ($MILLION)
FIGURE 45.SOUTH AFRICA CITRUS FIBER MARKET REVENUE, 2020–2030 ($MILLION)
FIGURE 46.SAUDI ARABIA CITRUS FIBER MARKET REVENUE, 2020–2030 ($MILLION)
FIGURE 47.REST OF LAMEA CITRUS FIBER MARKET REVENUE, 2020–2030 ($MILLION)
FIGURE 48.TOP WINNING STRATEGIES, BY YEAR, 2017–2021*
FIGURE 49.TOP WINNING STRATEGIES, BY DEVELOPMENT, 2017–2021* (%)
FIGURE 50.PRODUCT MAPPING OF TOP 20 KEY PLAYERS (1-10)
FIGURE 51.PRODUCT MAPPING OF TOP 20 KEY PLAYERS (11-20)
FIGURE 52.COMPETITIVE DASHBOARD OF TOP 20 KEY PLAYERS
FIGURE 53.COMPETITIVE HEATMAP OF TOP 20 KEY PLAYERS (1-10)
FIGURE 54.COMPETITIVE HEATMAP OF TOP 20 KEY PLAYERS (11-20)
FIGURE 55.CARGILL INCORPORATED: NET SALES, 2018–2020 ($MILLION)
FIGURE 56.DUPONT DE NEMOURS, INC.: R&D EXPENDITURE, 2018–2020 ($MILLION)
FIGURE 57.DUPONT DE NEMOURS, INC.: NET SALES, 2018–2020 ($MILLION)
FIGURE 58.DUPONT DE NEMOURS, INC.: REVENUE SHARE BY SEGMENT, 2020 (%)
FIGURE 59.DUPONT DE NEMOURS, INC: REVENUE SHARE BY REGION, 2020 (%)
FIGURE 60.NATUREX SA: R&D EXPENDITURE, 2018–2020 ($MILLION)
FIGURE 61.NATUREX SA: NET SALES, 2018–2020 ($MILLION)
FIGURE 62.NATUREX SA: REVENUE SHARE BY REGION, 2020 (%)
FIGURE 63.ROYAL DSM: R&D EXPENDITURE, 2018–2020 ($MILLION)
FIGURE 64.ROYAL DSM: NET SALES, 2018–2020 ($MILLION)
FIGURE 65.ROYAL DSM: REVENUE SHARE BY SEGMENT, 2020 (%)


On the basis of insights of top CXOs, the citrus fibers market is expected to grow rapidly in the future. This is attributed to growing demand for functional foods among the global population. Rise in number of working women, increasing workload, and busy & hectic lifestyle of consumers propels demand for functional foods across the globe.

Moreover, people prefer fiber supplements to fulfil their daily fiber requirements in the body. Growth in awareness regarding consumption of citrus fibers among the global population is exponentially contributing toward growth of the global citrus fibers market. The CXOs further added that Asia-Pacific is expected to be significant contributor toward growth of the citrus fiber market.

Characterized by huge consumer base, rapid industrialization, rapid growth of food & beverages industry, rise in disposable income, growth in number of working people, and demand for healthy lifestyle are major factors that drive the global citrus fibers market. Moreover, countries such as China, India, and Indonesia are among top producers of cereals, grains, and legumes that positively impacts citrus fibers production by supplying adequate raw materials. Hence, Asia-Pacific provides lucrative growth opportunities for the citrus fibers industry players.

PURCHASE OPTIONS

Call or Email us

U.S.-Canada Toll-free: +1-800-792-5285
Int'l : +1-503-894-6022
Europe : +44-845-528-1300
Email : help@alliedmarketresearch.com
 
FREQUENTLY ASKED QUESTIONS?

A. The global citrus fiber market size was valued at $390.6 million in 2020, and is projected to reach $659.2 million by 2030, registering a CAGR of 5.5%.

A. The CAGR of Citrus Fiber Market is 5.5%.

A. Kindly get in touch with the sales person for better options.

A. 2020 is the base year calculated in the Citrus Fiber Market report.

A. The key players profiled in the report include AMC Group, Cargill Incorporated, Carolina Ingredients, CEAMSA, Citrus Extracts LLC, CP Kelco, DuPont de Nemours, Inc., Edge Ingredients, FGF Trapani, Fiberstar, Inc., Golden Health, Hebei Lemont Biotechnology Co., Ltd., Herbafood Ingredients GmbH, Ingredients by Nature, JRS Silvateam Ingredients S.r.l., Lucid Colloids Ltd., Nans Products, Naturex SA, Quadra Chemicals Ltd, and Royal DSM.

A. Application and type are the segments of Citrus Fiber Market.

A. Growing health awareness among people and Busy and hectic lifestyle of consumers are the key trends in the Citrus Fiber Market report.

A. North America has the highest citrus fiber market share in 2020.

A. COVID-19 had experienced a decline in its sale due to which there is a decline for the demand of citrus fiber in various industries.

Looking for Customization?

 Customization Request

Have a Question?

 Speak with Analyst

Any Confusion?

 Inquire Before Buying

Have a glance of the Report

  Request Sample
RELATED TAGS

Purchase Full Report of
Citrus Fiber Market

Start reading instantly.
This Report and over 68,399+ more Reports, Available with Avenue Library. T&C*.

  • Online Only
  • $3,712
  • Online cloud access only
  • Restricted print, copy, paste & download
  • Read only
  • Free industry update
    (Within 180 days)
  • Free report update in next update cycle
    (Mar 2023 - Mar 2024)
  • Data Pack
  • $4,125
  • Restricted to one authorized user
  • One print only
  • Available in
    Excel
  • Free industry update
    (Within 180 days)
  •   Free report update in next update cycle
    (Mar 2023 - Mar 2024)
  • Single User
  • $5,769
  • Restricted to one authorized user
  • One print only
  • Available in
    PDF
  • Free industry update
    (Within 180 days)
  •   Free report update in next update cycle
    (Mar 2023 - Mar 2024)
  • Five Users
  • $6,929
  • Limited to five authorized users
  • Print upto five copies
  • Available in
    PDF
  • Free industry update
    (Within 180 days)
  •   Free report update in next update cycle
    (Mar 2023 - Mar 2024)
  • Enterprise
    License/PDF

  • $10,663
  • Unlimited
    within
    company/enterprise
  • Available in Excel & PDF
  • Free industry update
    (Within 180 days)
  •   Free report update in next update cycle
    (Mar 2023 - Mar 2024)
  • Library
    Membership

  • $999 $ 1,175
    Per User/ Per month/ Billed annually
  • Published Content
    E-access
  • Company Profiles
    E-access
  • Newly Added Content Access
  • 10 PDF
    Downloads
  • 5 Excel Data
    Pack Downloads
  • 250 Company Profiles PDF Downloads
  • Buy Now

*Taxes/Fees, if applicable will be added during checkout. All prices in USD

RELATED REPORTS
 

Why Allied Market Research?


Infallible Methodology

To ensure high-level data integrity, accurate analysis, and impeccable forecasts

Analyst Support

For complete satisfaction

Customization

On-demand customization of scope of the report to exactly meet your needs

TARGETED MARKET VIEW

Targeted market view to provide pertinent information and save time of readers

Get fresh content delivered

Get insights on topics that are crucial for your business. Stay abreast of your interest areas.

Get Industry Data Alerts

Why Allied Market Research?

Infallible Methodology

To ensure high-level data integrity, accurate analysis, and impeccable forecasts

Analyst Support

For complete satisfaction

Customization

On-demand customization of scope of the report to exactly meet your needs

TARGETED MARKET VIEW

Targeted market view to provide pertinent information and save time of readers