
Cold-pressed Oil Market Outlook - 2026
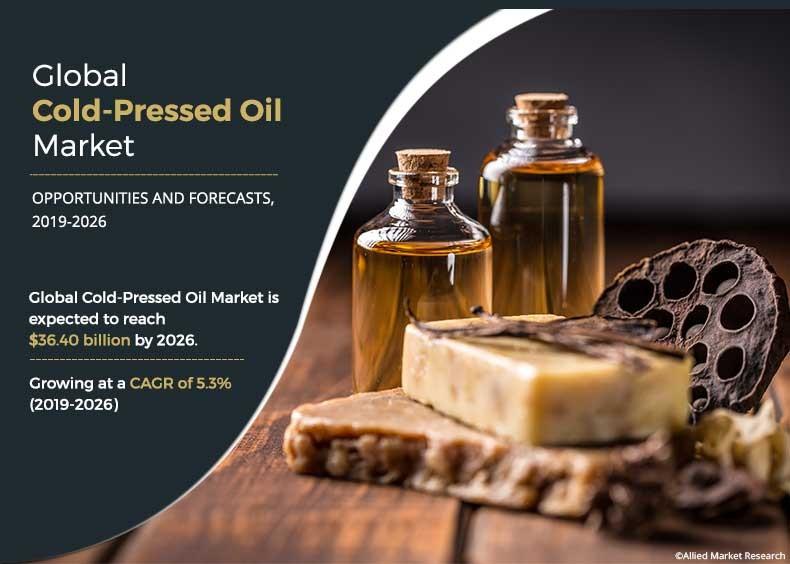
The global cold-pressed oil market size was valued at $24.62 billion in 2018, and is expected to grow at a CAGR of 5.3% to reach $36.40 billion by 2026. Oils obtained through cold pressed are expeller extracted in a controlled temperature setting. The controlled temperature lies below 49°C (120°F). Cold pressed oils retain most of their subtle color, flavor, and nutritional value. In addition, cold pressed oil has zero trans fatty acids and is cholesterol free. As a result, cold pressed oil has gained huge traction in the last few years.
Cold press extraction is one of the methods of mechanical extraction as well as require less energy than other oil extraction techniques. Initially this concept of extraction was used on vegetables and fruits to extract juices. Later on, this technique was used to extract oils as well. This concept is being used to retain the flavor, aroma, and nutritional value of food. Cold-pressed oils contain natural antioxidant of the seed from which they were produced. Furthermore, it eliminates all harmful effects that are born through conventional methods of oil extraction. In addition, it is environment friendly and is used to obtain high-quality oils through performing production at low temperatures using cold press method. Cold pressed oil is safer than hot pressed oil and helps avoids adverse effects caused by high temperature. Moreover, these oils have better nutritive properties than refined oils. However, low productivity and allergy to consumers caused by soybean seed, rapeseed, coconut, and others is expected to restrict the growth of cold-pressed oil market globally. Also, major health issues such as itchy palm and foots, shortness of breath, and nasal blockage affect the cold-pressed oil market growth. On the contrary, these oils provide a vital contribution toward a healthy life as they are non-refined, cholesterol free, and are free of any harmful solvent residues, which may eventually drive the global cold-pressed oil market.
The global cold-pressed oil market is segmented based on type, application, and distribution channel. Depending on type, the market is divided into coconut oil, cottonseed oil, olive oil, palm oil, palm kernel oil, peanut oil, rapeseed oil, soybean oil, and sunflower seed oil. By application, it is classified into food industry, agriculture, and cosmetics & personal care industry. Based on distribution channel, it is divided into convenience stores, departmental stores, modern trade units, and online retail.
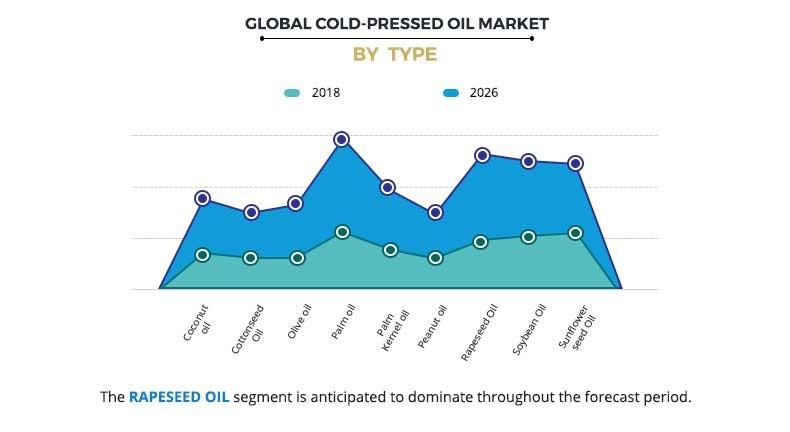
In 2018, the palm oil segment accounted maximum in the cold-pressed oil market share. This is due to health benefits it provides to the consumers such as reduction in cholesterol levels, boosts brain health, and improves skin and hair, and others.
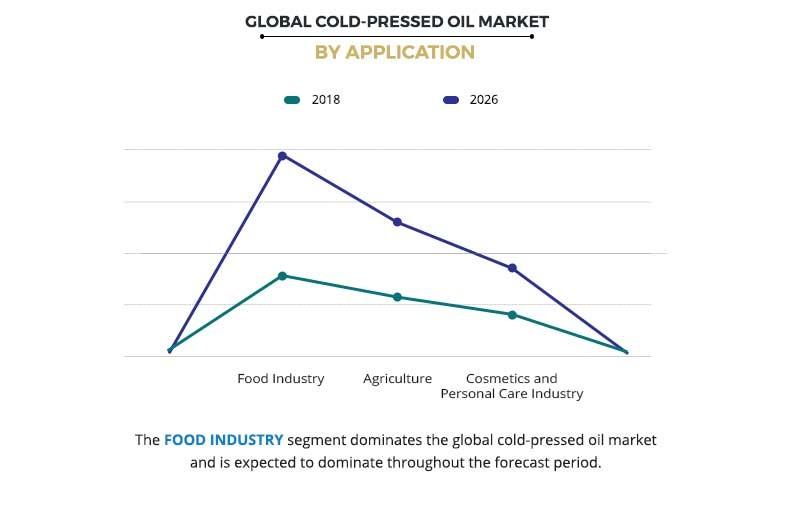
Based on application, the food industry contributed the maximum in this market in 2018 owing to its massive usage in cooking, in marinating salads and via dietary supplement. Also, in developed nations such as North America, people prefer virgin or cold-pressed oil in their diet as it has clinically proven health benefits. Furthermore, it is anticipated to grow at the highest growth rate during the cold-pressed oil market forecast period.
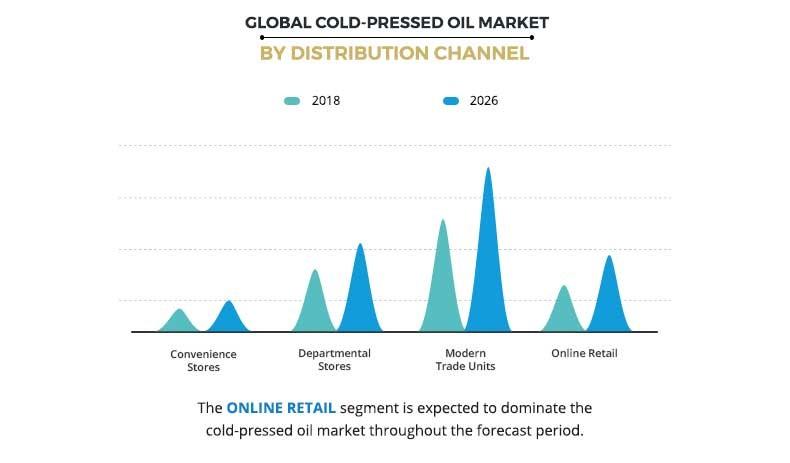
By distribution channel, the online retail segment is anticipate to grow at the highest growth rate. This is due to the convenience offered by online retailing. It reduces consumer search costs, making it easier to virtually compare different products and prices. In addition, online retail enables new distribution technologies that can reduce supply chain and distribution costs.
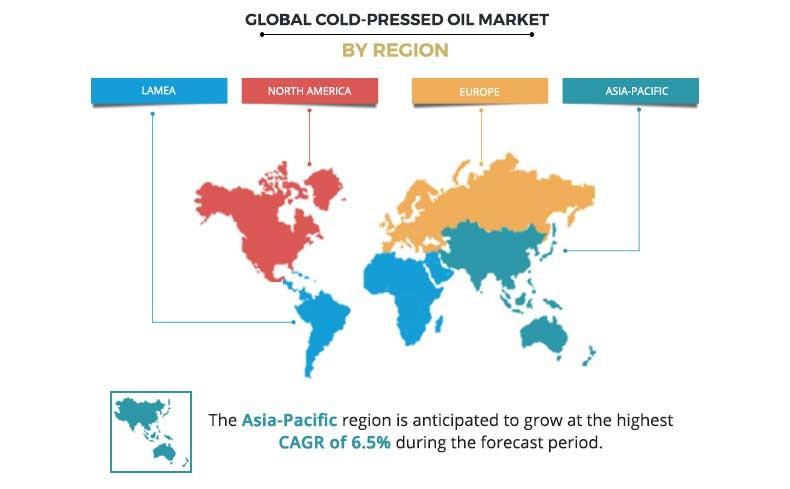
In 2018, based on region, North America is the leading segment in cold-pressed oil market owing to rise in health awareness among the population leading to healthy lifestyle. Also, the growth in concern among people regarding clean and pollution free environment propels the growth of the cold-pressed oil market in a developed nation such as North America.
Health conscious consumers are adopting healthy eating practices. As a result, products that contain functional nutrients and are beneficial for the health have gained wide acceptance all over the world. Cold-pressed oils do not contain added chemicals and preservatives and also do not destroy linoleic acid tissue, and is more green and healthy. Hence, these factors are anticipated to drive the growth of the global cold-pressed oil market during the forecast period.
The key players operating in the cold-pressed oil market analysis focus on prominent strategy to overcome competition and to maintain as well as improve their cold-pressed oil market share in worldwide. The key players profiled in the cold-pressed oil market includes Statfold Seed Oil Ltd, Freshmill Oils, Naissance Natural Healthy Living, Gramiyum Wood Pressed Cooking Oil, The Health Home Economist, Lala’s Group, Archer Daniels Midland Company, Cargill, Bunge, Wilmar International, and COFCO.
Key Benefits for Cold-pressed Oil Market:
- The report provides a quantitative analysis of the current market, estimations, trends, and dynamics of the cold-pressed oil market size from 2018 to 2026 to identify the prevailing market opportunities.
- The key countries in all the major regions are mapped based on the market share and cold-pressed oil market trends.
- Porter’s five forces analysis highlights the potency of the buyers and suppliers to enable stakeholders to make profit-oriented business decisions and strengthen their supplier–buyer network.
- In-depth analysis of the market segment and size assists to determine the prevailing market opportunities.
- Major countries in each region are mapped according to their revenue contribution to the global cold-pressed oil industry.
- Market player positioning segment facilitates benchmarking and provides a clear understanding of the present position of market players.
Cold-Pressed Oil Market Report Highlights
| Aspects | Details |
| By Type |
|
| By Application |
|
| By Distribution Channel |
|
| By Region |
|
| Key Market Players | Multi Technology (Gramiyum), FreshMill Oils, Naissance Trading, Archer-Daniels-Midland Company (ADM), China Agri-Industries Holdings Limited., Lala Jagdish Prasad & Company (LALA GROUP), Statfold Oil Ltd., Bunge Limited, Wilmar International Ltd, Cargill Inc. |
Analyst Review
Consumer’s shifting preferences toward healthy practices and changing cost dynamics have resulted in significant global imprint, particularly on the food & beverage industry. This changing landscape, aligned with the upcoming healthy trends and the growth trajectory that food & beverage industry is experiencing, increases the demand for cold pressed oil.
In 2018, the palm oil segment accounted for the highest share in the cold pressed oil market. This is due to reduction in cholesterol levels, boosts brain health, and improves skin and hair, and others.
Based on application, the food industry contributed the maximum in this market in 2018 owing to its massive usage in cooking, in marinating salads and via dietary supplement. Also, in developed nation such as North America, people prefer virgin or cold-pressed oil in their diet as it has clinically proven health benefits. Furthermore, it is anticipated to grow at the highest growth rate during the forecast period.
By distribution channel, the online retail segment is projected to grow at the highest growth rate. This is due to the convenience offered by online retailing. It reduces consumer search costs, making it easier to virtually compare different products and prices. In addition, online retail enables new distribution technologies that can reduce supply chain and distribution costs.
In 2018, based on region, North America is the leading segment in this market owing to increase in health awareness among the population leading to healthy lifestyle. Also, the rise in concern among people regarding clean and pollution free environment propel the growth of the cold-pressed oil market in a developed nation such as North America.
The global cold-pressed oil market size was valued at $24.62 billion in 2018, and is expected to reach $36.40 billion by 2026
The global Cold-Pressed Oil market is projected to grow at a compound annual growth rate of 5.3% to reach $36.40 billion by 2026
Statfold Oil Ltd., Wilmar International Ltd, Bunge Limited, Archer-Daniels-Midland Company (ADM), Naissance Trading, Multi Technology (Gramiyum), Cargill Inc., Lala Jagdish Prasad & Company (LALA GROUP), China Agri-Industries Holdings Limited., FreshMill Oils
North America is the leading segment in cold-pressed oil market
Major health issues such as itchy palm and foots, shortness of breath, and nasal blockage affect the cold-pressed oil market growth
Loading Table Of Content...

