
Collagen Peptide And Gelatin Market Research, 2034
Market Introduction and Definition
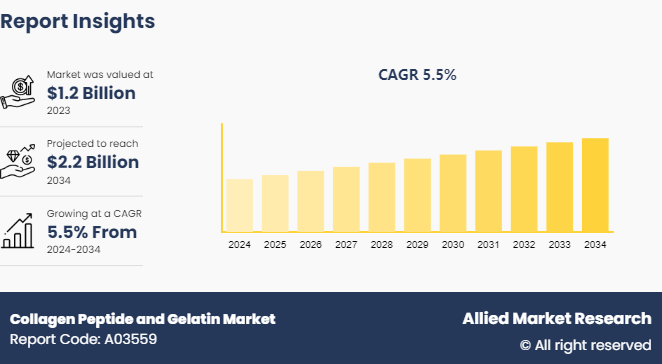
The global collagen peptide and gelatin market size was valued at $1.2 billion in 2023, and is projected to reach $2.2 billion by 2034, growing at a CAGR of 5.5% from 2024 to 2034. Collagen peptide and gelatin are both derived from collagen, which is a protein abundant in connective tissues. Collagen peptides are short chains of amino acids obtained by breaking down the full-length collagen molecule. They are easily digestible and commonly used in dietary supplements for skin, joint, and bone health. Gelatin is a form of collagen and is produced by boiling animal bones and connective tissues, which results in a substance that gels when cooled. Collagen peptides are used in improving skin elasticity and joint function, while gelatin is widely used in cooking, pharmaceuticals, and cosmetics for its gelling properties.
Key Takeaways
The collagen peptide and gelatin market forecast study covers 20 countries. The research includes a segment analysis of each country in terms of value ($Million) for the projected period 2023-2035.
More than 1, 500 product literatures, industry releases, annual reports, and other such documents of major energy storage system industry participants along with authentic industry journals, trade associations' releases, and government websites have been reviewed for generating high-value industry insights.
The study integrated high-quality data, professional opinions and analysis, and critical independent perspectives. The research approach is intended to provide a balanced view of global markets and assist stakeholders in making educated decisions to achieve their most ambitious growth objectives.
Key Market Dynamics
Consumers have become more health-conscious and proactive about their well-being; they increasingly seek out products that offer tangible health benefits. Collagen peptides are particularly popular due to their perceived benefits for skin health, joint pain relief, and overall vitality. The increasing focus on anti-aging and the proliferation of the beauty from within concept has prompted many individuals to add collagen supplements to their daily routines as collagen supplements enhance skin elasticity, diminish wrinkles, and promote healthy hair and nails. This shift toward preventive health measures and natural, functional ingredients boosts the demand for collagen peptides across various demographics.
Moreover, the rise in geriatric population further accelerates this trend. Older adults are particularly interested in products that help maintain joint health, bone density, and mobility, areas where collagen supplements have shown promise. Simultaneously, the rise of fitness and sports nutrition plays a critical role. Athletes and fitness enthusiasts use collagen peptides to enhance muscle recovery and protect joints, integrating them into their health regimens. This comprehensive appeal, spanning beauty, aging, and fitness, underscores the robust growth in the collagen peptides and gelatin market, driven by a collective shift toward holistic health and wellness solutions. Thus, all these factors contribute in the growth of collagen peptide and gelatin market share.
High production costs significantly restrain the market demand for collagen peptides and gelatin. The extraction and processing of these substances require advanced technology, exact quality control, and substantial raw material input, all of which raise production expenses. Moreover, these high costs are passed down to consumers, making collagen supplements and gelatin products relatively expensive. This premium pricing deters price-sensitive consumers and limits market reach and growth potential. Moreover, these elevated costs pose challenges for manufacturers, particularly smaller companies, in maintaining competitive pricing while ensuring product quality. The need for significant investment in production facilities and technology is a barrier, which reduces the number of market players and stifling innovation. In a competitive market with alternative products, such as plant-based proteins, the high cost of collagen and gelatin products lead consumers to opt for more affordable options and further restrain the market demand.
The rise in demand for natural health supplements creates substantial opportunities in the collagen peptide and gelatin market. As consumers become more health-conscious and seek natural ways to enhance their well-being, collagen peptides gain popularity for their benefits in improving skin elasticity, joint health, and bone strength. This trend drives a surge in demand for collagen-based supplements, prompting manufacturers to innovate and expand their product lines. By positioning collagen peptides as a natural and effective supplement, companies attract a broad audience looking for clean-label and scientifically backed health products. In addition, this demand for natural health supplements encourages the development of various formulations, such as powders, capsules, and functional foods, to cater to different consumer preferences. The appeal of collagen peptides as a versatile ingredient allows manufacturers to create diverse products that fit seamlessly into the daily routines of health-conscious consumers. Furthermore, the versatility combined with the rise in awareness of the benefits of collagen helps companies tap into new markets, expand their customer base, and drive the collagen peptide and gelatin market growth.
Value Chain of Global Collagen Peptide and Gelatin Market
The value chain of collagen peptide and gelatin industry begins with the sourcing of raw materials such as bovine hides and bones, porcine skin, and bones, as well as marine sources such as fish skin and scales. These raw materials then undergo a pretreatment process involving cleaning, dehairing, degreasing, and demineralization steps to prepare them for extraction. The next major stage is extraction, where collagen and gelatin are isolated from the pretreated raw materials using acid or alkaline extraction methods. This is followed by filtration and purification processes to remove impurities and obtain concentrated collagen and gelatin solutions. In the processing phase, collagen undergoes hydrolysis to break it down into smaller peptides, while gelatin solutions are dried and converted into sheets, granules, or powders. Both collagen peptides and gelatin then go through sterilization and packaging processes. The formulation stage involves blending the extracted and processed collagen peptides or gelatin into various end-products such as foods, nutritional supplements, cosmetics, and technical applications such as photography. Significant formulation expertise is required to incorporate these ingredients effectively. Furthermore, the value chain culminates in distribution and marketing activities. Collagen and gelatin manufacturers distribute their products to food, supplement, and cosmetic manufacturers through B2B channels. They engage in marketing and branding efforts to promote consumer collagen products directly to end-users.

Market Segmentation
The collagen peptide and gelatin market is segmented into type, source, application, and region. On the basis of type, the market is divided into gelatin and collagen peptides. As per source, the market is segregated into bovine, porcine, marine, and others. On the basis of application, the market is bifurcated into food & beverages, nutraceuticals & dietary supplements, pharmaceuticals, cosmetics & personal care, and others. Region wise, the market is analyzed across North America, Europe, Asia-Pacific, Latin America and Middle East and Africa.
Regional/ Country Market Outlook
North America dominates the collagen peptide and gelatin market as the region has a highly developed health and wellness industry, with consumers increasingly seeking products that promote overall well-being and longevity. This trend is fueled by a growing awareness of the benefits of collagen for skin health, joint function, and bone strength. The prevalence of an aging population, particularly in the U.S. further drives demand for collagen supplements to address age-related health concerns. Moreover, North America is home to numerous leading manufacturers and innovative companies in the collagen industry, facilitating advancements in product development and quality. These companies invest heavily in research and development to create new and effective collagen-based products, from dietary supplements to functional foods and beverages. The distribution networks and established retail infrastructure in the region ensure that these products are widely accessible to consumers. Furthermore, high disposable incomes and a strong focus on preventive healthcare among North American consumers contribute to the willingness to spend on premium health products, including collagen peptides and gelatin.
Industry Trends:
Consumers across the world are increasingly embracing a snacking lifestyle while becoming more health-conscious, favoring nutritious alternatives to traditional snacks. In the UK, from June 2021 around 25% of Gen Zs (16–24 years old) preferred snacks that are "low in calories." Meanwhile, 18% of millennials (25–34 years old) prioritized healthy snacks that are high in protein, and 36% of individuals over 55 sought snacks with "low" or "no sugar." In response, established industry players have developed various low-fat and low-calorie options to cater to these preferences.
Consumers are increasingly demanding clean-label products with minimal and natural ingredients. This trend drives the popularity of collagen peptides and gelatin derived from natural sources, emphasizing transparency in sourcing and processing. The rise of personalized nutrition, where dietary supplements are tailored to individual health needs and preferences, has become prominent. Customized collagen supplements addressing specific issues such as joint health, skin care, and muscle recovery have gained traction.
Competitive Landscape
The major players operating in the collagen peptide and gelatin market include Amicogen, Gelita AG, Tela Bio, Inc., Nitta Gelatin, Inc., Darling Ingredients, Lonza Group, Gelnex, Norland Products, Inc., Tessenderlo Group NV, and Ewald Gelatine.
Recent Key Strategies and Developments
In January 2023, Tela Bio, Inc., launched NIVIS Fibrillar Collagen pack, which is an absorbent matrix of bovine collagen proposed to manage moderately to heavy exudating wounds and to control minor bleeding.
In April 2023, Darling Ingredients acquired Brazilians Gelatin and Collagen Producer Gelnex, which is a global producer of gelatin and collagen products, for approximately $1.2 billion to serve the growing needs of its collagen customers while continuing to serve the growing gelatin market.
Key Sources Referred
Gelatine Organization
Gelatin Manufacturers of Europe
Cabi Digital Library Organization
The Organic Center
Food and Agriculture Organization of the United Nations (FAO)
ACS Publications
National Health and Nutrition Examination Survey
Key Benefits For Stakeholders
- This report provides a quantitative analysis of the market segments, current trends, estimations, and dynamics of the collagen peptide and gelatin market analysis from 2024 to 2034 to identify the prevailing collagen peptide and gelatin market opportunities.
- The market research is offered along with information related to key drivers, restraints, and opportunities.
- Porter's five forces analysis highlights the potency of buyers and suppliers to enable stakeholders make profit-oriented business decisions and strengthen their supplier-buyer network.
- In-depth analysis of the collagen peptide and gelatin market segmentation assists to determine the prevailing market opportunities.
- Major countries in each region are mapped according to their revenue contribution to the global market.
- Market player positioning facilitates benchmarking and provides a clear understanding of the present position of the market players.
- The report includes the analysis of the regional as well as global collagen peptide and gelatin market trends, key players, market segments, application areas, and market growth strategies.
Collagen Peptide and Gelatin Market Report Highlights
| Aspects | Details |
| Market Size By 2034 | USD 2.2 Billion |
| Growth Rate | CAGR of 5.5% |
| Forecast period | 2024 - 2034 |
| Report Pages | 345 |
| By Type |
|
| By Source |
|
| By Application |
|
| By Region |
|
| Key Market Players | Darling Ingredients, Gelnex, Nitta Gelatin, Inc., Gelita AG, Amicogen, Tessenderlo Group NV, Lonza Group, Norland Products, Inc., Ewald Gelatine, Tela Bio, Inc. |
Analyst Review
Collagen peptides find application in the dairy, confectionery, beverages, meat & fish products, and other pharmaceutical and food products and are used to improve the organoleptic properties. Gelatin is a colorless, translucent, flavorless, and brittle food additive derived from collagen present in several animal body parts. Gelatin is generally used as a jelling agent in pharmaceutical drugs, food, photography, vitamin capsules, and production of cosmetic.
The collagen peptide and gelatin industry is expected to witness a robust growth during the forecast period. This is attributed to increase in disposable income in the developing countries, change in lifestyle of consumers, and increase in awareness of the health benefits of collagen food and beverage products, such as higher composition of protein content and health benefits. Moreover, rise in demand for collagen peptide and gelatin among health supplement manufacturing companies has fueled the growth of the global collagen peptide and gelatin market.
The global collagen peptide and gelatin market size was valued at $1.2 billion in 2023, and is projected to reach $2.2 billion by 2034
The global Collagen Peptide and Gelatin market is projected to grow at a compound annual growth rate of 5.5% from 2024 to 2034 $2.2 billion by 2034
The major players operating in the collagen peptide and gelatin market include Amicogen, Gelita AG, Tela Bio, Inc., Nitta Gelatin, Inc., Darling Ingredients, Lonza Group, Gelnex, Norland Products, Inc., Tessenderlo Group NV, and Ewald Gelatine.
North America dominates the collagen peptide and gelatin market as the region has a highly developed health and wellness industry, with consumers increasingly seeking products that promote overall well-being and longevity.
Health And Wellness Trends, Aging Population, Beauty And Personal Care
Loading Table Of Content...

