0
2023
Data Center Rack Market

Data Center Rack Market

by Component (Solution, Service), by Rack Type (Cabinets/ Enclosed Racks, Open Frame Rack), by Data Center Size (Large Data Centers, Small and Mid-sized Data Centers), by Rack Height (42U and Below, 43U up to 52U, Above 52U), by Industry Vertical (BFSI, Manufacturing, IT and Telecom, Retail, Healthcare, Media and Entertainment, Others): Global Opportunity Analysis and Industry Forecast, 2021-2031

Report Code: A07462
Jan 2023 | Pages: 503
Tables: 176
Charts: 82
  • Formats*:

  • pdf

    Single User License, Five User
    License & Enterprise User License

  • xls

    Data Pack Excel License

  • ppt

    It comes with the additional cost
    of $2500.00 contact sales.


Data Center Rack Market Research, 2031

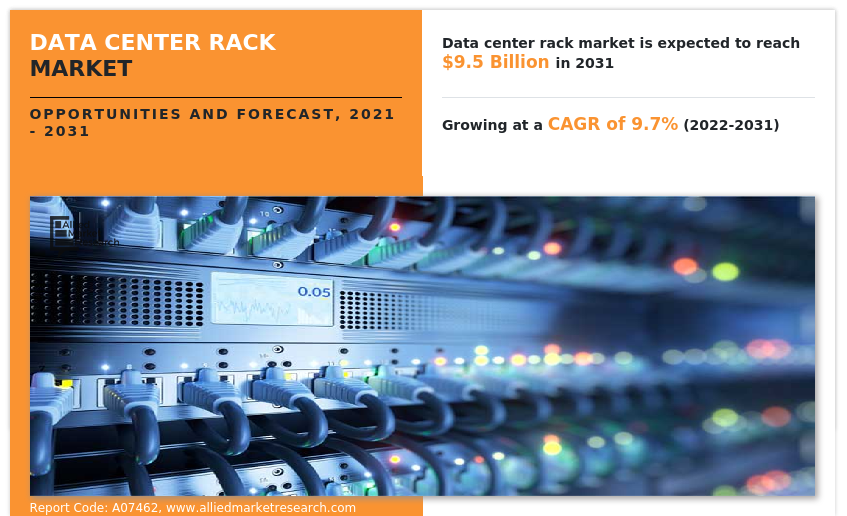
The global data center rack market was valued at $3.9 billion in 2021, and is projected to reach $9.5 billion by 2031, growing at a CAGR of 9.7% from 2022 to 2031.

The COVID-19 outbreak has a positive impact on the growth of the data center rack market as data center rack technologies are helping enterprises to address the extensive capacity demand data storage. There is growing need to ensure the data center rack service provider are having enough ability and capacity to deliver data center rack solution with high performance during the increased data storage demand.

A data center rack is a framework that is designed to house servers and other data center computing equipment. Data center racks are an essential part of a data center to keep everything nicely organized. A data center rack’s structure allows placing data center equipment’s, networking devices, and cables easily. Racks are mainly designed to host components such as networking equipment, telecommunication equipment, cooling systems, and UPS. Moreover, data center racks can come in different form factors, including rack-mounted or blade servers. Racks are mostly designed with specific slots to allow connecting electrical, networking, and internet cables easily. It is also important for proper data center cooling. Racks that allow proper airflow let the circulation of air to cool the components. Racks can also protect valuable devices against impacts or disasters such as earthquakes. Hence, many organizations such as IT, retail, and other sectors are adopting data center rack due to its benefits. This factor creates lucrative growth opportunities in the market during the forecast period.

On the contrary, server virtualization is getting popular and remote control gains more attention, such factors positively impacting the growth of the market. In addition, increase in adoption of data center rack technology across enterprises to enhance operation & productivity, propel the growth of the market for future. Furthermore, stringent security requirement and increase demand for more compact and scalable server types are expected to provide the lucrative growth opportunities for the market during the forecast period. However, data security and improper power management and UPS battery failures, hamper the growth of the market.
Data Center Rack Market

The data center rack market is segmented into component, rack type, data center size, rack height and industry vertical.

The data center rack market is segmented into component, rack type, data center size, industry vertical, rack height and region. By component, it is bifurcated into solution and service. By rack type, it is divided into cabinets/ enclosed racks and open frame rack. By data center size, the market is segregated into large data centers and small and mid-sized data centers. Basis of rack height, market is classified into below 42U, 43U up to 52U and above 52U. By industry vertical, the market is classified into BFSI, manufacturing, IT & telecom, retail, healthcare, media and entertainment and others. Region wise, it is analyzed across North America, Europe, Asia-Pacific, and LAMEA.
Data Center Rack Market

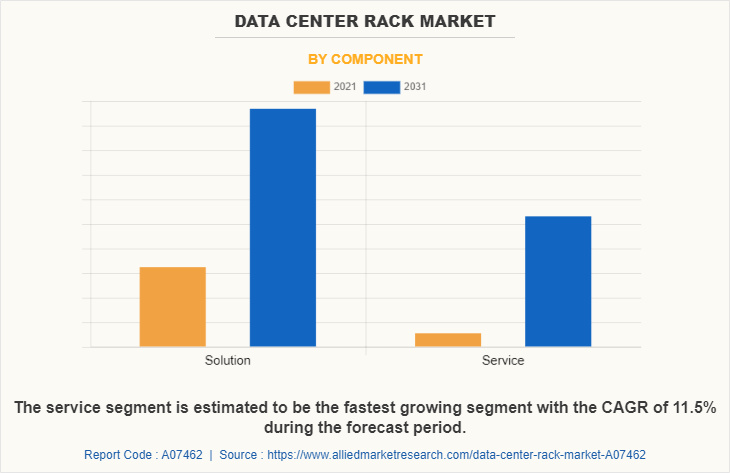
Depending on the component, the solution segment dominated the data center rack market share in 2021 and is expected to continue this trend during the forecast period. owing to advances in technologies enabling data center rack to transform industries worldwide, from financial services, to manufacturing, healthcare, and many others, drive the growth of the market. However, the services segment has the highest growth market share in the upcoming year. The adoption of data center rack services enhances software implementation, maximize the value of existing installation by optimizing it, and minimize the deployment cost & risks, and others, further fuel the data center rack market growth for this segment.
Data Center Rack Market

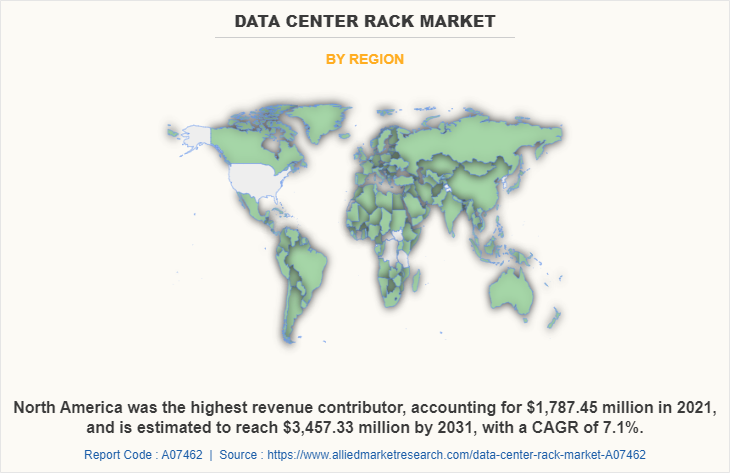
By region, North America dominated the market share in 2021 for the data center rack market. The increasing investment in advanced technologies and rising adoption of data center rack solution to improve businesses and the customer experience are anticipated to provide lucrative growth opportunities for the data center rack market in North America. However, Asia-Pacific is expected to exhibit highest growth during the forecast period. This is attributed to increase in penetration of digitalization and higher adoption of advanced technology that propel the growth of the data center rack industry in this region.

COVID-19 Impact Analysis

The current estimation of 2031 is projected to be higher than pre-COVID-19 estimates. The COVID-19 outbreak has a positive impact on the growth of the data center rack market as data center rack technologies are helping enterprises to address the extensive capacity demand data storage. There is growing need to ensure the data center rack service provider are having enough ability and capacity to deliver data center rack solution with high performance during the increased data storage demand.

Therefore, service providers, such as local data center operator and provider, are making considerable investments in data center rack in a number of use cases. Moreover, the COVID-19 pandemic is opportunistic for the data center rack market forecast as organizations across the globe are adopting data center rack to enable their business objective during work from home initiatives. However, some countries are experiencing reduction in demand for data center rack service.

For instance, in the Middle East, the dual effects of COVID-19 and sharp oil price reduction have had manifold economic consequences across the Gulf region. They have significantly provoke the demand shock of a hydrocarbon industry already contending with a global slowdown, which reduce the demand for data center rack service in the region Rapid spread of COVID-19 has considerably augmented data traffic. In addition, upsurge has been witnessed in the storage volume requirement due to the pandemic driven by proliferation of emerging technologies such as artificial intelligence (AI), big data, and Internet of things (IoT). This will continue to drive the data center rack investments across the globe..

Although COVID-19 has severely impacted various industries, the data center rack market is expected to witness moderate impact of COVID-19, due to major shift toward digital transformation, increase in investments in data analytics, rise in adoption of AI and ML, advent of autonomous vehicles and drones, and surge in need for tracking real-time information. Such trends are expected to boost the data center rack market trends during the forecast period.

Key Strategies/Development:

  • For instance, in April 2022 - Rittal, a global manufacturer and system solutions provider of industrial and IT enclosures, announced a U.S. partnership with TD SYNNEX, a global distributor and solutions aggregator for the IT ecosystem. Through the partnership, Rittal distributes IT rack enclosures, solutions, and accessories to information technology (IT) customers through TD SYNNEX.
  • For instance, in September 2021 - Oracle announced the launch of Oracle Exadata X9M platforms, the latest version of the industry’s fastest and most affordable systems for running Oracle Database. The new Exadata X9M offerings include Oracle Exadata Database Machine X9M and Exadata Cloud-Customer X9M, the only platform that runs Oracle Autonomous Database in customer data centers.
  • For instance, in June 2020 - Fujitsu announced the expansion of its storage portfolio with four new series of the Fujitsu Storage ETERNUS, that leverage NetApp's advanced data management software. This launch represents the next step of Fujitsu's strategic partnership with NetApp in offering a data management infrastructure that supports digital transformation.
  • For instance, in February 2020 - Power management company Eaton announced that it has acquired Power Distribution, Inc. (PDI), a leading supplier of mission-critical power distribution, static switching, and power monitoring equipment and services for data centers and industrial and commercial customers.
  • For instance, in December 2019 - Schneider Electric, the leader in digital transformation of energy management and automation, with Avnet and Iceotope, announced the creation of the industry’s first commercially available integrated rack with chassis-based, immersive liquid cooling. Optimized for compute-intensive applications, the solution combines a high-powered GPU server with Iceotope’s liquid cooling technology to increase energy efficiency.

Top Impacting Factors  

Increasing the use of AI:

Physical security breaches can sometimes be the result of human error. To minimize this risk, integrate AI-based technology into data center rack security to transform it into a preventative, pre-emptive, and proactive defense system, such factors drive the growth of the market.   Security surveillance, environmental monitoring, and condition-based maintenance are possible with the actionable intelligence generated by AI. With the assistance of AI, data center rack can leverage predictive analytics capabilities that help them identify the waning functionality of a security device. This allows security teams to rectify the situation before problems arise that could harm a data center.

With the rapid expansion of data center racks, more solutions are needed to ensure their security during this period of expansion. Such emerging trends can enable their continued protection and also help to build a solid security system  culture driven by everyone within the organization.

Server virtualization is getting popular:

Virtualization technology drives data center rack to move towards virtualized data centers. The last decade has seen overwhelming virtualization dominating enterprise data center rack. Server virtualization is one of the most significant infrastructures in data center rack virtualization. Through virtualization, a single physical server can house multiple virtual servers.

Server virtualization is an inevitable trend, as it is a great way to maximize the physical infrastructure space and reduce capital costs. Server virtualization makes full use of public cloud resources, which eliminates the challenges caused by limited data center rack floor space. Meanwhile, the advent of cloud computing requires high-scale network servers, which increase the servers deployed in the existing data center floors.

Remote control gains more attention:

New technology and the global pandemic have resharpened how data center rack work. Changes in data center rack have brought a lot of transformation in infrastructures. Though remote control is not a new norm, it gains more attention in the face of the pandemic. Many operators who are working at home are not able to go to the field to manage the server infrastructures. Whether renting servers or choosing collocation data centers, network servers with remote control function is the best selection these days.

KEY BENEFITS FOR STAKEHOLDERS

  • The study provides an in-depth data center rack market analysis along with the current trends and future estimations to elucidate the imminent investment pockets.
  • Information about key drivers, restrains, and opportunities and their impact analysis on the data center rack market size is provided in the report.
  • The Porter’s five forces analysis illustrates the potency of buyers and suppliers operating in the data center rack industry.
  • The quantitative analysis of the global data center rack market for the period 2021–2031 is provided to determine the data center rack market potential.

Data Center Rack Market Report Highlights

Aspects Details
Market Size By 2031 USD 9.5 billion
Growth Rate CAGR of 9.7%
Forecast period 2021 - 2031
Report Pages 503
By Component
  • Solution
  • Service
By Rack Type
  • Cabinets/ Enclosed Racks
  • Open Frame Rack
By Data Center Size
  • Large Data Centers
  • Small and Mid-sized Data Centers
By Rack Height
  • 42U and Below
  • 43U up to 52U
  • Above 52U
By Industry Vertical
  • BFSI
  • Manufacturing
  • IT and Telecom
  • Retail
  • Healthcare
  • Media and Entertainment
  • Others
By Region
  • North America  (U.S., Canada)
  • Europe  (UK, Germany, France, Italy, Spain, Rest of Europe)
  • Asia-Pacific  (China, Japan, India, Australia, South Korea, Rest of Asia-Pacific)
  • LAMEA  (Latin America, Middle East, Africa)
Key Market Players Eaton Corporation, Fujitsu, Dell Technologies Inc., Rittal GmbH & Co. KG, Great Lakes Data Racks & Cabinets, Black Box, Schneider Electric, Samsung Electronics Co., Ltd, Hewlett Packard Enterprise Development LP, Oracle Corporation
 
  • CHAPTER 1: INTRODUCTION

    • 1.1. Report description

    • 1.2. Key market segments

    • 1.3. Key benefits to the stakeholders

    • 1.4. Research Methodology

      • 1.4.1. Primary research

      • 1.4.2. Secondary research

      • 1.4.3. Analyst tools and models

  • CHAPTER 2: EXECUTIVE SUMMARY

    • 2.1. CXO Perspective

  • CHAPTER 3: MARKET OVERVIEW

    • 3.1. Market definition and scope

    • 3.2. Key findings

      • 3.2.1. Top impacting factors

      • 3.2.2. Top investment pockets

    • 3.3. Porter’s five forces analysis

      • 3.3.1. Moderate bargaining power of suppliers

      • 3.3.2. High bargaining power of buyers

      • 3.3.3. Low threat of substitutes

      • 3.3.4. High threat of new entrants

      • 3.3.5. Moderate intensity of rivalry

    • 3.4. Market dynamics

      • 3.4.1. Drivers

        • 3.4.1.1. Increasing the use of AI.
        • 3.4.1.2. Server virtualization is getting popular.
        • 3.4.1.3. Remote control gains more attention.
        • 3.4.1.4. Increasing demand for more compact and scalable server types.

      • 3.4.2. Restraints

        • 3.4.2.1. Poor power management.
        • 3.4.2.2. Capacity planning.
        • 3.4.2.3. Balancing cost controls with efficiency.
        • 3.4.2.4. Time-consuming implementation.

      • 3.4.3. Opportunities

        • 3.4.3.1. Stringent security requirement.
        • 3.4.3.2. Emergence of server cooling technologies.

    • 3.5. COVID-19 Impact Analysis on the market

  • CHAPTER 4: DATA CENTER RACK MARKET, BY COMPONENT

    • 4.1. Overview

      • 4.1.1. Market size and forecast

    • 4.2. Solution

      • 4.2.1. Key market trends, growth factors and opportunities

      • 4.2.2. Market size and forecast, by region

      • 4.2.3. Market share analysis by country

    • 4.3. Service

      • 4.3.1. Key market trends, growth factors and opportunities

      • 4.3.2. Market size and forecast, by region

      • 4.3.3. Market share analysis by country

  • CHAPTER 5: DATA CENTER RACK MARKET, BY RACK TYPE

    • 5.1. Overview

      • 5.1.1. Market size and forecast

    • 5.2. Cabinets/ Enclosed Racks

      • 5.2.1. Key market trends, growth factors and opportunities

      • 5.2.2. Market size and forecast, by region

      • 5.2.3. Market share analysis by country

    • 5.3. Open Frame Rack

      • 5.3.1. Key market trends, growth factors and opportunities

      • 5.3.2. Market size and forecast, by region

      • 5.3.3. Market share analysis by country

  • CHAPTER 6: DATA CENTER RACK MARKET, BY DATA CENTER SIZE

    • 6.1. Overview

      • 6.1.1. Market size and forecast

    • 6.2. Large Data Centers

      • 6.2.1. Key market trends, growth factors and opportunities

      • 6.2.2. Market size and forecast, by region

      • 6.2.3. Market share analysis by country

    • 6.3. Small and Mid-sized Data Centers

      • 6.3.1. Key market trends, growth factors and opportunities

      • 6.3.2. Market size and forecast, by region

      • 6.3.3. Market share analysis by country

  • CHAPTER 7: DATA CENTER RACK MARKET, BY RACK HEIGHT

    • 7.1. Overview

      • 7.1.1. Market size and forecast

    • 7.2. 42U and Below

      • 7.2.1. Key market trends, growth factors and opportunities

      • 7.2.2. Market size and forecast, by region

      • 7.2.3. Market share analysis by country

    • 7.3. 43U up to 52U

      • 7.3.1. Key market trends, growth factors and opportunities

      • 7.3.2. Market size and forecast, by region

      • 7.3.3. Market share analysis by country

    • 7.4. Above 52U

      • 7.4.1. Key market trends, growth factors and opportunities

      • 7.4.2. Market size and forecast, by region

      • 7.4.3. Market share analysis by country

  • CHAPTER 8: DATA CENTER RACK MARKET, BY INDUSTRY VERTICAL

    • 8.1. Overview

      • 8.1.1. Market size and forecast

    • 8.2. BFSI

      • 8.2.1. Key market trends, growth factors and opportunities

      • 8.2.2. Market size and forecast, by region

      • 8.2.3. Market share analysis by country

    • 8.3. Manufacturing

      • 8.3.1. Key market trends, growth factors and opportunities

      • 8.3.2. Market size and forecast, by region

      • 8.3.3. Market share analysis by country

    • 8.4. IT and Telecom

      • 8.4.1. Key market trends, growth factors and opportunities

      • 8.4.2. Market size and forecast, by region

      • 8.4.3. Market share analysis by country

    • 8.5. Retail

      • 8.5.1. Key market trends, growth factors and opportunities

      • 8.5.2. Market size and forecast, by region

      • 8.5.3. Market share analysis by country

    • 8.6. Healthcare

      • 8.6.1. Key market trends, growth factors and opportunities

      • 8.6.2. Market size and forecast, by region

      • 8.6.3. Market share analysis by country

    • 8.7. Media and Entertainment

      • 8.7.1. Key market trends, growth factors and opportunities

      • 8.7.2. Market size and forecast, by region

      • 8.7.3. Market share analysis by country

    • 8.8. Others

      • 8.8.1. Key market trends, growth factors and opportunities

      • 8.8.2. Market size and forecast, by region

      • 8.8.3. Market share analysis by country

  • CHAPTER 9: DATA CENTER RACK MARKET, BY REGION

    • 9.1. Overview

      • 9.1.1. Market size and forecast By Region

    • 9.2. North America

      • 9.2.1. Key trends and opportunities

      • 9.2.2. Market size and forecast, by Component

      • 9.2.3. Market size and forecast, by Rack Type

      • 9.2.4. Market size and forecast, by Data Center Size

      • 9.2.5. Market size and forecast, by Rack Height

      • 9.2.6. Market size and forecast, by Industry Vertical

      • 9.2.7. Market size and forecast, by country

        • 9.2.7.1. U.S.
          • 9.2.7.1.1. Key market trends, growth factors and opportunities
          • 9.2.7.1.2. Market size and forecast, by Component
          • 9.2.7.1.3. Market size and forecast, by Rack Type
          • 9.2.7.1.4. Market size and forecast, by Data Center Size
          • 9.2.7.1.5. Market size and forecast, by Rack Height
          • 9.2.7.1.6. Market size and forecast, by Industry Vertical
        • 9.2.7.2. Canada
          • 9.2.7.2.1. Key market trends, growth factors and opportunities
          • 9.2.7.2.2. Market size and forecast, by Component
          • 9.2.7.2.3. Market size and forecast, by Rack Type
          • 9.2.7.2.4. Market size and forecast, by Data Center Size
          • 9.2.7.2.5. Market size and forecast, by Rack Height
          • 9.2.7.2.6. Market size and forecast, by Industry Vertical
    • 9.3. Europe

      • 9.3.1. Key trends and opportunities

      • 9.3.2. Market size and forecast, by Component

      • 9.3.3. Market size and forecast, by Rack Type

      • 9.3.4. Market size and forecast, by Data Center Size

      • 9.3.5. Market size and forecast, by Rack Height

      • 9.3.6. Market size and forecast, by Industry Vertical

      • 9.3.7. Market size and forecast, by country

        • 9.3.7.1. UK
          • 9.3.7.1.1. Key market trends, growth factors and opportunities
          • 9.3.7.1.2. Market size and forecast, by Component
          • 9.3.7.1.3. Market size and forecast, by Rack Type
          • 9.3.7.1.4. Market size and forecast, by Data Center Size
          • 9.3.7.1.5. Market size and forecast, by Rack Height
          • 9.3.7.1.6. Market size and forecast, by Industry Vertical
        • 9.3.7.2. Germany
          • 9.3.7.2.1. Key market trends, growth factors and opportunities
          • 9.3.7.2.2. Market size and forecast, by Component
          • 9.3.7.2.3. Market size and forecast, by Rack Type
          • 9.3.7.2.4. Market size and forecast, by Data Center Size
          • 9.3.7.2.5. Market size and forecast, by Rack Height
          • 9.3.7.2.6. Market size and forecast, by Industry Vertical
        • 9.3.7.3. France
          • 9.3.7.3.1. Key market trends, growth factors and opportunities
          • 9.3.7.3.2. Market size and forecast, by Component
          • 9.3.7.3.3. Market size and forecast, by Rack Type
          • 9.3.7.3.4. Market size and forecast, by Data Center Size
          • 9.3.7.3.5. Market size and forecast, by Rack Height
          • 9.3.7.3.6. Market size and forecast, by Industry Vertical
        • 9.3.7.4. Italy
          • 9.3.7.4.1. Key market trends, growth factors and opportunities
          • 9.3.7.4.2. Market size and forecast, by Component
          • 9.3.7.4.3. Market size and forecast, by Rack Type
          • 9.3.7.4.4. Market size and forecast, by Data Center Size
          • 9.3.7.4.5. Market size and forecast, by Rack Height
          • 9.3.7.4.6. Market size and forecast, by Industry Vertical
        • 9.3.7.5. Spain
          • 9.3.7.5.1. Key market trends, growth factors and opportunities
          • 9.3.7.5.2. Market size and forecast, by Component
          • 9.3.7.5.3. Market size and forecast, by Rack Type
          • 9.3.7.5.4. Market size and forecast, by Data Center Size
          • 9.3.7.5.5. Market size and forecast, by Rack Height
          • 9.3.7.5.6. Market size and forecast, by Industry Vertical
        • 9.3.7.6. Rest of Europe
          • 9.3.7.6.1. Key market trends, growth factors and opportunities
          • 9.3.7.6.2. Market size and forecast, by Component
          • 9.3.7.6.3. Market size and forecast, by Rack Type
          • 9.3.7.6.4. Market size and forecast, by Data Center Size
          • 9.3.7.6.5. Market size and forecast, by Rack Height
          • 9.3.7.6.6. Market size and forecast, by Industry Vertical
    • 9.4. Asia-Pacific

      • 9.4.1. Key trends and opportunities

      • 9.4.2. Market size and forecast, by Component

      • 9.4.3. Market size and forecast, by Rack Type

      • 9.4.4. Market size and forecast, by Data Center Size

      • 9.4.5. Market size and forecast, by Rack Height

      • 9.4.6. Market size and forecast, by Industry Vertical

      • 9.4.7. Market size and forecast, by country

        • 9.4.7.1. China
          • 9.4.7.1.1. Key market trends, growth factors and opportunities
          • 9.4.7.1.2. Market size and forecast, by Component
          • 9.4.7.1.3. Market size and forecast, by Rack Type
          • 9.4.7.1.4. Market size and forecast, by Data Center Size
          • 9.4.7.1.5. Market size and forecast, by Rack Height
          • 9.4.7.1.6. Market size and forecast, by Industry Vertical
        • 9.4.7.2. Japan
          • 9.4.7.2.1. Key market trends, growth factors and opportunities
          • 9.4.7.2.2. Market size and forecast, by Component
          • 9.4.7.2.3. Market size and forecast, by Rack Type
          • 9.4.7.2.4. Market size and forecast, by Data Center Size
          • 9.4.7.2.5. Market size and forecast, by Rack Height
          • 9.4.7.2.6. Market size and forecast, by Industry Vertical
        • 9.4.7.3. India
          • 9.4.7.3.1. Key market trends, growth factors and opportunities
          • 9.4.7.3.2. Market size and forecast, by Component
          • 9.4.7.3.3. Market size and forecast, by Rack Type
          • 9.4.7.3.4. Market size and forecast, by Data Center Size
          • 9.4.7.3.5. Market size and forecast, by Rack Height
          • 9.4.7.3.6. Market size and forecast, by Industry Vertical
        • 9.4.7.4. Australia
          • 9.4.7.4.1. Key market trends, growth factors and opportunities
          • 9.4.7.4.2. Market size and forecast, by Component
          • 9.4.7.4.3. Market size and forecast, by Rack Type
          • 9.4.7.4.4. Market size and forecast, by Data Center Size
          • 9.4.7.4.5. Market size and forecast, by Rack Height
          • 9.4.7.4.6. Market size and forecast, by Industry Vertical
        • 9.4.7.5. South Korea
          • 9.4.7.5.1. Key market trends, growth factors and opportunities
          • 9.4.7.5.2. Market size and forecast, by Component
          • 9.4.7.5.3. Market size and forecast, by Rack Type
          • 9.4.7.5.4. Market size and forecast, by Data Center Size
          • 9.4.7.5.5. Market size and forecast, by Rack Height
          • 9.4.7.5.6. Market size and forecast, by Industry Vertical
        • 9.4.7.6. Rest of Asia-Pacific
          • 9.4.7.6.1. Key market trends, growth factors and opportunities
          • 9.4.7.6.2. Market size and forecast, by Component
          • 9.4.7.6.3. Market size and forecast, by Rack Type
          • 9.4.7.6.4. Market size and forecast, by Data Center Size
          • 9.4.7.6.5. Market size and forecast, by Rack Height
          • 9.4.7.6.6. Market size and forecast, by Industry Vertical
    • 9.5. LAMEA

      • 9.5.1. Key trends and opportunities

      • 9.5.2. Market size and forecast, by Component

      • 9.5.3. Market size and forecast, by Rack Type

      • 9.5.4. Market size and forecast, by Data Center Size

      • 9.5.5. Market size and forecast, by Rack Height

      • 9.5.6. Market size and forecast, by Industry Vertical

      • 9.5.7. Market size and forecast, by country

        • 9.5.7.1. Latin America
          • 9.5.7.1.1. Key market trends, growth factors and opportunities
          • 9.5.7.1.2. Market size and forecast, by Component
          • 9.5.7.1.3. Market size and forecast, by Rack Type
          • 9.5.7.1.4. Market size and forecast, by Data Center Size
          • 9.5.7.1.5. Market size and forecast, by Rack Height
          • 9.5.7.1.6. Market size and forecast, by Industry Vertical
        • 9.5.7.2. Middle East
          • 9.5.7.2.1. Key market trends, growth factors and opportunities
          • 9.5.7.2.2. Market size and forecast, by Component
          • 9.5.7.2.3. Market size and forecast, by Rack Type
          • 9.5.7.2.4. Market size and forecast, by Data Center Size
          • 9.5.7.2.5. Market size and forecast, by Rack Height
          • 9.5.7.2.6. Market size and forecast, by Industry Vertical
        • 9.5.7.3. Africa
          • 9.5.7.3.1. Key market trends, growth factors and opportunities
          • 9.5.7.3.2. Market size and forecast, by Component
          • 9.5.7.3.3. Market size and forecast, by Rack Type
          • 9.5.7.3.4. Market size and forecast, by Data Center Size
          • 9.5.7.3.5. Market size and forecast, by Rack Height
          • 9.5.7.3.6. Market size and forecast, by Industry Vertical
  • CHAPTER 10: COMPETITIVE LANDSCAPE

    • 10.1. Introduction

    • 10.2. Top winning strategies

    • 10.3. Product Mapping of Top 10 Player

    • 10.4. Competitive Dashboard

    • 10.5. Competitive Heatmap

    • 10.6. Top player positioning, 2021

  • CHAPTER 11: COMPANY PROFILES

    • 11.1. Black Box

      • 11.1.1. Company overview

      • 11.1.2. Key Executives

      • 11.1.3. Company snapshot

      • 11.1.4. Operating business segments

      • 11.1.5. Product portfolio

      • 11.1.6. Business performance

    • 11.2. Eaton Corporation

      • 11.2.1. Company overview

      • 11.2.2. Key Executives

      • 11.2.3. Company snapshot

      • 11.2.4. Operating business segments

      • 11.2.5. Product portfolio

      • 11.2.6. Business performance

      • 11.2.7. Key strategic moves and developments

    • 11.3. Great Lakes Data Racks & Cabinets

      • 11.3.1. Company overview

      • 11.3.2. Key Executives

      • 11.3.3. Company snapshot

      • 11.3.4. Operating business segments

      • 11.3.5. Product portfolio

    • 11.4. Oracle Corporation

      • 11.4.1. Company overview

      • 11.4.2. Key Executives

      • 11.4.3. Company snapshot

      • 11.4.4. Operating business segments

      • 11.4.5. Product portfolio

      • 11.4.6. Business performance

      • 11.4.7. Key strategic moves and developments

    • 11.5. Rittal GmbH & Co. KG

      • 11.5.1. Company overview

      • 11.5.2. Key Executives

      • 11.5.3. Company snapshot

      • 11.5.4. Operating business segments

      • 11.5.5. Product portfolio

      • 11.5.6. Key strategic moves and developments

    • 11.6. Samsung Electronics Co., Ltd

      • 11.6.1. Company overview

      • 11.6.2. Key Executives

      • 11.6.3. Company snapshot

      • 11.6.4. Operating business segments

      • 11.6.5. Product portfolio

      • 11.6.6. Business performance

    • 11.7. Schneider Electric

      • 11.7.1. Company overview

      • 11.7.2. Key Executives

      • 11.7.3. Company snapshot

      • 11.7.4. Operating business segments

      • 11.7.5. Product portfolio

      • 11.7.6. Business performance

      • 11.7.7. Key strategic moves and developments

    • 11.8. Hewlett Packard Enterprise Development LP

      • 11.8.1. Company overview

      • 11.8.2. Key Executives

      • 11.8.3. Company snapshot

      • 11.8.4. Operating business segments

      • 11.8.5. Product portfolio

      • 11.8.6. Business performance

    • 11.9. Fujitsu

      • 11.9.1. Company overview

      • 11.9.2. Key Executives

      • 11.9.3. Company snapshot

      • 11.9.4. Operating business segments

      • 11.9.5. Product portfolio

      • 11.9.6. Business performance

      • 11.9.7. Key strategic moves and developments

    • 11.10. Dell Technologies Inc.

      • 11.10.1. Company overview

      • 11.10.2. Key Executives

      • 11.10.3. Company snapshot

      • 11.10.4. Operating business segments

      • 11.10.5. Product portfolio

      • 11.10.6. Business performance

  • LIST OF TABLES

  • TABLE 01. GLOBAL DATA CENTER RACK MARKET, BY COMPONENT, 2021-2031 (REVENUE, $MILLION)
    TABLE 02. DATA CENTER RACK MARKET FOR SOLUTION, BY REGION, 2021-2031 (REVENUE, $MILLION)
    TABLE 03. DATA CENTER RACK MARKET FOR SERVICE, BY REGION, 2021-2031 (REVENUE, $MILLION)
    TABLE 04. GLOBAL DATA CENTER RACK MARKET, BY RACK TYPE, 2021-2031 (REVENUE, $MILLION)
    TABLE 05. DATA CENTER RACK MARKET FOR CABINETS/ ENCLOSED RACKS, BY REGION, 2021-2031 (REVENUE, $MILLION)
    TABLE 06. DATA CENTER RACK MARKET FOR OPEN FRAME RACK, BY REGION, 2021-2031 (REVENUE, $MILLION)
    TABLE 07. GLOBAL DATA CENTER RACK MARKET, BY DATA CENTER SIZE, 2021-2031 (REVENUE, $MILLION)
    TABLE 08. DATA CENTER RACK MARKET FOR LARGE DATA CENTERS, BY REGION, 2021-2031 (REVENUE, $MILLION)
    TABLE 09. DATA CENTER RACK MARKET FOR SMALL AND MID-SIZED DATA CENTERS, BY REGION, 2021-2031 (REVENUE, $MILLION)
    TABLE 10. GLOBAL DATA CENTER RACK MARKET, BY RACK HEIGHT, 2021-2031 (REVENUE, $MILLION)
    TABLE 11. DATA CENTER RACK MARKET FOR 42U AND BELOW, BY REGION, 2021-2031 (REVENUE, $MILLION)
    TABLE 12. DATA CENTER RACK MARKET FOR 43U UP TO 52U, BY REGION, 2021-2031 (REVENUE, $MILLION)
    TABLE 13. DATA CENTER RACK MARKET FOR ABOVE 52U, BY REGION, 2021-2031 (REVENUE, $MILLION)
    TABLE 14. GLOBAL DATA CENTER RACK MARKET, BY INDUSTRY VERTICAL, 2021-2031 (REVENUE, $MILLION)
    TABLE 15. DATA CENTER RACK MARKET FOR BFSI, BY REGION, 2021-2031 (REVENUE, $MILLION)
    TABLE 16. DATA CENTER RACK MARKET FOR MANUFACTURING, BY REGION, 2021-2031 (REVENUE, $MILLION)
    TABLE 17. DATA CENTER RACK MARKET FOR IT AND TELECOM, BY REGION, 2021-2031 (REVENUE, $MILLION)
    TABLE 18. DATA CENTER RACK MARKET FOR RETAIL, BY REGION, 2021-2031 (REVENUE, $MILLION)
    TABLE 19. DATA CENTER RACK MARKET FOR HEALTHCARE, BY REGION, 2021-2031 (REVENUE, $MILLION)
    TABLE 20. DATA CENTER RACK MARKET FOR MEDIA AND ENTERTAINMENT, BY REGION, 2021-2031 (REVENUE, $MILLION)
    TABLE 21. DATA CENTER RACK MARKET FOR OTHERS, BY REGION, 2021-2031 (REVENUE, $MILLION)
    TABLE 22. DATA CENTER RACK MARKET, BY REGION, 2021-2031 (REVENUE, $MILLION)
    TABLE 23. NORTH AMERICA DATA CENTER RACK MARKET, BY COMPONENT, 2021-2031 (REVENUE, $MILLION)
    TABLE 24. NORTH AMERICA DATA CENTER RACK MARKET, BY RACK TYPE, 2021-2031 (REVENUE, $MILLION)
    TABLE 25. NORTH AMERICA DATA CENTER RACK MARKET, BY DATA CENTER SIZE, 2021-2031 (REVENUE, $MILLION)
    TABLE 26. NORTH AMERICA DATA CENTER RACK MARKET, BY RACK HEIGHT, 2021-2031 (REVENUE, $MILLION)
    TABLE 27. NORTH AMERICA DATA CENTER RACK MARKET, BY INDUSTRY VERTICAL, 2021-2031 (REVENUE, $MILLION)
    TABLE 28. NORTH AMERICA DATA CENTER RACK MARKET, BY COUNTRY, 2021-2031 (REVENUE, $MILLION)
    TABLE 29. U.S. DATA CENTER RACK MARKET, BY COMPONENT, 2021-2031 (REVENUE, $MILLION)
    TABLE 30. U.S. DATA CENTER RACK MARKET, BY RACK TYPE, 2021-2031 (REVENUE, $MILLION)
    TABLE 31. U.S. DATA CENTER RACK MARKET, BY DATA CENTER SIZE, 2021-2031 (REVENUE, $MILLION)
    TABLE 32. U.S. DATA CENTER RACK MARKET, BY RACK HEIGHT, 2021-2031 (REVENUE, $MILLION)
    TABLE 33. U.S. DATA CENTER RACK MARKET, BY INDUSTRY VERTICAL, 2021-2031 (REVENUE, $MILLION)
    TABLE 34. CANADA DATA CENTER RACK MARKET, BY COMPONENT, 2021-2031 (REVENUE, $MILLION)
    TABLE 35. CANADA DATA CENTER RACK MARKET, BY RACK TYPE, 2021-2031 (REVENUE, $MILLION)
    TABLE 36. CANADA DATA CENTER RACK MARKET, BY DATA CENTER SIZE, 2021-2031 (REVENUE, $MILLION)
    TABLE 37. CANADA DATA CENTER RACK MARKET, BY RACK HEIGHT, 2021-2031 (REVENUE, $MILLION)
    TABLE 38. CANADA DATA CENTER RACK MARKET, BY INDUSTRY VERTICAL, 2021-2031 (REVENUE, $MILLION)
    TABLE 39. EUROPE DATA CENTER RACK MARKET, BY COMPONENT, 2021-2031 (REVENUE, $MILLION)
    TABLE 40. EUROPE DATA CENTER RACK MARKET, BY RACK TYPE, 2021-2031 (REVENUE, $MILLION)
    TABLE 41. EUROPE DATA CENTER RACK MARKET, BY DATA CENTER SIZE, 2021-2031 (REVENUE, $MILLION)
    TABLE 42. EUROPE DATA CENTER RACK MARKET, BY RACK HEIGHT, 2021-2031 (REVENUE, $MILLION)
    TABLE 43. EUROPE DATA CENTER RACK MARKET, BY INDUSTRY VERTICAL, 2021-2031 (REVENUE, $MILLION)
    TABLE 44. EUROPE DATA CENTER RACK MARKET, BY COUNTRY, 2021-2031 (REVENUE, $MILLION)
    TABLE 45. UK DATA CENTER RACK MARKET, BY COMPONENT, 2021-2031 (REVENUE, $MILLION)
    TABLE 46. UK DATA CENTER RACK MARKET, BY RACK TYPE, 2021-2031 (REVENUE, $MILLION)
    TABLE 47. UK DATA CENTER RACK MARKET, BY DATA CENTER SIZE, 2021-2031 (REVENUE, $MILLION)
    TABLE 48. UK DATA CENTER RACK MARKET, BY RACK HEIGHT, 2021-2031 (REVENUE, $MILLION)
    TABLE 49. UK DATA CENTER RACK MARKET, BY INDUSTRY VERTICAL, 2021-2031 (REVENUE, $MILLION)
    TABLE 50. GERMANY DATA CENTER RACK MARKET, BY COMPONENT, 2021-2031 (REVENUE, $MILLION)
    TABLE 51. GERMANY DATA CENTER RACK MARKET, BY RACK TYPE, 2021-2031 (REVENUE, $MILLION)
    TABLE 52. GERMANY DATA CENTER RACK MARKET, BY DATA CENTER SIZE, 2021-2031 (REVENUE, $MILLION)
    TABLE 53. GERMANY DATA CENTER RACK MARKET, BY RACK HEIGHT, 2021-2031 (REVENUE, $MILLION)
    TABLE 54. GERMANY DATA CENTER RACK MARKET, BY INDUSTRY VERTICAL, 2021-2031 (REVENUE, $MILLION)
    TABLE 55. FRANCE DATA CENTER RACK MARKET, BY COMPONENT, 2021-2031 (REVENUE, $MILLION)
    TABLE 56. FRANCE DATA CENTER RACK MARKET, BY RACK TYPE, 2021-2031 (REVENUE, $MILLION)
    TABLE 57. FRANCE DATA CENTER RACK MARKET, BY DATA CENTER SIZE, 2021-2031 (REVENUE, $MILLION)
    TABLE 58. FRANCE DATA CENTER RACK MARKET, BY RACK HEIGHT, 2021-2031 (REVENUE, $MILLION)
    TABLE 59. FRANCE DATA CENTER RACK MARKET, BY INDUSTRY VERTICAL, 2021-2031 (REVENUE, $MILLION)
    TABLE 60. ITALY DATA CENTER RACK MARKET, BY COMPONENT, 2021-2031 (REVENUE, $MILLION)
    TABLE 61. ITALY DATA CENTER RACK MARKET, BY RACK TYPE, 2021-2031 (REVENUE, $MILLION)
    TABLE 62. ITALY DATA CENTER RACK MARKET, BY DATA CENTER SIZE, 2021-2031 (REVENUE, $MILLION)
    TABLE 63. ITALY DATA CENTER RACK MARKET, BY RACK HEIGHT, 2021-2031 (REVENUE, $MILLION)
    TABLE 64. ITALY DATA CENTER RACK MARKET, BY INDUSTRY VERTICAL, 2021-2031 (REVENUE, $MILLION)
    TABLE 65. SPAIN DATA CENTER RACK MARKET, BY COMPONENT, 2021-2031 (REVENUE, $MILLION)
    TABLE 66. SPAIN DATA CENTER RACK MARKET, BY RACK TYPE, 2021-2031 (REVENUE, $MILLION)
    TABLE 67. SPAIN DATA CENTER RACK MARKET, BY DATA CENTER SIZE, 2021-2031 (REVENUE, $MILLION)
    TABLE 68. SPAIN DATA CENTER RACK MARKET, BY RACK HEIGHT, 2021-2031 (REVENUE, $MILLION)
    TABLE 69. SPAIN DATA CENTER RACK MARKET, BY INDUSTRY VERTICAL, 2021-2031 (REVENUE, $MILLION)
    TABLE 70. REST OF EUROPE DATA CENTER RACK MARKET, BY COMPONENT, 2021-2031 (REVENUE, $MILLION)
    TABLE 71. REST OF EUROPE DATA CENTER RACK MARKET, BY RACK TYPE, 2021-2031 (REVENUE, $MILLION)
    TABLE 72. REST OF EUROPE DATA CENTER RACK MARKET, BY DATA CENTER SIZE, 2021-2031 (REVENUE, $MILLION)
    TABLE 73. REST OF EUROPE DATA CENTER RACK MARKET, BY RACK HEIGHT, 2021-2031 (REVENUE, $MILLION)
    TABLE 74. REST OF EUROPE DATA CENTER RACK MARKET, BY INDUSTRY VERTICAL, 2021-2031 (REVENUE, $MILLION)
    TABLE 75. ASIA-PACIFIC DATA CENTER RACK MARKET, BY COMPONENT, 2021-2031 (REVENUE, $MILLION)
    TABLE 76. ASIA-PACIFIC DATA CENTER RACK MARKET, BY RACK TYPE, 2021-2031 (REVENUE, $MILLION)
    TABLE 77. ASIA-PACIFIC DATA CENTER RACK MARKET, BY DATA CENTER SIZE, 2021-2031 (REVENUE, $MILLION)
    TABLE 78. ASIA-PACIFIC DATA CENTER RACK MARKET, BY RACK HEIGHT, 2021-2031 (REVENUE, $MILLION)
    TABLE 79. ASIA-PACIFIC DATA CENTER RACK MARKET, BY INDUSTRY VERTICAL, 2021-2031 (REVENUE, $MILLION)
    TABLE 80. ASIA-PACIFIC DATA CENTER RACK MARKET, BY COUNTRY, 2021-2031 (REVENUE, $MILLION)
    TABLE 81. CHINA DATA CENTER RACK MARKET, BY COMPONENT, 2021-2031 (REVENUE, $MILLION)
    TABLE 82. CHINA DATA CENTER RACK MARKET, BY RACK TYPE, 2021-2031 (REVENUE, $MILLION)
    TABLE 83. CHINA DATA CENTER RACK MARKET, BY DATA CENTER SIZE, 2021-2031 (REVENUE, $MILLION)
    TABLE 84. CHINA DATA CENTER RACK MARKET, BY RACK HEIGHT, 2021-2031 (REVENUE, $MILLION)
    TABLE 85. CHINA DATA CENTER RACK MARKET, BY INDUSTRY VERTICAL, 2021-2031 (REVENUE, $MILLION)
    TABLE 86. JAPAN DATA CENTER RACK MARKET, BY COMPONENT, 2021-2031 (REVENUE, $MILLION)
    TABLE 87. JAPAN DATA CENTER RACK MARKET, BY RACK TYPE, 2021-2031 (REVENUE, $MILLION)
    TABLE 88. JAPAN DATA CENTER RACK MARKET, BY DATA CENTER SIZE, 2021-2031 (REVENUE, $MILLION)
    TABLE 89. JAPAN DATA CENTER RACK MARKET, BY RACK HEIGHT, 2021-2031 (REVENUE, $MILLION)
    TABLE 90. JAPAN DATA CENTER RACK MARKET, BY INDUSTRY VERTICAL, 2021-2031 (REVENUE, $MILLION)
    TABLE 91. INDIA DATA CENTER RACK MARKET, BY COMPONENT, 2021-2031 (REVENUE, $MILLION)
    TABLE 92. INDIA DATA CENTER RACK MARKET, BY RACK TYPE, 2021-2031 (REVENUE, $MILLION)
    TABLE 93. INDIA DATA CENTER RACK MARKET, BY DATA CENTER SIZE, 2021-2031 (REVENUE, $MILLION)
    TABLE 94. INDIA DATA CENTER RACK MARKET, BY RACK HEIGHT, 2021-2031 (REVENUE, $MILLION)
    TABLE 95. INDIA DATA CENTER RACK MARKET, BY INDUSTRY VERTICAL, 2021-2031 (REVENUE, $MILLION)
    TABLE 96. AUSTRALIA DATA CENTER RACK MARKET, BY COMPONENT, 2021-2031 (REVENUE, $MILLION)
    TABLE 97. AUSTRALIA DATA CENTER RACK MARKET, BY RACK TYPE, 2021-2031 (REVENUE, $MILLION)
    TABLE 98. AUSTRALIA DATA CENTER RACK MARKET, BY DATA CENTER SIZE, 2021-2031 (REVENUE, $MILLION)
    TABLE 99. AUSTRALIA DATA CENTER RACK MARKET, BY RACK HEIGHT, 2021-2031 (REVENUE, $MILLION)
    TABLE 100. AUSTRALIA DATA CENTER RACK MARKET, BY INDUSTRY VERTICAL, 2021-2031 (REVENUE, $MILLION)
    TABLE 101. SOUTH KOREA DATA CENTER RACK MARKET, BY COMPONENT, 2021-2031 (REVENUE, $MILLION)
    TABLE 102. SOUTH KOREA DATA CENTER RACK MARKET, BY RACK TYPE, 2021-2031 (REVENUE, $MILLION)
    TABLE 103. SOUTH KOREA DATA CENTER RACK MARKET, BY DATA CENTER SIZE, 2021-2031 (REVENUE, $MILLION)
    TABLE 104. SOUTH KOREA DATA CENTER RACK MARKET, BY RACK HEIGHT, 2021-2031 (REVENUE, $MILLION)
    TABLE 105. SOUTH KOREA DATA CENTER RACK MARKET, BY INDUSTRY VERTICAL, 2021-2031 (REVENUE, $MILLION)
    TABLE 106. REST OF ASIA-PACIFIC DATA CENTER RACK MARKET, BY COMPONENT, 2021-2031 (REVENUE, $MILLION)
    TABLE 107. REST OF ASIA-PACIFIC DATA CENTER RACK MARKET, BY RACK TYPE, 2021-2031 (REVENUE, $MILLION)
    TABLE 108. REST OF ASIA-PACIFIC DATA CENTER RACK MARKET, BY DATA CENTER SIZE, 2021-2031 (REVENUE, $MILLION)
    TABLE 109. REST OF ASIA-PACIFIC DATA CENTER RACK MARKET, BY RACK HEIGHT, 2021-2031 (REVENUE, $MILLION)
    TABLE 110. REST OF ASIA-PACIFIC DATA CENTER RACK MARKET, BY INDUSTRY VERTICAL, 2021-2031 (REVENUE, $MILLION)
    TABLE 111. LAMEA DATA CENTER RACK MARKET, BY COMPONENT, 2021-2031 (REVENUE, $MILLION)
    TABLE 112. LAMEA DATA CENTER RACK MARKET, BY RACK TYPE, 2021-2031 (REVENUE, $MILLION)
    TABLE 113. LAMEA DATA CENTER RACK MARKET, BY DATA CENTER SIZE, 2021-2031 (REVENUE, $MILLION)
    TABLE 114. LAMEA DATA CENTER RACK MARKET, BY RACK HEIGHT, 2021-2031 (REVENUE, $MILLION)
    TABLE 115. LAMEA DATA CENTER RACK MARKET, BY INDUSTRY VERTICAL, 2021-2031 (REVENUE, $MILLION)
    TABLE 116. LAMEA DATA CENTER RACK MARKET, BY COUNTRY, 2021-2031 (REVENUE, $MILLION)
    TABLE 117. LATIN AMERICA DATA CENTER RACK MARKET, BY COMPONENT, 2021-2031 (REVENUE, $MILLION)
    TABLE 118. LATIN AMERICA DATA CENTER RACK MARKET, BY RACK TYPE, 2021-2031 (REVENUE, $MILLION)
    TABLE 119. LATIN AMERICA DATA CENTER RACK MARKET, BY DATA CENTER SIZE, 2021-2031 (REVENUE, $MILLION)
    TABLE 120. LATIN AMERICA DATA CENTER RACK MARKET, BY RACK HEIGHT, 2021-2031 (REVENUE, $MILLION)
    TABLE 121. LATIN AMERICA DATA CENTER RACK MARKET, BY INDUSTRY VERTICAL, 2021-2031 (REVENUE, $MILLION)
    TABLE 122. MIDDLE EAST DATA CENTER RACK MARKET, BY COMPONENT, 2021-2031 (REVENUE, $MILLION)
    TABLE 123. MIDDLE EAST DATA CENTER RACK MARKET, BY RACK TYPE, 2021-2031 (REVENUE, $MILLION)
    TABLE 124. MIDDLE EAST DATA CENTER RACK MARKET, BY DATA CENTER SIZE, 2021-2031 (REVENUE, $MILLION)
    TABLE 125. MIDDLE EAST DATA CENTER RACK MARKET, BY RACK HEIGHT, 2021-2031 (REVENUE, $MILLION)
    TABLE 126. MIDDLE EAST DATA CENTER RACK MARKET, BY INDUSTRY VERTICAL, 2021-2031 (REVENUE, $MILLION)
    TABLE 127. AFRICA DATA CENTER RACK MARKET, BY COMPONENT, 2021-2031 (REVENUE, $MILLION)
    TABLE 128. AFRICA DATA CENTER RACK MARKET, BY RACK TYPE, 2021-2031 (REVENUE, $MILLION)
    TABLE 129. AFRICA DATA CENTER RACK MARKET, BY DATA CENTER SIZE, 2021-2031 (REVENUE, $MILLION)
    TABLE 130. AFRICA DATA CENTER RACK MARKET, BY RACK HEIGHT, 2021-2031 (REVENUE, $MILLION)
    TABLE 131. AFRICA DATA CENTER RACK MARKET, BY INDUSTRY VERTICAL, 2021-2031 (REVENUE, $MILLION)
    TABLE 132. BLACK BOX: KEY EXECUTIVES
    TABLE 133. BLACK BOX: COMPANY SNAPSHOT
    TABLE 134. BLACK BOX: SERVICE SEGMENTS
    TABLE 135. BLACK BOX: PRODUCT PORTFOLIO
    TABLE 136. EATON CORPORATION: KEY EXECUTIVES
    TABLE 137. EATON CORPORATION: COMPANY SNAPSHOT
    TABLE 138. EATON CORPORATION: PRODUCT SEGMENTS
    TABLE 139. EATON CORPORATION: PRODUCT PORTFOLIO
    TABLE 140. EATON CORPORATION: KEY STRATERGIES
    TABLE 141. GREAT LAKES DATA RACKS & CABINETS: KEY EXECUTIVES
    TABLE 142. GREAT LAKES DATA RACKS & CABINETS: COMPANY SNAPSHOT
    TABLE 143. GREAT LAKES DATA RACKS & CABINETS: SERVICE SEGMENTS
    TABLE 144. GREAT LAKES DATA RACKS & CABINETS: PRODUCT PORTFOLIO
    TABLE 145. ORACLE CORPORATION: KEY EXECUTIVES
    TABLE 146. ORACLE CORPORATION: COMPANY SNAPSHOT
    TABLE 147. ORACLE CORPORATION: SERVICE SEGMENTS
    TABLE 148. ORACLE CORPORATION: PRODUCT PORTFOLIO
    TABLE 149. ORACLE CORPORATION: KEY STRATERGIES
    TABLE 150. RITTAL GMBH & CO. KG: KEY EXECUTIVES
    TABLE 151. RITTAL GMBH & CO. KG: COMPANY SNAPSHOT
    TABLE 152. RITTAL GMBH & CO. KG: SERVICE SEGMENTS
    TABLE 153. RITTAL GMBH & CO. KG: PRODUCT PORTFOLIO
    TABLE 154. RITTAL GMBH & CO. KG: KEY STRATERGIES
    TABLE 155. SAMSUNG ELECTRONICS CO., LTD: KEY EXECUTIVES
    TABLE 156. SAMSUNG ELECTRONICS CO., LTD: COMPANY SNAPSHOT
    TABLE 157. SAMSUNG ELECTRONICS CO., LTD: PRODUCT SEGMENTS
    TABLE 158. SAMSUNG ELECTRONICS CO., LTD: PRODUCT PORTFOLIO
    TABLE 159. SCHNEIDER ELECTRIC: KEY EXECUTIVES
    TABLE 160. SCHNEIDER ELECTRIC: COMPANY SNAPSHOT
    TABLE 161. SCHNEIDER ELECTRIC: PRODUCT SEGMENTS
    TABLE 162. SCHNEIDER ELECTRIC: PRODUCT PORTFOLIO
    TABLE 163. SCHNEIDER ELECTRIC: KEY STRATERGIES
    TABLE 164. HEWLETT PACKARD ENTERPRISE DEVELOPMENT LP: KEY EXECUTIVES
    TABLE 165. HEWLETT PACKARD ENTERPRISE DEVELOPMENT LP: COMPANY SNAPSHOT
    TABLE 166. HEWLETT PACKARD ENTERPRISE DEVELOPMENT LP: SERVICE SEGMENTS
    TABLE 167. HEWLETT PACKARD ENTERPRISE DEVELOPMENT LP: PRODUCT PORTFOLIO
    TABLE 168. FUJITSU: KEY EXECUTIVES
    TABLE 169. FUJITSU: COMPANY SNAPSHOT
    TABLE 170. FUJITSU: SERVICE SEGMENTS
    TABLE 171. FUJITSU: PRODUCT PORTFOLIO
    TABLE 172. FUJITSU: KEY STRATERGIES
    TABLE 173. DELL TECHNOLOGIES INC.: KEY EXECUTIVES
    TABLE 174. DELL TECHNOLOGIES INC.: COMPANY SNAPSHOT
    TABLE 175. DELL TECHNOLOGIES INC.: PRODUCT SEGMENTS
    TABLE 176. DELL TECHNOLOGIES INC.: PRODUCT PORTFOLIO
  • LIST OF FIGURES

  • FIGURE 01. DATA CENTER RACK MARKET, 2021-2031
    FIGURE 02. SEGMENTATION OF DATA CENTER RACK MARKET, 2021-2031
    FIGURE 03. TOP INVESTMENT POCKETS IN DATA CENTER RACK MARKET (2022-2031)
    FIGURE 04. MODERATE BARGAINING POWER OF SUPPLIERS
    FIGURE 05. HIGH BARGAINING POWER OF BUYERS
    FIGURE 06. LOW THREAT OF SUBSTITUTES
    FIGURE 07. HIGH THREAT OF NEW ENTRANTS
    FIGURE 08. MODERATE INTENSITY OF RIVALRY
    FIGURE 09. DRIVERS, RESTRAINTS AND OPPORTUNITIES: GLOBALDATA CENTER RACK MARKET
    FIGURE 10. DATA CENTER RACK MARKET, BY COMPONENT, 2021(%)
    FIGURE 11. COMPARATIVE SHARE ANALYSIS OF DATA CENTER RACK MARKET FOR SOLUTION, BY COUNTRY 2021-2031(%)
    FIGURE 12. COMPARATIVE SHARE ANALYSIS OF DATA CENTER RACK MARKET FOR SERVICE, BY COUNTRY 2021-2031(%)
    FIGURE 13. DATA CENTER RACK MARKET, BY RACK TYPE, 2021(%)
    FIGURE 14. COMPARATIVE SHARE ANALYSIS OF DATA CENTER RACK MARKET FOR CABINETS/ ENCLOSED RACKS, BY COUNTRY 2021-2031(%)
    FIGURE 15. COMPARATIVE SHARE ANALYSIS OF DATA CENTER RACK MARKET FOR OPEN FRAME RACK, BY COUNTRY 2021-2031(%)
    FIGURE 16. DATA CENTER RACK MARKET, BY DATA CENTER SIZE, 2021(%)
    FIGURE 17. COMPARATIVE SHARE ANALYSIS OF DATA CENTER RACK MARKET FOR LARGE DATA CENTERS, BY COUNTRY 2021-2031(%)
    FIGURE 18. COMPARATIVE SHARE ANALYSIS OF DATA CENTER RACK MARKET FOR SMALL AND MID-SIZED DATA CENTERS, BY COUNTRY 2021-2031(%)
    FIGURE 19. DATA CENTER RACK MARKET, BY RACK HEIGHT, 2021(%)
    FIGURE 20. COMPARATIVE SHARE ANALYSIS OF DATA CENTER RACK MARKET FOR 42U AND BELOW, BY COUNTRY 2021-2031(%)
    FIGURE 21. COMPARATIVE SHARE ANALYSIS OF DATA CENTER RACK MARKET FOR 43U UP TO 52U, BY COUNTRY 2021-2031(%)
    FIGURE 22. COMPARATIVE SHARE ANALYSIS OF DATA CENTER RACK MARKET FOR ABOVE 52U, BY COUNTRY 2021-2031(%)
    FIGURE 23. DATA CENTER RACK MARKET, BY INDUSTRY VERTICAL, 2021(%)
    FIGURE 24. COMPARATIVE SHARE ANALYSIS OF DATA CENTER RACK MARKET FOR BFSI, BY COUNTRY 2021-2031(%)
    FIGURE 25. COMPARATIVE SHARE ANALYSIS OF DATA CENTER RACK MARKET FOR MANUFACTURING, BY COUNTRY 2021-2031(%)
    FIGURE 26. COMPARATIVE SHARE ANALYSIS OF DATA CENTER RACK MARKET FOR IT AND TELECOM, BY COUNTRY 2021-2031(%)
    FIGURE 27. COMPARATIVE SHARE ANALYSIS OF DATA CENTER RACK MARKET FOR RETAIL, BY COUNTRY 2021-2031(%)
    FIGURE 28. COMPARATIVE SHARE ANALYSIS OF DATA CENTER RACK MARKET FOR HEALTHCARE, BY COUNTRY 2021-2031(%)
    FIGURE 29. COMPARATIVE SHARE ANALYSIS OF DATA CENTER RACK MARKET FOR MEDIA AND ENTERTAINMENT, BY COUNTRY 2021-2031(%)
    FIGURE 30. COMPARATIVE SHARE ANALYSIS OF DATA CENTER RACK MARKET FOR OTHERS, BY COUNTRY 2021-2031(%)
    FIGURE 31. DATA CENTER RACK MARKET BY REGION, 2021
    FIGURE 32. U.S. DATA CENTER RACK MARKET, 2021-2031 ($MILLION)
    FIGURE 33. CANADA DATA CENTER RACK MARKET, 2021-2031 ($MILLION)
    FIGURE 34. UK DATA CENTER RACK MARKET, 2021-2031 ($MILLION)
    FIGURE 35. GERMANY DATA CENTER RACK MARKET, 2021-2031 ($MILLION)
    FIGURE 36. FRANCE DATA CENTER RACK MARKET, 2021-2031 ($MILLION)
    FIGURE 37. ITALY DATA CENTER RACK MARKET, 2021-2031 ($MILLION)
    FIGURE 38. SPAIN DATA CENTER RACK MARKET, 2021-2031 ($MILLION)
    FIGURE 39. REST OF EUROPE DATA CENTER RACK MARKET, 2021-2031 ($MILLION)
    FIGURE 40. CHINA DATA CENTER RACK MARKET, 2021-2031 ($MILLION)
    FIGURE 41. JAPAN DATA CENTER RACK MARKET, 2021-2031 ($MILLION)
    FIGURE 42. INDIA DATA CENTER RACK MARKET, 2021-2031 ($MILLION)
    FIGURE 43. AUSTRALIA DATA CENTER RACK MARKET, 2021-2031 ($MILLION)
    FIGURE 44. SOUTH KOREA DATA CENTER RACK MARKET, 2021-2031 ($MILLION)
    FIGURE 45. REST OF ASIA-PACIFIC DATA CENTER RACK MARKET, 2021-2031 ($MILLION)
    FIGURE 46. LATIN AMERICA DATA CENTER RACK MARKET, 2021-2031 ($MILLION)
    FIGURE 47. MIDDLE EAST DATA CENTER RACK MARKET, 2021-2031 ($MILLION)
    FIGURE 48. AFRICA DATA CENTER RACK MARKET, 2021-2031 ($MILLION)
    FIGURE 49. TOP WINNING STRATEGIES, BY YEAR
    FIGURE 50. TOP WINNING STRATEGIES, BY DEVELOPMENT
    FIGURE 51. TOP WINNING STRATEGIES, BY COMPANY
    FIGURE 52. PRODUCT MAPPING OF TOP 10 PLAYERS
    FIGURE 53. COMPETITIVE DASHBOARD
    FIGURE 54. COMPETITIVE HEATMAP: DATA CENTER RACK MARKET
    FIGURE 55. TOP PLAYER POSITIONING, 2021
    FIGURE 56. BLACK BOX: NET REVENUE, 2019-2021 ($MILLION)
    FIGURE 57. BLACK BOX: REVENUE SHARE BY SEGMENT, 2021 (%)
    FIGURE 58. BLACK BOX: REVENUE SHARE BY REGION, 2021 (%)
    FIGURE 59. EATON CORPORATION: NET SALES, 2019-2021 ($MILLION)
    FIGURE 60. EATON CORPORATION: RESEARCH & DEVELOPMENT EXPENDITURE, 2019-2021
    FIGURE 61. EATON CORPORATION: REVENUE SHARE BY REGION, 2021 (%)
    FIGURE 62. EATON CORPORATION: REVENUE SHARE BY SEGMENT, 2021 (%)
    FIGURE 63. ORACLE CORPORATION: NET REVENUE, 2019-2021 ($MILLION)
    FIGURE 64. ORACLE CORPORATION: RESEARCH & DEVELOPMENT EXPENDITURE, 2019-2021
    FIGURE 65. ORACLE CORPORATION: REVENUE SHARE BY SEGMENT, 2021 (%)
    FIGURE 66. ORACLE CORPORATION: REVENUE SHARE BY REGION, 2021 (%)
    FIGURE 67. SAMSUNG ELECTRONICS CO., LTD: NET REVENUE, 2019-2021 ($MILLION)
    FIGURE 68. SAMSUNG ELECTRONICS CO., LTD: REVENUE SHARE BY SEGMENT, 2021 (%)
    FIGURE 69. SAMSUNG ELECTRONICS CO., LTD: REVENUE SHARE BY REGION, 2021 (%)
    FIGURE 70. SCHNEIDER ELECTRIC: NET REVENUE, 2019-2021 ($MILLION)
    FIGURE 71. SCHNEIDER ELECTRIC: REVENUE SHARE BY SEGMENT, 2021 (%)
    FIGURE 72. SCHNEIDER ELECTRIC: REVENUE SHARE BY REGION, 2021 (%)
    FIGURE 73. HEWLETT PACKARD ENTERPRISE DEVELOPMENT LP: NET REVENUE, 2019-2021 ($MILLION)
    FIGURE 74. HEWLETT PACKARD ENTERPRISE DEVELOPMENT LP: REVENUE SHARE BY SEGMENT, 2021 (%)
    FIGURE 75. HEWLETT PACKARD ENTERPRISE DEVELOPMENT LP: REVENUE SHARE BY REGION, 2021 (%)
    FIGURE 76. FUJITSU: NET REVENUE, 2019-2021 ($MILLION)
    FIGURE 77. FUJITSU: REVENUE SHARE BY SEGMENT, 2021 (%)
    FIGURE 78. FUJITSU: REVENUE SHARE BY REGION, 2021 (%)
    FIGURE 79. DELL TECHNOLOGIES INC.: NET REVENUE, 2020-2022 ($MILLION)
    FIGURE 80. DELL TECHNOLOGIES INC.: RESEARCH & DEVELOPMENT EXPENDITURE, 2020-2022
    FIGURE 81. DELL TECHNOLOGIES INC.: REVENUE SHARE BY SEGMENT, 2022 (%)
    FIGURE 82. DELL TECHNOLOGIES INC.: REVENUE SHARE BY REGION, 2022 (%)


The adoption of data center rack has increased over the period to provide reliable and consistent experiences for their subscribers. In addition, the ability of data center rack to provide various opportunities for businesses to gain new insights to run the business efficiently is increasing its popularity among end users. Furthermore, many healthcare, retail & e-commerce, BFSI, IT & telecom, and others industries are investing in data center rack to increase security and reduce data center expense in organizations, which in turn fuels the growth of the market.

Furthermore, the market is expected to witness significant growth in the future, due to increase in use of low latency networks such as long-term evolution, LTE micro stations, and 5G networks in domestic user and rise in adoption of artificial intelligence-oriented business models among organizations. For instance, organizations such as Dell Technologies Inc., and HP are massively using data center rack to enhance customer experience. Moreover, rise in investments in artificial intelligence tools among every industry vertical further boosts the revenue growth.

Global data center rack market has been witnessing a steady growth worldwide due to the ever increasing volumes of data generated by different industry verticals. Increased usage of internet-based services along with cloud computing services among organizations have significantly fueled the demand for data centers rack across the world. The presence of a large number of providers in the global data center rack market increases the competitive rivalry among the key players. Therefore, data center rack providers are differentiating themselves from competitors and driving revenue growth by incorporating new digital business technologies such as artificial intelligence, machine learning, 5G networks their offerings to gain a competitive edge, and retain their market position.

The market is considerably concentrated with major players consuming significant market share. The degree of concentration will remain the same during the forecast period. The vendors operating in the market are taking several initiatives such as new product launches and partnership to stay competitive in the market and to strengthen their foothold in the market. In addition, companies are heavily investing in R&D activities to develop advanced data center solution & services, which is opportunistic for the market.

PURCHASE OPTIONS

Call or Email us

U.S.-Canada Toll-free: +1-800-792-5285
Int'l : +1-503-894-6022
Europe : +44-845-528-1300
Email : help@alliedmarketresearch.com
 
FREQUENTLY ASKED QUESTIONS?

A. Global Data Center Rack Market is Expected to Reach $9,498.15 Million by 2031.

A. Factor such as, increase in adoption of data center rack technology across enterprises to enhance operation & productivity, propel the growth of the market for future.

A. The North America is the largest market for the Data Center Rack.

A. The key growth strategies for Data Center Rack include product portfolio expansion, acquisition, partnership, merger, and collaboration.

A. Black Box, Eaton Corporation, Great Lakes Data Racks & Cabinets, Oracle Corporation, Schneider Electric, Hewlett Packard Enterprise Development LP, Fujitsu, Dell Technologies Inc., Rittal GmbH & Co. KG, Samsung Electronics Co., Ltd., are some top companies.

Looking for Customization?

 Customization Request

Have a Question?

 Speak with Analyst

Any Confusion?

 Inquire Before Buying

Have a glance of the Report

  Request Sample
RELATED TAGS

Purchase Full Report of
Data Center Rack Market

Start reading instantly.
This Report and over 68,247+ more Reports, Available with Avenue Library. T&C*.

  • Online Only
  • $3,570
  • Online cloud access only
  • Restricted print, copy, paste & download
  • Read only
  • Free industry update
    (Within 180 days)
  • Free report update in next update cycle
    (Jan 2024 - Jan 2025)
  • Data Pack
  • $3,840
  • Restricted to one authorized user
  • One print only
  • Available in
    Excel
  • Free industry update
    (Within 180 days)
  •   Free report update in next update cycle
    (Jan 2024 - Jan 2025)
  • Single User
  • $5,730
  • Restricted to one authorized user
  • One print only
  • Available in
    PDF
  • Free industry update
    (Within 180 days)
  •   Free report update in next update cycle
    (Jan 2024 - Jan 2025)
  • Five Users
  • $6,450
  • Limited to five authorized users
  • Print upto five copies
  • Available in
    PDF
  • Free industry update
    (Within 180 days)
  •   Free report update in next update cycle
    (Jan 2024 - Jan 2025)
  • Enterprise
    License/PDF

  • $9,600
  • Unlimited
    within
    company/enterprise
  • Available in Excel & PDF
  • Free industry update
    (Within 180 days)
  •   Free report update in next update cycle
    (Jan 2024 - Jan 2025)
  • Library
    Membership

  • $999 $ 1,175
    Per User/ Per month/ Billed annually
  • Published Content
    E-access
  • Company Profiles
    E-access
  • Newly Added Content Access
  • 10 PDF
    Downloads
  • 5 Excel Data
    Pack Downloads
  • 250 Company Profiles PDF Downloads
  • Buy Now

*Taxes/Fees, if applicable will be added during checkout. All prices in USD

RELATED REPORTS
 

Why Allied Market Research?


Infallible Methodology

To ensure high-level data integrity, accurate analysis, and impeccable forecasts

Analyst Support

For complete satisfaction

Customization

On-demand customization of scope of the report to exactly meet your needs

TARGETED MARKET VIEW

Targeted market view to provide pertinent information and save time of readers

Get fresh content delivered

Get insights on topics that are crucial for your business. Stay abreast of your interest areas.

Get Industry Data Alerts

Why Allied Market Research?

Infallible Methodology

To ensure high-level data integrity, accurate analysis, and impeccable forecasts

Analyst Support

For complete satisfaction

Customization

On-demand customization of scope of the report to exactly meet your needs

TARGETED MARKET VIEW

Targeted market view to provide pertinent information and save time of readers