0
2022
Data Protection As A Service (dpaas) Market

Data Protection as a Service (DPaaS) Market

by Service Type (Disaster Recovery as a Service, Backup as a Service, Storage as a Service), by Deployment Mode (Public Cloud, Private Cloud, Hybrid Cloud), by Enterprise Size (Large Enterprise, SMEs): Global Opportunity Analysis and Industry Forecast, 2020-2030

✷  Report Code: A01552
Mar 2022 | Pages: 276
Tables: 166
Charts: 63
  • Formats*:

  • pdf

    Single User License, Five User
    License & Enterprise User License

  • xls

    Data Pack Excel License

  • ppt

    It comes with the additional cost
    of $2500.00 contact sales.


Data Protection As A Service (DPaaS) Market Research, 2030

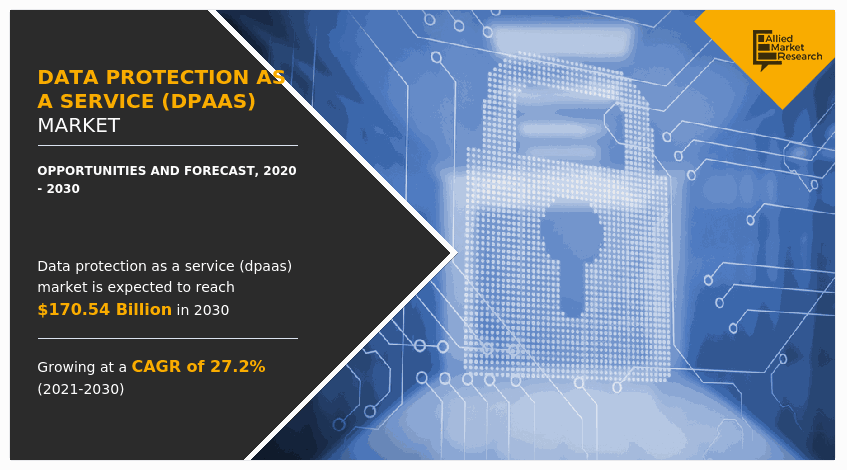
The global data protection as a service market size was valued at $15.49 billion in 2020, and is projected to reach $170.54 billion by 2030, growing at a CAGR of 27.2% from 2021 to 2030.

During the COVID-19 pandemic, DPaaS played a vital role in protection of data as the volume of data has increased significantly due to WFH policies and rise in adoption of new technologies such as machine learning and IoT across the globe.

The advent of cloud computing and software-defined data centers with virtualized infrastructure components delivered as a service has fostered the need for data protection in the present business scenario. Increase in need for data protection among cloud service providers has led to the introduction of data-protection-as-a-service (DPaaS). DPaaS is a cloud-based, web-delivered service designed to safeguard data assets of businesses. The deployment of DPaaS market has increased in organizations across the globe, owing to the advantages of better network security and advanced data security.

The global DPaaS market is influenced by several factors such as increase in concerns about data loss; rise in need for data backups & archives; and governance, risk, and compliance requirements for storage. However, high incurrence of costs is projected to hamper growth of the market. On the contrary, increase in demand for cloud-based disaster recovery and backup for virtual machines are expected to be opportunistic for the data protection as a service market growth.

The global Data Protection as a Service Industry is segmented into on deployment model, service type, end user, and region. Depending on the deployment model, the market is categorized into public, private, and hybrid cloud. On the basis of type of service, the market is categorized into disaster recovery-as-a-service (DRaaS), backup-as-a-service (BaaS), and storage-as-a-service (STaaS). The end users of the market are large enterprises and small & medium enterprises. The Data Protection as a Service Industry is analyzed based on four regions, namely North America, Europe, Asia-Pacific, and LAMEA along with the country-level analysis of each region.

In 2020, On the basis of service, the STaaS segment dominated the data protection as a service market share in 2020, and is expected to maintain its dominance in the upcoming years. This is attributed to cost-effectiveness of STaaS and no initial costs required for deploying hard drives, servers, and IT technicians. The provision of long-term data storage and business stability is a major growth factor of the overall market.

Use this identifier:

Data Protection as a Service (DPaaS) Market

By deployment, the private segment dominated the market in 2020, and is expected to maintain its dominance in the upcoming years. This is attributed to the fact that private cloud provides improved security, greater server control, and enhanced flexibility. Furthermore, private cloud is deployed and customized according to the preferences of users. However, the hybrid segment is expected to register highest growth rate during forecast period.

Use this identifier:

Data Protection as a Service (DPaaS) Market

North America dominates the market. The expansion of cyber security and cloud service business in North America has driven the market for DPaaS in the region. Moreover, increase in implementation of legislative compliances to improve cloud security and reduce cyber-attacks has boosted the market growth. The presence of numerous vendors that offer a variety of customized solutions is opportunistic for the market. In addition, factors such as data disclosure mandates, need for strict compliance toward sensitive data protection, increase in spending pattern on security forums, and surge in internet penetration have fueled the demand for DPaaS in the region. However, Asia-Pacific is expected to witness highest growth rate during the forecast period. The market growth in Asia-Pacific is majorly supported by increased reliability on ICT infrastructure coupled with increase in opportunities for cloud exporters. Furthermore, rise in number of strategic partnerships among regional and U.S. providers has fueled the market growth. In Asian countries, the growing trend of cloud computing and BYOD has driven the market growth in the recent years.

Use this identifier:

Data Protection as a Service (DPaaS) Market

COVID-19 Impact Analysis

The current estimation of 2030 is projected to be higher than pre-COVID-19 estimates. The outbreak of COVID-19 has caused a great deal of difficulties across the world. During the COVID-19 pandemic, DPaaS played a vital role in protection of data as the volume of data has increased significantly due to WFH policies and rise in adoption of new technologies such as machine learning and IoT across the globe.

Although the COVID-19 does not have major negative impact on the growth of the market, the outbreak of COVID-19 will surely provide numerous opportunities for the market to grow during the forecast period. These opportunities include surge in demand for DPaaS in enterprises due to remote work initiatives, increase in data protection applications, and introduction of innovative DPaaS solutions.

Top Impacting Factors

Increased concerns about data loss

Data loss is a growing concern for large enterprises as well as small & medium enterprises. Further, data that are difficult to protect such as big data and data accessed by ubiquitous mobile devices are stored in hybrid clouds. Many vendors have developed advanced data protection tools to reduce the costs and consequences of data loss.                                                                                                

 Increase in need for data backups and archives

Archives provide a snapshot of the desired file from a specific location. Moreover, data backups provide a fail-safe mechanism for all retrieval of data in a system. The old data is overwritten by new data on a regular basis. DPaaS has the ability to scale data assets integrity and retention of data over long period using data backups and archives. This is essential for organizations in the present business scenario that are vulnerable to data theft and other threats to adopt this measure.

Governance, risk, and compliance requirements for storage

As businesses collect and generate massive volume of data assets, the need for aligning strict internal governance policies has increased in the recent years. Furthermore, adherence to regulatory norms regarding data storage, management, and encryption is crucial for market players. This has majorly driven the market for DPaaS among business professionals.

Key Benefits For Stakeholders

  • This report provides a quantitative analysis of the market segments, current trends, estimations, and dynamics of the data protection as a service (dpaas) market analysis from 2020 to 2030 to identify the prevailing data protection as a service (dpaas) market opportunities.
  • The market research is offered along with information related to key drivers, restraints, and opportunities.
  • Porter's five forces analysis highlights the potency of buyers and suppliers to enable stakeholders make profit-oriented business decisions and strengthen their supplier-buyer network.
  • In-depth analysis of the data protection as a service (dpaas) market segmentation assists to determine the prevailing market opportunities.
  • Major countries in each region are mapped according to their revenue contribution to the global market.
  • Market player positioning facilitates benchmarking and provides a clear understanding of the present position of the market players.
  • The report includes the analysis of the regional as well as global data protection as a service market size, data protection as a service market trends, key players, market segments, application areas, and market growth strategies.

Data Protection as a Service (DPaaS) Market Report Highlights

Aspects Details
By Service Type
  • Disaster Recovery as a Service
  • Backup as a Service
  • Storage as a Service
By Enterprise Size
  • Large Enterprise
  • SMEs
By Deployment Mode
  • Public Cloud
  • Private Cloud
  • Hybrid Cloud
By Region
  • North America  (U.S., Canada)
  • Europe  (United Kingdom, Germany, France, Italy, Spain, Netherlands, Rest of Europe)
  • Asia-Pacific  (Japan, China, South Korea, Australia, India, Rest of Asia-Pacific)
  • LAMEA  (Brazil, Argentina, Rest of LAMEA)
Key Market Players QUANTUM CORPORATION, L.P., EMC CORPORATION, VERITAS TECHNOLOGIES, ASIGRA, IBM CORPORATION, AMAZON WEB SERVICES, CISCO SYSTEMS, HEWLETT-PACKARD DEVELOPMENT COMPANY, COMMVAULT SYSTEMS, VMWARE
 
  • CHAPTER 1:INTRODUCTION

    • 1.1.Report description

    • 1.2.Key market segments

    • 1.3.Key benefits to the stakeholders

    • 1.4.Research Methodology

      • 1.4.1.Secondary research

      • 1.4.2.Primary research

      • 1.4.3.Analyst tools and models

  • CHAPTER 2:EXECUTIVE SUMMARY

    • 2.1.Key findings of the study

    • 2.2.CXO Perspective

  • CHAPTER 3:MARKET OVERVIEW

    • 3.1.Market definition and scope

    • 3.2.Key findings

      • 3.2.1.Top investment pockets

    • 3.3.Porter’s five forces analysis

    • 3.4.Top player positioning

    • 3.5.Market dynamics

      • 3.5.1.Drivers

      • 3.5.2.Restraints

      • 3.5.3.Opportunities

    • 3.6.COVID-19 Impact Analysis on the market

    • 3.7.Key Regulation Analysis

    • 3.8.Regulatory Guidelines

  • CHAPTER 4: DATA PROTECTION AS A SERVICE (DPAAS) MARKET, BY SERVICE TYPE

    • 4.1 Overview

      • 4.1.1 Market size and forecast

    • 4.2 Disaster Recovery as a Service

      • 4.2.1 Key market trends, growth factors and opportunities

      • 4.2.2 Market size and forecast, by region

      • 4.2.3 Market analysis by country

    • 4.3 Backup as a Service

      • 4.3.1 Key market trends, growth factors and opportunities

      • 4.3.2 Market size and forecast, by region

      • 4.3.3 Market analysis by country

    • 4.4 Storage as a Service

      • 4.4.1 Key market trends, growth factors and opportunities

      • 4.4.2 Market size and forecast, by region

      • 4.4.3 Market analysis by country

  • CHAPTER 5: DATA PROTECTION AS A SERVICE (DPAAS) MARKET, BY DEPLOYMENT MODE

    • 5.1 Overview

      • 5.1.1 Market size and forecast

    • 5.2 Public Cloud

      • 5.2.1 Key market trends, growth factors and opportunities

      • 5.2.2 Market size and forecast, by region

      • 5.2.3 Market analysis by country

    • 5.3 Private Cloud

      • 5.3.1 Key market trends, growth factors and opportunities

      • 5.3.2 Market size and forecast, by region

      • 5.3.3 Market analysis by country

    • 5.4 Hybrid Cloud

      • 5.4.1 Key market trends, growth factors and opportunities

      • 5.4.2 Market size and forecast, by region

      • 5.4.3 Market analysis by country

  • CHAPTER 6: DATA PROTECTION AS A SERVICE (DPAAS) MARKET, BY ENTERPRISE SIZE

    • 6.1 Overview

      • 6.1.1 Market size and forecast

    • 6.2 Large Enterprise

      • 6.2.1 Key market trends, growth factors and opportunities

      • 6.2.2 Market size and forecast, by region

      • 6.2.3 Market analysis by country

    • 6.3 SMEs

      • 6.3.1 Key market trends, growth factors and opportunities

      • 6.3.2 Market size and forecast, by region

      • 6.3.3 Market analysis by country

  • CHAPTER 7: DATA PROTECTION AS A SERVICE (DPAAS) MARKET, BY REGION

    • 7.1 Overview

      • 7.1.1 Market size and forecast

    • 7.2 North America

      • 7.2.1 Key trends and opportunities

      • 7.2.2 North America Market size and forecast, by Service Type

      • 7.2.3 North America Market size and forecast, by Deployment Mode

      • 7.2.4 North America Market size and forecast, by Enterprise Size

      • 7.2.5 North America Market size and forecast, by country

        • 7.2.5.1 U.S.
          • 7.2.5.1.1 Market size and forecast, by Service Type
          • 7.2.5.1.2 Market size and forecast, by Deployment Mode
          • 7.2.5.1.3 Market size and forecast, by Enterprise Size
        • 7.2.5.2 Canada
          • 7.2.5.2.1 Market size and forecast, by Service Type
          • 7.2.5.2.2 Market size and forecast, by Deployment Mode
          • 7.2.5.2.3 Market size and forecast, by Enterprise Size
    • 7.3 Europe

      • 7.3.1 Key trends and opportunities

      • 7.3.2 Europe Market size and forecast, by Service Type

      • 7.3.3 Europe Market size and forecast, by Deployment Mode

      • 7.3.4 Europe Market size and forecast, by Enterprise Size

      • 7.3.5 Europe Market size and forecast, by country

        • 7.3.5.1 United Kingdom
          • 7.3.5.1.1 Market size and forecast, by Service Type
          • 7.3.5.1.2 Market size and forecast, by Deployment Mode
          • 7.3.5.1.3 Market size and forecast, by Enterprise Size
        • 7.3.5.2 Germany
          • 7.3.5.2.1 Market size and forecast, by Service Type
          • 7.3.5.2.2 Market size and forecast, by Deployment Mode
          • 7.3.5.2.3 Market size and forecast, by Enterprise Size
        • 7.3.5.3 France
          • 7.3.5.3.1 Market size and forecast, by Service Type
          • 7.3.5.3.2 Market size and forecast, by Deployment Mode
          • 7.3.5.3.3 Market size and forecast, by Enterprise Size
        • 7.3.5.4 Italy
          • 7.3.5.4.1 Market size and forecast, by Service Type
          • 7.3.5.4.2 Market size and forecast, by Deployment Mode
          • 7.3.5.4.3 Market size and forecast, by Enterprise Size
        • 7.3.5.5 Spain
          • 7.3.5.5.1 Market size and forecast, by Service Type
          • 7.3.5.5.2 Market size and forecast, by Deployment Mode
          • 7.3.5.5.3 Market size and forecast, by Enterprise Size
        • 7.3.5.6 Netherlands
          • 7.3.5.6.1 Market size and forecast, by Service Type
          • 7.3.5.6.2 Market size and forecast, by Deployment Mode
          • 7.3.5.6.3 Market size and forecast, by Enterprise Size
        • 7.3.5.7 Rest of Europe
          • 7.3.5.7.1 Market size and forecast, by Service Type
          • 7.3.5.7.2 Market size and forecast, by Deployment Mode
          • 7.3.5.7.3 Market size and forecast, by Enterprise Size
    • 7.4 Asia-Pacific

      • 7.4.1 Key trends and opportunities

      • 7.4.2 Asia-Pacific Market size and forecast, by Service Type

      • 7.4.3 Asia-Pacific Market size and forecast, by Deployment Mode

      • 7.4.4 Asia-Pacific Market size and forecast, by Enterprise Size

      • 7.4.5 Asia-Pacific Market size and forecast, by country

        • 7.4.5.1 Japan
          • 7.4.5.1.1 Market size and forecast, by Service Type
          • 7.4.5.1.2 Market size and forecast, by Deployment Mode
          • 7.4.5.1.3 Market size and forecast, by Enterprise Size
        • 7.4.5.2 China
          • 7.4.5.2.1 Market size and forecast, by Service Type
          • 7.4.5.2.2 Market size and forecast, by Deployment Mode
          • 7.4.5.2.3 Market size and forecast, by Enterprise Size
        • 7.4.5.3 South Korea
          • 7.4.5.3.1 Market size and forecast, by Service Type
          • 7.4.5.3.2 Market size and forecast, by Deployment Mode
          • 7.4.5.3.3 Market size and forecast, by Enterprise Size
        • 7.4.5.4 Australia
          • 7.4.5.4.1 Market size and forecast, by Service Type
          • 7.4.5.4.2 Market size and forecast, by Deployment Mode
          • 7.4.5.4.3 Market size and forecast, by Enterprise Size
        • 7.4.5.5 India
          • 7.4.5.5.1 Market size and forecast, by Service Type
          • 7.4.5.5.2 Market size and forecast, by Deployment Mode
          • 7.4.5.5.3 Market size and forecast, by Enterprise Size
        • 7.4.5.6 Rest of Asia-Pacific
          • 7.4.5.6.1 Market size and forecast, by Service Type
          • 7.4.5.6.2 Market size and forecast, by Deployment Mode
          • 7.4.5.6.3 Market size and forecast, by Enterprise Size
    • 7.5 LAMEA

      • 7.5.1 Key trends and opportunities

      • 7.5.2 LAMEA Market size and forecast, by Service Type

      • 7.5.3 LAMEA Market size and forecast, by Deployment Mode

      • 7.5.4 LAMEA Market size and forecast, by Enterprise Size

      • 7.5.5 LAMEA Market size and forecast, by country

        • 7.5.5.1 Brazil
          • 7.5.5.1.1 Market size and forecast, by Service Type
          • 7.5.5.1.2 Market size and forecast, by Deployment Mode
          • 7.5.5.1.3 Market size and forecast, by Enterprise Size
        • 7.5.5.2 Argentina
          • 7.5.5.2.1 Market size and forecast, by Service Type
          • 7.5.5.2.2 Market size and forecast, by Deployment Mode
          • 7.5.5.2.3 Market size and forecast, by Enterprise Size
        • 7.5.5.3 Rest of LAMEA
          • 7.5.5.3.1 Market size and forecast, by Service Type
          • 7.5.5.3.2 Market size and forecast, by Deployment Mode
          • 7.5.5.3.3 Market size and forecast, by Enterprise Size
  • CHAPTER 8: COMPANY LANDSCAPE

    • 8.1. Introduction

    • 8.2. Top winning strategies

    • 8.3. Product Mapping of Top 10 Player

    • 8.4. Competitive Dashboard

    • 8.5. Competitive Heatmap

    • 8.6. Key developments

  • CHAPTER 9: COMPANY PROFILES

    • 9.1 IBM CORPORATION

      • 9.1.1 Company overview

      • 9.1.2 Company snapshot

      • 9.1.3 Operating business segments

      • 9.1.4 Product portfolio

      • 9.1.5 Business performance

      • 9.1.6 Key strategic moves and developments

    • 9.2 AMAZON WEB SERVICES

      • 9.2.1 Company overview

      • 9.2.2 Company snapshot

      • 9.2.3 Operating business segments

      • 9.2.4 Product portfolio

      • 9.2.5 Business performance

      • 9.2.6 Key strategic moves and developments

    • 9.3 INC.

      • 9.3.1 Company overview

      • 9.3.2 Company snapshot

      • 9.3.3 Operating business segments

      • 9.3.4 Product portfolio

      • 9.3.5 Business performance

      • 9.3.6 Key strategic moves and developments

    • 9.4 HEWLETT-PACKARD DEVELOPMENT COMPANY

      • 9.4.1 Company overview

      • 9.4.2 Company snapshot

      • 9.4.3 Operating business segments

      • 9.4.4 Product portfolio

      • 9.4.5 Business performance

      • 9.4.6 Key strategic moves and developments

    • 9.5 L.P.

      • 9.5.1 Company overview

      • 9.5.2 Company snapshot

      • 9.5.3 Operating business segments

      • 9.5.4 Product portfolio

      • 9.5.5 Business performance

      • 9.5.6 Key strategic moves and developments

    • 9.6 COMMVAULT SYSTEMS

      • 9.6.1 Company overview

      • 9.6.2 Company snapshot

      • 9.6.3 Operating business segments

      • 9.6.4 Product portfolio

      • 9.6.5 Business performance

      • 9.6.6 Key strategic moves and developments

    • 9.7 VMWARE

      • 9.7.1 Company overview

      • 9.7.2 Company snapshot

      • 9.7.3 Operating business segments

      • 9.7.4 Product portfolio

      • 9.7.5 Business performance

      • 9.7.6 Key strategic moves and developments

    • 9.8 INC.

      • 9.8.1 Company overview

      • 9.8.2 Company snapshot

      • 9.8.3 Operating business segments

      • 9.8.4 Product portfolio

      • 9.8.5 Business performance

      • 9.8.6 Key strategic moves and developments

    • 9.9 QUANTUM CORPORATION

      • 9.9.1 Company overview

      • 9.9.2 Company snapshot

      • 9.9.3 Operating business segments

      • 9.9.4 Product portfolio

      • 9.9.5 Business performance

      • 9.9.6 Key strategic moves and developments

    • 9.10 ASIGRA

      • 9.10.1 Company overview

      • 9.10.2 Company snapshot

      • 9.10.3 Operating business segments

      • 9.10.4 Product portfolio

      • 9.10.5 Business performance

      • 9.10.6 Key strategic moves and developments

    • 9.11 INC.

      • 9.11.1 Company overview

      • 9.11.2 Company snapshot

      • 9.11.3 Operating business segments

      • 9.11.4 Product portfolio

      • 9.11.5 Business performance

      • 9.11.6 Key strategic moves and developments

    • 9.12 INC.

      • 9.12.1 Company overview

      • 9.12.2 Company snapshot

      • 9.12.3 Operating business segments

      • 9.12.4 Product portfolio

      • 9.12.5 Business performance

      • 9.12.6 Key strategic moves and developments

    • 9.13 EMC CORPORATION

      • 9.13.1 Company overview

      • 9.13.2 Company snapshot

      • 9.13.3 Operating business segments

      • 9.13.4 Product portfolio

      • 9.13.5 Business performance

      • 9.13.6 Key strategic moves and developments

    • 9.14 VERITAS TECHNOLOGIES

      • 9.14.1 Company overview

      • 9.14.2 Company snapshot

      • 9.14.3 Operating business segments

      • 9.14.4 Product portfolio

      • 9.14.5 Business performance

      • 9.14.6 Key strategic moves and developments

    • 9.15 CISCO SYSTEMS

      • 9.15.1 Company overview

      • 9.15.2 Company snapshot

      • 9.15.3 Operating business segments

      • 9.15.4 Product portfolio

      • 9.15.5 Business performance

      • 9.15.6 Key strategic moves and developments

  • LIST OF TABLES

  • TABLE 1. GLOBAL DATA PROTECTION AS A SERVICE (DPAAS) MARKET, BY SERVICE TYPE, 2020-2030,($BILLION)
    TABLE 2. DATA PROTECTION AS A SERVICE (DPAAS) MARKET REVENUE, FOR DISASTER RECOVERY AS A SERVICE, BY REGION , 2020-2030,($BILLION)
    TABLE 3. DATA PROTECTION AS A SERVICE (DPAAS) MARKET DISASTER RECOVERY AS A SERVICE BY COUNTRY, 2020-2030,($BILLION)
    TABLE 4. DATA PROTECTION AS A SERVICE (DPAAS) MARKET REVENUE, FOR BACKUP AS A SERVICE, BY REGION , 2020-2030,($BILLION)
    TABLE 5. DATA PROTECTION AS A SERVICE (DPAAS) MARKET BACKUP AS A SERVICE BY COUNTRY, 2020-2030,($BILLION)
    TABLE 6. DATA PROTECTION AS A SERVICE (DPAAS) MARKET REVENUE, FOR STORAGE AS A SERVICE, BY REGION , 2020-2030,($BILLION)
    TABLE 7. DATA PROTECTION AS A SERVICE (DPAAS) MARKET STORAGE AS A SERVICE BY COUNTRY, 2020-2030,($BILLION)
    TABLE 8. GLOBAL DATA PROTECTION AS A SERVICE (DPAAS) MARKET, BY DEPLOYMENT MODE, 2020-2030,($BILLION)
    TABLE 9. DATA PROTECTION AS A SERVICE (DPAAS) MARKET REVENUE, FOR PUBLIC CLOUD, BY REGION , 2020-2030,($BILLION)
    TABLE 10. DATA PROTECTION AS A SERVICE (DPAAS) MARKET PUBLIC CLOUD BY COUNTRY, 2020-2030,($BILLION)
    TABLE 11. DATA PROTECTION AS A SERVICE (DPAAS) MARKET REVENUE, FOR PRIVATE CLOUD, BY REGION , 2020-2030,($BILLION)
    TABLE 12. DATA PROTECTION AS A SERVICE (DPAAS) MARKET PRIVATE CLOUD BY COUNTRY, 2020-2030,($BILLION)
    TABLE 13. DATA PROTECTION AS A SERVICE (DPAAS) MARKET REVENUE, FOR HYBRID CLOUD, BY REGION , 2020-2030,($BILLION)
    TABLE 14. DATA PROTECTION AS A SERVICE (DPAAS) MARKET HYBRID CLOUD BY COUNTRY, 2020-2030,($BILLION)
    TABLE 15. GLOBAL DATA PROTECTION AS A SERVICE (DPAAS) MARKET, BY ENTERPRISE SIZE, 2020-2030,($BILLION)
    TABLE 16. DATA PROTECTION AS A SERVICE (DPAAS) MARKET REVENUE, FOR LARGE ENTERPRISE, BY REGION , 2020-2030,($BILLION)
    TABLE 17. DATA PROTECTION AS A SERVICE (DPAAS) MARKET LARGE ENTERPRISE BY COUNTRY, 2020-2030,($BILLION)
    TABLE 18. DATA PROTECTION AS A SERVICE (DPAAS) MARKET REVENUE, FOR SMES, BY REGION , 2020-2030,($BILLION)
    TABLE 19. DATA PROTECTION AS A SERVICE (DPAAS) MARKET SMES BY COUNTRY, 2020-2030,($BILLION)
    TABLE 20. DATA PROTECTION AS A SERVICE (DPAAS) MARKET, BY REGION, 2020-2030,($BILLION)
    TABLE 21. NORTH AMERICA DATA PROTECTION AS A SERVICE (DPAAS) MARKET, BY SERVICE TYPE, 2020-2030,($BILLION)
    TABLE 22. NORTH AMERICA DATA PROTECTION AS A SERVICE (DPAAS) MARKET, BY DEPLOYMENT MODE, 2020-2030,($BILLION)
    TABLE 23. NORTH AMERICA DATA PROTECTION AS A SERVICE (DPAAS) MARKET, BY ENTERPRISE SIZE, 2020-2030,($BILLION)
    TABLE 24. NORTH AMERICA DATA PROTECTION AS A SERVICE (DPAAS) MARKET, BY COUNTRY, 2020-2030,($BILLION)
    TABLE 25. U.S. DATA PROTECTION AS A SERVICE (DPAAS) MARKET BY SERVICE TYPE 2020-2030,($BILLION)
    TABLE 26. U.S. DATA PROTECTION AS A SERVICE (DPAAS) MARKET BY DEPLOYMENT MODE 2020-2030,($BILLION)
    TABLE 27. U.S. DATA PROTECTION AS A SERVICE (DPAAS) MARKET BY ENTERPRISE SIZE 2020-2030,($BILLION)
    TABLE 28. CANADA DATA PROTECTION AS A SERVICE (DPAAS) MARKET BY SERVICE TYPE 2020-2030,($BILLION)
    TABLE 29. CANADA DATA PROTECTION AS A SERVICE (DPAAS) MARKET BY DEPLOYMENT MODE 2020-2030,($BILLION)
    TABLE 30. CANADA DATA PROTECTION AS A SERVICE (DPAAS) MARKET BY ENTERPRISE SIZE 2020-2030,($BILLION)
    TABLE 31. EUROPE DATA PROTECTION AS A SERVICE (DPAAS) MARKET, BY SERVICE TYPE, 2020-2030,($BILLION)
    TABLE 32. EUROPE DATA PROTECTION AS A SERVICE (DPAAS) MARKET, BY DEPLOYMENT MODE, 2020-2030,($BILLION)
    TABLE 33. EUROPE DATA PROTECTION AS A SERVICE (DPAAS) MARKET, BY ENTERPRISE SIZE, 2020-2030,($BILLION)
    TABLE 34. EUROPE DATA PROTECTION AS A SERVICE (DPAAS) MARKET, BY COUNTRY, 2020-2030,($BILLION)
    TABLE 35. UNITED KINGDOM DATA PROTECTION AS A SERVICE (DPAAS) MARKET BY SERVICE TYPE 2020-2030,($BILLION)
    TABLE 36. UNITED KINGDOM DATA PROTECTION AS A SERVICE (DPAAS) MARKET BY DEPLOYMENT MODE 2020-2030,($BILLION)
    TABLE 37. UNITED KINGDOM DATA PROTECTION AS A SERVICE (DPAAS) MARKET BY ENTERPRISE SIZE 2020-2030,($BILLION)
    TABLE 38. GERMANY DATA PROTECTION AS A SERVICE (DPAAS) MARKET BY SERVICE TYPE 2020-2030,($BILLION)
    TABLE 39. GERMANY DATA PROTECTION AS A SERVICE (DPAAS) MARKET BY DEPLOYMENT MODE 2020-2030,($BILLION)
    TABLE 40. GERMANY DATA PROTECTION AS A SERVICE (DPAAS) MARKET BY ENTERPRISE SIZE 2020-2030,($BILLION)
    TABLE 41. FRANCE DATA PROTECTION AS A SERVICE (DPAAS) MARKET BY SERVICE TYPE 2020-2030,($BILLION)
    TABLE 42. FRANCE DATA PROTECTION AS A SERVICE (DPAAS) MARKET BY DEPLOYMENT MODE 2020-2030,($BILLION)
    TABLE 43. FRANCE DATA PROTECTION AS A SERVICE (DPAAS) MARKET BY ENTERPRISE SIZE 2020-2030,($BILLION)
    TABLE 44. ITALY DATA PROTECTION AS A SERVICE (DPAAS) MARKET BY SERVICE TYPE 2020-2030,($BILLION)
    TABLE 45. ITALY DATA PROTECTION AS A SERVICE (DPAAS) MARKET BY DEPLOYMENT MODE 2020-2030,($BILLION)
    TABLE 46. ITALY DATA PROTECTION AS A SERVICE (DPAAS) MARKET BY ENTERPRISE SIZE 2020-2030,($BILLION)
    TABLE 47. SPAIN DATA PROTECTION AS A SERVICE (DPAAS) MARKET BY SERVICE TYPE 2020-2030,($BILLION)
    TABLE 48. SPAIN DATA PROTECTION AS A SERVICE (DPAAS) MARKET BY DEPLOYMENT MODE 2020-2030,($BILLION)
    TABLE 49. SPAIN DATA PROTECTION AS A SERVICE (DPAAS) MARKET BY ENTERPRISE SIZE 2020-2030,($BILLION)
    TABLE 50. NETHERLANDS DATA PROTECTION AS A SERVICE (DPAAS) MARKET BY SERVICE TYPE 2020-2030,($BILLION)
    TABLE 51. NETHERLANDS DATA PROTECTION AS A SERVICE (DPAAS) MARKET BY DEPLOYMENT MODE 2020-2030,($BILLION)
    TABLE 52. NETHERLANDS DATA PROTECTION AS A SERVICE (DPAAS) MARKET BY ENTERPRISE SIZE 2020-2030,($BILLION)
    TABLE 53. REST OF EUROPE DATA PROTECTION AS A SERVICE (DPAAS) MARKET BY SERVICE TYPE 2020-2030,($BILLION)
    TABLE 54. REST OF EUROPE DATA PROTECTION AS A SERVICE (DPAAS) MARKET BY DEPLOYMENT MODE 2020-2030,($BILLION)
    TABLE 55. REST OF EUROPE DATA PROTECTION AS A SERVICE (DPAAS) MARKET BY ENTERPRISE SIZE 2020-2030,($BILLION)
    TABLE 56. ASIA-PACIFIC DATA PROTECTION AS A SERVICE (DPAAS) MARKET, BY SERVICE TYPE, 2020-2030,($BILLION)
    TABLE 57. ASIA-PACIFIC DATA PROTECTION AS A SERVICE (DPAAS) MARKET, BY DEPLOYMENT MODE, 2020-2030,($BILLION)
    TABLE 58. ASIA-PACIFIC DATA PROTECTION AS A SERVICE (DPAAS) MARKET, BY ENTERPRISE SIZE, 2020-2030,($BILLION)
    TABLE 59. ASIA-PACIFIC DATA PROTECTION AS A SERVICE (DPAAS) MARKET, BY COUNTRY, 2020-2030,($BILLION)
    TABLE 60. JAPAN DATA PROTECTION AS A SERVICE (DPAAS) MARKET BY SERVICE TYPE 2020-2030,($BILLION)
    TABLE 61. JAPAN DATA PROTECTION AS A SERVICE (DPAAS) MARKET BY DEPLOYMENT MODE 2020-2030,($BILLION)
    TABLE 62. JAPAN DATA PROTECTION AS A SERVICE (DPAAS) MARKET BY ENTERPRISE SIZE 2020-2030,($BILLION)
    TABLE 63. CHINA DATA PROTECTION AS A SERVICE (DPAAS) MARKET BY SERVICE TYPE 2020-2030,($BILLION)
    TABLE 64. CHINA DATA PROTECTION AS A SERVICE (DPAAS) MARKET BY DEPLOYMENT MODE 2020-2030,($BILLION)
    TABLE 65. CHINA DATA PROTECTION AS A SERVICE (DPAAS) MARKET BY ENTERPRISE SIZE 2020-2030,($BILLION)
    TABLE 66. SOUTH KOREA DATA PROTECTION AS A SERVICE (DPAAS) MARKET BY SERVICE TYPE 2020-2030,($BILLION)
    TABLE 67. SOUTH KOREA DATA PROTECTION AS A SERVICE (DPAAS) MARKET BY DEPLOYMENT MODE 2020-2030,($BILLION)
    TABLE 68. SOUTH KOREA DATA PROTECTION AS A SERVICE (DPAAS) MARKET BY ENTERPRISE SIZE 2020-2030,($BILLION)
    TABLE 69. AUSTRALIA DATA PROTECTION AS A SERVICE (DPAAS) MARKET BY SERVICE TYPE 2020-2030,($BILLION)
    TABLE 70. AUSTRALIA DATA PROTECTION AS A SERVICE (DPAAS) MARKET BY DEPLOYMENT MODE 2020-2030,($BILLION)
    TABLE 71. AUSTRALIA DATA PROTECTION AS A SERVICE (DPAAS) MARKET BY ENTERPRISE SIZE 2020-2030,($BILLION)
    TABLE 72. INDIA DATA PROTECTION AS A SERVICE (DPAAS) MARKET BY SERVICE TYPE 2020-2030,($BILLION)
    TABLE 73. INDIA DATA PROTECTION AS A SERVICE (DPAAS) MARKET BY DEPLOYMENT MODE 2020-2030,($BILLION)
    TABLE 74. INDIA DATA PROTECTION AS A SERVICE (DPAAS) MARKET BY ENTERPRISE SIZE 2020-2030,($BILLION)
    TABLE 75. REST OF ASIA-PACIFIC DATA PROTECTION AS A SERVICE (DPAAS) MARKET BY SERVICE TYPE 2020-2030,($BILLION)
    TABLE 76. REST OF ASIA-PACIFIC DATA PROTECTION AS A SERVICE (DPAAS) MARKET BY DEPLOYMENT MODE 2020-2030,($BILLION)
    TABLE 77. REST OF ASIA-PACIFIC DATA PROTECTION AS A SERVICE (DPAAS) MARKET BY ENTERPRISE SIZE 2020-2030,($BILLION)
    TABLE 78. LAMEA DATA PROTECTION AS A SERVICE (DPAAS) MARKET, BY SERVICE TYPE, 2020-2030,($BILLION)
    TABLE 79. LAMEA DATA PROTECTION AS A SERVICE (DPAAS) MARKET, BY DEPLOYMENT MODE, 2020-2030,($BILLION)
    TABLE 80. LAMEA DATA PROTECTION AS A SERVICE (DPAAS) MARKET, BY ENTERPRISE SIZE, 2020-2030,($BILLION)
    TABLE 81. LAMEA DATA PROTECTION AS A SERVICE (DPAAS) MARKET, BY COUNTRY, 2020-2030,($BILLION)
    TABLE 82. BRAZIL DATA PROTECTION AS A SERVICE (DPAAS) MARKET BY SERVICE TYPE 2020-2030,($BILLION)
    TABLE 83. BRAZIL DATA PROTECTION AS A SERVICE (DPAAS) MARKET BY DEPLOYMENT MODE 2020-2030,($BILLION)
    TABLE 84. BRAZIL DATA PROTECTION AS A SERVICE (DPAAS) MARKET BY ENTERPRISE SIZE 2020-2030,($BILLION)
    TABLE 85. ARGENTINA DATA PROTECTION AS A SERVICE (DPAAS) MARKET BY SERVICE TYPE 2020-2030,($BILLION)
    TABLE 86. ARGENTINA DATA PROTECTION AS A SERVICE (DPAAS) MARKET BY DEPLOYMENT MODE 2020-2030,($BILLION)
    TABLE 87. ARGENTINA DATA PROTECTION AS A SERVICE (DPAAS) MARKET BY ENTERPRISE SIZE 2020-2030,($BILLION)
    TABLE 88. REST OF LAMEA DATA PROTECTION AS A SERVICE (DPAAS) MARKET BY SERVICE TYPE 2020-2030,($BILLION)
    TABLE 89. REST OF LAMEA DATA PROTECTION AS A SERVICE (DPAAS) MARKET BY DEPLOYMENT MODE 2020-2030,($BILLION)
    TABLE 90. REST OF LAMEA DATA PROTECTION AS A SERVICE (DPAAS) MARKET BY ENTERPRISE SIZE 2020-2030,($BILLION)
    TABLE 91.IBM CORPORATION: COMPANY SNAPSHOT
    TABLE 92.IBM CORPORATION: OPERATING SEGMENTS
    TABLE 93.IBM CORPORATION: PRODUCT PORTFOLIO
    TABLE 94.IBM CORPORATION: NET SALES,
    TABLE 95.IBM CORPORATION: KEY STRATERGIES
    TABLE 96.AMAZON WEB SERVICES: COMPANY SNAPSHOT
    TABLE 97.AMAZON WEB SERVICES: OPERATING SEGMENTS
    TABLE 98.AMAZON WEB SERVICES: PRODUCT PORTFOLIO
    TABLE 99.AMAZON WEB SERVICES: NET SALES,
    TABLE 100.AMAZON WEB SERVICES: KEY STRATERGIES
    TABLE 101. INC.: COMPANY SNAPSHOT
    TABLE 102. INC.: OPERATING SEGMENTS
    TABLE 103. INC.: PRODUCT PORTFOLIO
    TABLE 104. INC.: NET SALES,
    TABLE 105. INC.: KEY STRATERGIES
    TABLE 106.HEWLETT-PACKARD DEVELOPMENT COMPANY: COMPANY SNAPSHOT
    TABLE 107.HEWLETT-PACKARD DEVELOPMENT COMPANY: OPERATING SEGMENTS
    TABLE 108.HEWLETT-PACKARD DEVELOPMENT COMPANY: PRODUCT PORTFOLIO
    TABLE 109.HEWLETT-PACKARD DEVELOPMENT COMPANY: NET SALES,
    TABLE 110.HEWLETT-PACKARD DEVELOPMENT COMPANY: KEY STRATERGIES
    TABLE 111. L.P.: COMPANY SNAPSHOT
    TABLE 112. L.P.: OPERATING SEGMENTS
    TABLE 113. L.P.: PRODUCT PORTFOLIO
    TABLE 114. L.P.: NET SALES,
    TABLE 115. L.P.: KEY STRATERGIES
    TABLE 116.COMMVAULT SYSTEMS: COMPANY SNAPSHOT
    TABLE 117.COMMVAULT SYSTEMS: OPERATING SEGMENTS
    TABLE 118.COMMVAULT SYSTEMS: PRODUCT PORTFOLIO
    TABLE 119.COMMVAULT SYSTEMS: NET SALES,
    TABLE 120.COMMVAULT SYSTEMS: KEY STRATERGIES
    TABLE 121.VMWARE: COMPANY SNAPSHOT
    TABLE 122.VMWARE: OPERATING SEGMENTS
    TABLE 123.VMWARE: PRODUCT PORTFOLIO
    TABLE 124.VMWARE: NET SALES,
    TABLE 125.VMWARE: KEY STRATERGIES
    TABLE 126. INC.: COMPANY SNAPSHOT
    TABLE 127. INC.: OPERATING SEGMENTS
    TABLE 128. INC.: PRODUCT PORTFOLIO
    TABLE 129. INC.: NET SALES,
    TABLE 130. INC.: KEY STRATERGIES
    TABLE 131.QUANTUM CORPORATION: COMPANY SNAPSHOT
    TABLE 132.QUANTUM CORPORATION: OPERATING SEGMENTS
    TABLE 133.QUANTUM CORPORATION: PRODUCT PORTFOLIO
    TABLE 134.QUANTUM CORPORATION: NET SALES,
    TABLE 135.QUANTUM CORPORATION: KEY STRATERGIES
    TABLE 136.ASIGRA: COMPANY SNAPSHOT
    TABLE 137.ASIGRA: OPERATING SEGMENTS
    TABLE 138.ASIGRA: PRODUCT PORTFOLIO
    TABLE 139.ASIGRA: NET SALES,
    TABLE 140.ASIGRA: KEY STRATERGIES
    TABLE 141. INC.: COMPANY SNAPSHOT
    TABLE 142. INC.: OPERATING SEGMENTS
    TABLE 143. INC.: PRODUCT PORTFOLIO
    TABLE 144. INC.: NET SALES,
    TABLE 145. INC.: KEY STRATERGIES
    TABLE 146. INC.: COMPANY SNAPSHOT
    TABLE 147. INC.: OPERATING SEGMENTS
    TABLE 148. INC.: PRODUCT PORTFOLIO
    TABLE 149. INC.: NET SALES,
    TABLE 150. INC.: KEY STRATERGIES
    TABLE 151.EMC CORPORATION: COMPANY SNAPSHOT
    TABLE 152.EMC CORPORATION: OPERATING SEGMENTS
    TABLE 153.EMC CORPORATION: PRODUCT PORTFOLIO
    TABLE 154.EMC CORPORATION: NET SALES,
    TABLE 155.EMC CORPORATION: KEY STRATERGIES
    TABLE 156.VERITAS TECHNOLOGIES: COMPANY SNAPSHOT
    TABLE 157.VERITAS TECHNOLOGIES: OPERATING SEGMENTS
    TABLE 158.VERITAS TECHNOLOGIES: PRODUCT PORTFOLIO
    TABLE 159.VERITAS TECHNOLOGIES: NET SALES,
    TABLE 160.VERITAS TECHNOLOGIES: KEY STRATERGIES
    TABLE 161.CISCO SYSTEMS: COMPANY SNAPSHOT
    TABLE 162.CISCO SYSTEMS: OPERATING SEGMENTS
    TABLE 163.CISCO SYSTEMS: PRODUCT PORTFOLIO
    TABLE 164.CISCO SYSTEMS: NET SALES,
    TABLE 165.CISCO SYSTEMS: KEY STRATERGIES
  • LIST OF FIGURES

  • FIGURE 1.DATA PROTECTION AS A SERVICE (DPAAS) MARKET SEGMENTATION
    FIGURE 2.DATA PROTECTION AS A SERVICE (DPAAS) MARKET,2020-2030
    FIGURE 3.DATA PROTECTION AS A SERVICE (DPAAS) MARKET,2020-2030
    FIGURE 4. TOP INVESTMENT POCKETS, BY REGION
    FIGURE 5.PORTER FIVE-1
    FIGURE 6.PORTER FIVE-2
    FIGURE 7.PORTER FIVE-3
    FIGURE 8.PORTER FIVE-4
    FIGURE 9.PORTER FIVE-5
    FIGURE 10.TOP PLAYER POSITIONING
    FIGURE 11.DATA PROTECTION AS A SERVICE (DPAAS) MARKET:DRIVERS, RESTRAINTS AND OPPORTUNITIES
    FIGURE 13.DATA PROTECTION AS A SERVICE (DPAAS) MARKET,BY SERVICE TYPE,2020(%)
    FIGURE 14.COMPARATIVE SHARE ANALYSIS OF DISASTER RECOVERY AS A SERVICE DATA PROTECTION AS A SERVICE (DPAAS) MARKET,2020-2030(%)
    FIGURE 15.COMPARATIVE SHARE ANALYSIS OF BACKUP AS A SERVICE DATA PROTECTION AS A SERVICE (DPAAS) MARKET,2020-2030(%)
    FIGURE 16.COMPARATIVE SHARE ANALYSIS OF STORAGE AS A SERVICE DATA PROTECTION AS A SERVICE (DPAAS) MARKET,2020-2030(%)
    FIGURE 17.DATA PROTECTION AS A SERVICE (DPAAS) MARKET,BY DEPLOYMENT MODE,2020(%)
    FIGURE 18.COMPARATIVE SHARE ANALYSIS OF PUBLIC CLOUD DATA PROTECTION AS A SERVICE (DPAAS) MARKET,2020-2030(%)
    FIGURE 19.COMPARATIVE SHARE ANALYSIS OF PRIVATE CLOUD DATA PROTECTION AS A SERVICE (DPAAS) MARKET,2020-2030(%)
    FIGURE 20.COMPARATIVE SHARE ANALYSIS OF HYBRID CLOUD DATA PROTECTION AS A SERVICE (DPAAS) MARKET,2020-2030(%)
    FIGURE 21.DATA PROTECTION AS A SERVICE (DPAAS) MARKET,BY ENTERPRISE SIZE,2020(%)
    FIGURE 22.COMPARATIVE SHARE ANALYSIS OF LARGE ENTERPRISE DATA PROTECTION AS A SERVICE (DPAAS) MARKET,2020-2030(%)
    FIGURE 23.COMPARATIVE SHARE ANALYSIS OF SMES DATA PROTECTION AS A SERVICE (DPAAS) MARKET,2020-2030(%)
    FIGURE 24.DATA PROTECTION AS A SERVICE (DPAAS) MARKET BY REGION,2020
    FIGURE 25.U.S. DATA PROTECTION AS A SERVICE (DPAAS) MARKET,2020-2030($BILLION)
    FIGURE 26.CANADA DATA PROTECTION AS A SERVICE (DPAAS) MARKET,2020-2030($BILLION)
    FIGURE 27.UNITED KINGDOM DATA PROTECTION AS A SERVICE (DPAAS) MARKET,2020-2030($BILLION)
    FIGURE 28.GERMANY DATA PROTECTION AS A SERVICE (DPAAS) MARKET,2020-2030($BILLION)
    FIGURE 29.FRANCE DATA PROTECTION AS A SERVICE (DPAAS) MARKET,2020-2030($BILLION)
    FIGURE 30.ITALY DATA PROTECTION AS A SERVICE (DPAAS) MARKET,2020-2030($BILLION)
    FIGURE 31.SPAIN DATA PROTECTION AS A SERVICE (DPAAS) MARKET,2020-2030($BILLION)
    FIGURE 32.NETHERLANDS DATA PROTECTION AS A SERVICE (DPAAS) MARKET,2020-2030($BILLION)
    FIGURE 33.REST OF EUROPE DATA PROTECTION AS A SERVICE (DPAAS) MARKET,2020-2030($BILLION)
    FIGURE 34.JAPAN DATA PROTECTION AS A SERVICE (DPAAS) MARKET,2020-2030($BILLION)
    FIGURE 35.CHINA DATA PROTECTION AS A SERVICE (DPAAS) MARKET,2020-2030($BILLION)
    FIGURE 36.SOUTH KOREA DATA PROTECTION AS A SERVICE (DPAAS) MARKET,2020-2030($BILLION)
    FIGURE 37.AUSTRALIA DATA PROTECTION AS A SERVICE (DPAAS) MARKET,2020-2030($BILLION)
    FIGURE 38.INDIA DATA PROTECTION AS A SERVICE (DPAAS) MARKET,2020-2030($BILLION)
    FIGURE 39.REST OF ASIA-PACIFIC DATA PROTECTION AS A SERVICE (DPAAS) MARKET,2020-2030($BILLION)
    FIGURE 40.BRAZIL DATA PROTECTION AS A SERVICE (DPAAS) MARKET,2020-2030($BILLION)
    FIGURE 41.ARGENTINA DATA PROTECTION AS A SERVICE (DPAAS) MARKET,2020-2030($BILLION)
    FIGURE 42.REST OF LAMEA DATA PROTECTION AS A SERVICE (DPAAS) MARKET,2020-2030($BILLION)
    FIGURE 43. TOP WINNING STRATEGIES, BY YEAR
    FIGURE 44. TOP WINNING STRATEGIES, BY DEVELOPMENT
    FIGURE 45. TOP WINNING STRATEGIES, BY COMPANY
    FIGURE 46.PRODUCT MAPPING OF TOP 10 PLAYERS
    FIGURE 47.COMPETITIVE DASHBOARD
    FIGURE 48.COMPETITIVE HEATMAP OF TOP 10 KEY PLAYERS
    FIGURE 49.IBM CORPORATION.: NET SALES ,($BILLION)
    FIGURE 50.AMAZON WEB SERVICES.: NET SALES ,($BILLION)
    FIGURE 51. INC..: NET SALES ,($BILLION)
    FIGURE 52.HEWLETT-PACKARD DEVELOPMENT COMPANY.: NET SALES ,($BILLION)
    FIGURE 53. L.P..: NET SALES ,($BILLION)
    FIGURE 54.COMMVAULT SYSTEMS.: NET SALES ,($BILLION)
    FIGURE 55.VMWARE.: NET SALES ,($BILLION)
    FIGURE 56. INC..: NET SALES ,($BILLION)
    FIGURE 57.QUANTUM CORPORATION.: NET SALES ,($BILLION)
    FIGURE 58.ASIGRA.: NET SALES ,($BILLION)
    FIGURE 59. INC..: NET SALES ,($BILLION)
    FIGURE 60. INC..: NET SALES ,($BILLION)
    FIGURE 61.EMC CORPORATION.: NET SALES ,($BILLION)
    FIGURE 62.VERITAS TECHNOLOGIES.: NET SALES ,($BILLION)
    FIGURE 63.CISCO SYSTEMS.: NET SALES ,($BILLION)


According to the insights of the CXOs of leading companies, the Data protection-as-a-service (DPaaS) market exhibits promising opportunities. North America has witnessed the highest adoption of this service, followed by Europe, Asia-Pacific, and LAMEA. In addition, market players have adopted innovative techniques to provide advanced and innovative offerings.

Some of the factors that have become the driving force behind the increasing reliance on DPaaS are disaster recovery and cost-effectiveness. By using DPaaS, businesses are provided with an affordable way to bring backup, storage, and disaster recovery options into their business operations. In addition, by providing services to companies at an affordable price, DPaaS helps businesses step into the future by providing the tools necessary for businesses to succeed.

Private cloud is the preferred deployment model in the market, followed by public and hybrid cloud. At present, storage as a service (STaaS) is extensively used by large enterprises and SMEs. Among end users, large enterprises exhibited the highest revenue growth in the global market.

The global DPaaS market is dominated by key players such as IBM Corporation, Amazon Web Services, Inc., HP Development Company, LP, Commvault Systems, Inc., EMC Corporation, VMware, Inc., Quantum Corporation, Asigra, Inc., Veritas Technologies, and Cisco Systems. The key players have adopted various growth strategies to enhance and develop their product portfolio, strengthen their edge computing market share, and to increase their market penetration.

For instance, in February 2022, Veritas Technologies announced the latest version of NetBackup™ powered by Cloud Scale Technology, the next generation of NetBackup’s industry-leading architecture, which is the foundation for Autonomous Data Management and multi-cloud data protection at scale.

PURCHASE OPTIONS

Call or Email us

U.S.-Canada Toll-free: +1-800-792-5285
Int'l : +1-503-894-6022
Europe : +44-845-528-1300
Email : help@alliedmarketresearch.com
 
FREQUENTLY ASKED QUESTIONS?

A. The global DPaaS industry is influenced by several factors such as increase in concerns about data loss; rise in need for data backups & archives; and governance, risk, and compliance requirements for storage.

A. North America dominates the market. The expansion of cyber security and cloud service business in North America has driven the market for DPaaS in the region. Moreover, increase in implementation of legislative compliances to improve cloud security and reduce cyber-attacks has boosted the market growth.

A. The global DPaaS market is dominated by key players such as IBM Corporation, Amazon Web Services, Inc., HP Development Company, LP, Commvault Systems, Inc., EMC Corporation, VMware, Inc., Quantum Corporation, Asigra, Inc., Veritas Technologies, and Cisco Systems. The key players have adopted various growth strategies to enhance and develop their product portfolio, strengthen their edge computing market share, and to increase their market penetration.

Looking for Customization?

 Customization Request

Have a Question?

 Speak with Analyst

Any Confusion?

 Inquire Before Buying

Have a glance of the Report

  Request Sample
RELATED TAGS

Purchase Full Report of
Data Protection As A Service (dpaas) Market

Start reading instantly.
This Report and over 67,404+ more Reports, Available with Avenue Library. T&C*.

  • Online Only
  • $3,456
  • Online cloud access only
  • Restricted print, copy, paste & download
  • Read only
  • Free industry update
    (Within 180 days)
  • Free report update in next update cycle
    (Mar 2023 - Mar 2024)
  • Data Pack
  • $3,840
  • Restricted to one authorized user
  • One print only
  • Available in
    Excel
  • Free industry update
    (Within 180 days)
  •   Free report update in next update cycle
    (Mar 2023 - Mar 2024)
  • Single User
  • $5,769
  • Restricted to one authorized user
  • One print only
  • Available in
    PDF
  • Free industry update
    (Within 180 days)
  •   Free report update in next update cycle
    (Mar 2023 - Mar 2024)
  • Five Users
  • $6,450
  • Limited to five authorized users
  • Print upto five copies
  • Available in
    PDF
  • Free industry update
    (Within 180 days)
  •   Free report update in next update cycle
    (Mar 2023 - Mar 2024)
  • Enterprise
    License/PDF

  • $10,995
  • Unlimited
    within
    company/enterprise
  • Available in Excel & PDF
  • Free industry update
    (Within 180 days)
  •   Free report update in next update cycle
    (Mar 2023 - Mar 2024)
  • Library
    Membership

  • $999 $ 1,175
    Per User/ Per month/ Billed annually
  • Published Content
    E-access
  • Company Profiles
    E-access
  • Newly Added Content Access
  • 10 PDF
    Downloads
  • 5 Excel Data
    Pack Downloads
  • 250 Company Profiles PDF Downloads
  • Buy Now

*Taxes/Fees, if applicable will be added during checkout. All prices in USD

RELATED REPORTS
 

Why Allied Market Research?


Infallible Methodology

To ensure high-level data integrity, accurate analysis, and impeccable forecasts

Analyst Support

For complete satisfaction

Customization

On-demand customization of scope of the report to exactly meet your needs

TARGETED MARKET VIEW

Targeted market view to provide pertinent information and save time of readers

Get fresh content delivered

Get insights on topics that are crucial for your business. Stay abreast of your interest areas.

Get Industry Data Alerts

Why Allied Market Research?

Infallible Methodology

To ensure high-level data integrity, accurate analysis, and impeccable forecasts

Analyst Support

For complete satisfaction

Customization

On-demand customization of scope of the report to exactly meet your needs

TARGETED MARKET VIEW

Targeted market view to provide pertinent information and save time of readers