
Data Visualization Tools Market Overview
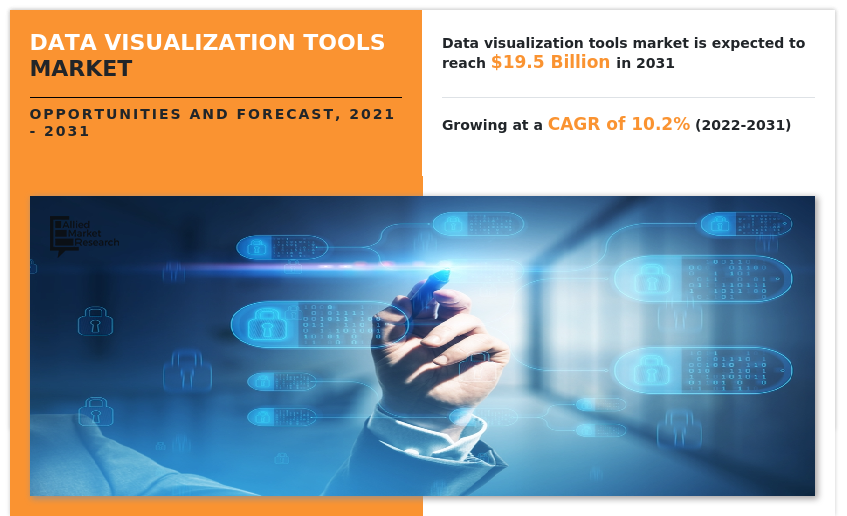
The global data visualization tools market size was valued at $7.4 billion in 2021 and is projected to reach $19.5 billion by 2031, growing at a CAGR of 10.2% from 2022 to 2031.
The rise in demand for work from home and remote working policies during the period of the COVID-19 pandemic aided in propelling the growth of the global data analytics and remote management solutions, hence empowering the demand for the data visualization tools industry. However, data privacy and sharing challenges on data visualization tools platforms can hamper the data visualization tools market forecast. On the contrary, the integration of advanced tools such as machine learning and data analytics with data visualization tools solutions suites are expected to offer remunerative opportunities for expansion of the data visualization tools industry during the forecast period.
A graphical representation of information and data is referred to as a data visualization. Data visualization tools, which include visual components such as charts, graphs, and maps, make it easy to view and comprehend trends, outliers, and patterns in data. Data visualization tools are critical for the process of decision-making and operation optimization in the modern business world.
Segment Review
The data visualization tools market is segmented on the basis of offering, deployment model, enterprise size, application, industry vertical, and region. On the basis of offering, the industry is divided into software and service. Depending on deployment mode, the market is classified into on premise and cloud. Based on enterprise size, the market is bifurcated into large enterprises and SMEs.
On the basis of application, the industry is segmented into supply chain, sales and marketing, finance, human resources (HR), and others. The industry vertical covered in the study include BFSI, manufacturing, healthcare, government, energy and utilities, transportation, retail and e-commerce, IT and telecom, education, media and entertainment, and others. Region wise, it is analyzed across North America, Europe, Asia-Pacific, and LAMEA.
Depending on industry vertical, the BFSI segment dominated the data visualization tools market share in 2021, and is expected to continue this trend during the forecast period owing to the growing digital participation of BFSI sector companies, incentivizing major businesses of the sector to invest in effective data visualization tools solutions for their organization. However, the retail and e-commerce segment is expected to witness the highest growth in the upcoming years, owing to rise in popularity of e-commerce and online retail businesses.

Region wise, the data visualization software market was dominated by North America in 2021, and is expected to retain its position during the forecast period, owing to its high concentration of data visualization solutions vendors such as Amazon Web Services, Inc., Microsoft Corporation, and IBM corporation, which is expected to drive the market for data visualization tools technology within the region during the forecast period. However, Asia-Pacific is expected to witness significant growth during the forecast period, owing to rapid economic and technological developments in the region, which is expected to fuel the growth of data visualization tools solutions in the region in the coming few years.

The report focuses on growth prospects, restraints, and analysis of the global data visualization tools market trends. The study provides Porter’s five forces analysis to understand the impact of various factors, such as bargaining power of suppliers, competitive intensity of competitors, threat of new entrants, threat of substitutes, and bargaining power of buyers on the global data visualization tools market share
Major Industry Players
The key players profiled in the data visualization tools market analysis are Alibaba Group Holding Limited, ALTERYX, INC., Amazon Web Services, Inc., Domo, Inc., Dundas Data Visualization, Inc., GoodData Corporation, International Business Machines Corporation, Klipfolio Inc., Microsoft Corporation, Oracle, QlikTech International AB, Salesforce, Inc., SAP SE, SAS Institute Inc., Sisense Inc., TIBCO Software Inc., Zegami. These players have adopted various strategies to increase their market penetration and strengthen their position in the data visualization tools industry.
Top Impacting Factors:
Growing digitization trends and increased digital data production
In the past few decades, digital data production has grown exponentially, and it is not expected to slow down in the near future. Increased penetration of digital devices such as smartphones and computers in the daily life of average consumers, is one of the key factors responsible for this boom in digital data production. Additionally, the increasing popularity of the Internet of Things (IoT) and the data produced from various IoT devices have also been contributing to this data boom. High amounts of digital data productions have made it difficult for data analysts to process this data and make sense of it.
Data visualization and summarization tools have to be employed to help process these huge amounts of data to help with identifying data trends and present visualization of these huge amounts of data, which can optimize the process of decision making in many business sectors. Moreover, with the adoption of big tools and analysis solutions becoming common in the modern business infrastructure the demand for data visualization tools is expected to increase even further in the coming few years.
Surge in demand for operation optimization and data analytics solutions
Consumer data can be trickier to analyze and harder to handle. Major business enterprises such as Amazon and FedEx, both of which have been using data analytics practices for more than a decade. Have developed specialized algorithms focused on the analyzing everyday needs of its customers, thanks to its army of in-house data scientists and analysts. Moreover, large corporations have access to a vast amount of data on their customers, which aids in the creation of user profiles of their customers. Such user profiles can compile various user preferences and information and uses it to target them with specific advertising and marketing campaigns, increasing the likelihood of a confirmed sale.
However, many smaller (and even large) businesses may not have access to a large team of data scientists and analysts at their disposal and may need to employ third-party data analytics and visualization solutions to help them with their data mining needs as in-house solutions can be expensive. Furthermore, data visualization solutions can help organizations to help identify and focus on their most profitable and revenue generator segment, which can immediately contribute positively toward the goals and needs of the company. Such factors are fueling the need for data visualization solutions in modern business enterprises.
Key Benefits for Stakeholders:
This report provides a quantitative analysis of the data visualization tools market growth, current trends, estimations, and dynamics of the data visualization tools market analysis from 2021 to 2031 to identify the prevailing data visualization tools market opportunities.
The market research is offered along with information related to key drivers, restraints, and opportunities.
Porter's five forces analysis highlights the potency of buyers and suppliers to enable stakeholders make profit-oriented business decisions and strengthen their supplier-buyer network.
In-depth analysis of the data visualization tools market segmentation assists to determine the prevailing market opportunities.
Major countries in each region are mapped according to their revenue contribution to the global market.
Market player positioning facilitates benchmarking and provides a clear understanding of the present position of the market players.
The report includes the analysis of the regional as well as global data visualization tools market trends, key players, market segments, application areas, and market growth strategies.
Data Visualization Tools Market Report Highlights
| Aspects | Details |
| By Offering |
|
| By Deployment Model |
|
| By Enterprise Size |
|
| By Application |
|
| By Industry Vertical |
|
| By Region |
|
| Key Market Players | International Business Machines Corporation, Amazon Web Services, Inc., Zegami, Klipfolio Inc., QlikTech International AB, Sisense Inc., Microsoft Corporation, Dundas Data Visualization, Inc., Salesforce, Inc., Alibaba Group Holding Limited, Oracle, ALTERYX, INC., SAS Institute Inc., GoodData Corporation, SAP SE, Domo, Inc., TIBCO Software Inc. |
Analyst Review
Demand for data visualization tools has been on a rise for the past few years and the market is expected to continue this trend in the coming years as well, owing to the growing complexity of digital data and the increasing smartphone penetration. In addition, growing internet penetration in many regions of the world is promising new opportunities for the growth of the data visualization tools markets.
Key providers of the data visualization tool market such as Alibaba Group Holding Limited, ALTERYX, INC., and Amazon Web Services, Inc. account for a significant share of the market. With larger requirements for data visualization tools and services, various companies are establishing partnerships to increase their data visualization capabilities. For instance, in September 2021, Alibaba Group Holding Limited announced a strategic partnership with Grafana labs. Under this partnership, the companies introduced Grafana on Alibaba Cloud, a fully managed data visualization service that enables customers to instantly query and visualize operational metrics from various data sources.
In addition, with the increase in demand for data visualization tools, various companies are expanding their current product portfolio with increasing diversification among customers. For instance, in March 2022, Domo, Inc. announced the launch of their Data app data visualization tool. The data app was designed to bring the benefit of data-driven decisions and actions to those who are underserved by traditional business intelligence (BI) and analytics.
Moreover, market players are expanding their business operations and customers by increasing their acquisitions. For instance, in October 2021, Alteryx Inc. announced the acquisition of Lore IO. The acquisition of Lore IO provided Alteryx with the talent and technical know-how to leverage cloud-native, elastic compute within Alteryx Designer Cloud and Alteryx Machine Learning, allowing customers to analyze large datasets for actionable self-service insights.
The rise in demand for work from home and remote working policies during the period of the COVID-19 pandemic aided in propelling the growth of the global data analytics and remote management solutions, hence empowering the demand for the data visualization tools industry.
Region wise, the data visualization tools market was dominated by North America in 2021, and is expected to retain its position during the forecast period, owing to its high concentration of data visualization solutions vendors such as Amazon Web Services, Inc., Microsoft Corporation, and IBM corporation, which is expected to drive the market for data visualization tools technology within the region during the forecast period.
The global data visualization tools market size was valued at $7.43 billion in 2021, and is projected to reach $19.52 billion by 2031, growing at a CAGR of 10.2% from 2022 to 2031.
The key players profiled in the data visualization tools market analysis are Alibaba Group Holding Limited, ALTERYX, INC., Amazon Web Services, Inc., Domo, Inc., Dundas Data Visualization, Inc., GoodData Corporation, International Business Machines Corporation, Klipfolio Inc., Microsoft Corporation, Oracle, QlikTech International AB, Salesforce, Inc., SAP SE, SAS Institute Inc., Sisense Inc., TIBCO Software Inc., Zegami. These players have adopted various strategies to increase their market penetration and strengthen their position in the industry.
Loading Table Of Content...

