0
2023
Digital Multimeter Market

Digital Multimeter Market

by Product Type (Handheld, Desktop, Mounted), by Ranging Type (Auto-ranging, Manual), by Industry Vertical (Consumer Electronics, Automotive, Power Generation, Healthcare, Others): Global Opportunity Analysis and Industry Forecast, 2021-2031

Report Code: A05308
Feb 2023 | Pages: 213
Tables: 130
Charts: 64
  • Formats*:

  • pdf

    Single User License, Five User
    License & Enterprise User License

  • xls

    Data Pack Excel License

  • ppt

    It comes with the additional cost
    of $2500.00 contact sales.


Digital Multimeter Market Research, 2031
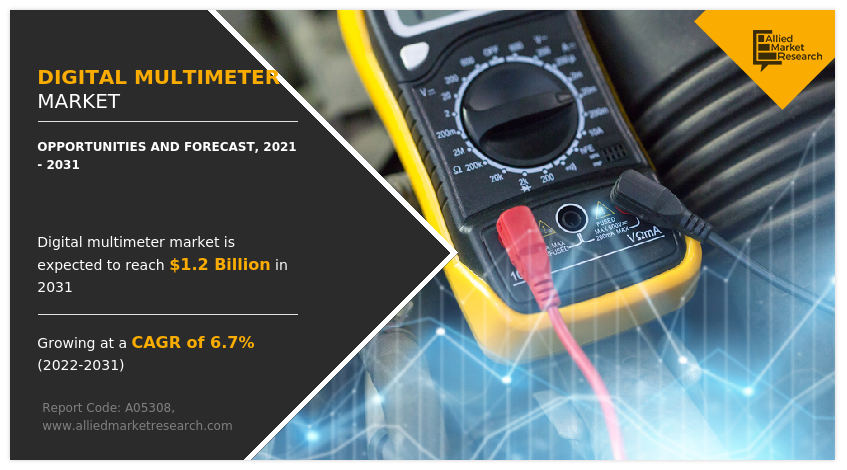
The global digital multimeter market was valued at $0.61 billion in 2021, and is projected to reach $1.1 billion by 2031, growing at a CAGR of 6.7% from 2022 to 2031.

Digital multimeters are a type of multimeters which are used to measure quantities such as capacitance, wattage, current, voltage and resistance. The various types of these instruments such as mini digital multimeters and automotive multimeter show the measured values on a digital display on the device, so that they can be easily read by first-time users, hobbyists as well as professionals. These instruments fall under the category of test and measurement instruments, and can be used to check the working condition of equipment such as electric circuits, fuses, automotive battery, HVAC units, semiconductors, and printed circuit boards. In some digital multimeters, the measurement range needs to be selected manually, and in others, this range is selected automatically. The latter type of digital multimeters can be used easily by hobbyists and beginners, while the former type is more suited to professionals.

The digital multimeter industry is expected to witness growth during the forecast period, owing to their higher precision in comparison to analog testers. This high precision means the ability of digital multimeter to accommodate higher resolutions because its digital display is capable of showing more digits. Digital multimeters are considerably less susceptible to reading errors on account-of its easy-to-read digital displays. On the other hand, there is a higher possibility of people making mistakes while reading values from analog testers, because those devices indicate values using a needle, which a person may read properly. Such errors, called reading errors, are avoided on digital multimeters.

The digital multimeter market has witnessed mixed impact of the outbreak of the COVID-19 pandemic. With governments of several nations imposing and extending lockdowns, production and manufacturing facilities across the globe have been shut down, leading to crisis and unavailability of workforce. Considering the inputs from various industry experts belonging to various stages of the value chain, such as OEMs, suppliers, integrators, end users, and distributors, and the financial release of various companies in the digital multimeter ecosystem, it is calculated that the market has experienced a decline during 2019–2020. Furthermore, the outbreak of the pandemic has disrupted the global supply chain, thereby creating significant gap in supply chain. Economic impact of the pandemic has been disruptive. Key players operating in the digital multimeter industry temporarily witnessed a slowdown, owing to lack of availability of raw materials, which has led to decline in revenues for the financial year 2020 to 2021. However, it is expected that the market started recovering from 2021 and will remain in the growth stage during the forecast period. The measures taken by the major players in the temperature detection screen market to counter the negative effects of covid-19 include making moderate cuts to R&D budgets and focusing on next-generation products.

Digital Multimeter Market

The digital multimeter market is segmented into Product Type, Ranging Type and Industry Vertical.

Further, adoption of technology is increasing considerably in various industries. Particularly, automation and process control equipment are making strides at a rapid pace in industries. This has led to the expanding use of existing electronics such as passive components and electromechanical components in existing products. For instance, the automobile industry has witnessed an increasing level of automation in manufacturing as well as the product itself. This technology adoption is also an important driver of the digital multimeter industry. Meanwhile, the digital multimeter market growth is facing a challenge from small manufacturers. These players manufacture the device at lower costs by reducing its quality. Small manufacturers have found the market barrier to be low due to digital multimeters being a long-established technology and the minimum complexity in the product’s design. On a positive note, according to digital multimeter market analysis, the increasing adoption of Industry 4.0 and Internet of Things (IoT) is expected to lead to a digital multimeter market opportunity during the forecast period. The Internet of Things (IoT) consists of web-connected smart devices which collect and analyze data from their surroundings using embedded systems such as processors, sensors and communication hardware. Whereas, Industry 4.0 is revolutionizing the manufacturing industry by bringing robotic technology, automation, and Internet of Things (IoT) to the production facilities. The maintenance and testing of all these electronic systems is expected to boost the demand for digital multimeters and positively affect the digital multimeter market outlook.

Segmentation Overview

Digital Multimeter Market

On the basis of product type, the digital multimeter market size is segmented into handheld, desktop and mounted. The handheld/portable segment dominated the market in terms of revenue in 2021. However, the mounted segment is expected to expand at a higher growth rate during the digital multimeter market forecast. Handheld digital multimeters can be used in more locations and scenarios which is a major driving factor for their usage. They are typically used when the measurements need to be taken in field operations, or of hazardous systems, and when mobility is an important factor in the work.

Digital Multimeter Market

On the basis of ranging type, the digital multimeter market share is segmented into auto-ranging and manual. The manual segment dominated the market in 2021, whereas the auto-ranging segment is likely to expand at a faster rate during the forecast period. Manual digital multimeters provide many benefits to professionals in various industries such as electronics, electricals, technology, and scientific research. To use a manual digital multimeter, a person needs to have considerable knowledge, including which range the value fall under. But it also allows professionals to put the digital multimeter to considerable use and gain many types of readings, as compared to amateurs. Hence, the sales of manual digital multimeters are high and driven by professionals.

Digital Multimeter Market

In terms of industry vertical, the market is segmented into consumer electronics, automotive, power generation, healthcare, and others. The consumer electronics segment dominated the market in 2021, whereas the automotive segment is likely to expand at a faster rate during the forecast period. The rising sales of consumer electronics on account-of the improving living standards of population is a major driver of the segment. Whereas the increasing adoption of technology in the automotive industry, including the introduction and fast-rising sales of electric vehicles is likely to boost the sales of digital multimeters in the forecast period.

Digital Multimeter Market

In terms of region, the market is analyzed across North America, Europe, Asia-Pacific, and LAMEA. Asia-Pacific dominated the market with the largest share in 2021 and it is also expected to witness the highest growth rate during the forecast period. Several of the major companies in the market are located in Asia-Pacific region. This presents a significant opportunity for them to expand their product line-up and geographic reach in the market. Furthermore, this region also has several of the world’s largest semiconductor and electronics firms such as Taiwan Semiconductor Manufacturing Company and LG Electronics, which are major consumers of digital multimeters. The combination of these and other factors are responsible for the high sales of digital multimeters in Asia-Pacific.

Competitive Analysis

Competitive analysis and profiles of the major digital multimeter market players that have been provided in the report include National Instruments Corporation, Keysight Technologies, Gossen Metrawatt GmbH, Fluke Corporation, FLIR Systems, Inc., Tektronix, Inc., Yokogawa Electric Corporation, Rohde & Schwarz GmbH & Co KG, Hioki E.E. Corporation, and Sanwa Electric Instrument Co., Ltd. These key players adopt several strategies such as new product launch and development, acquisition, partnership and collaboration and business expansion to increase their market share in the global digital multimeter market during the forecast period.

Top Impacting Factors

Some of the significant factors impacting the global digital multimeter market include that they provide more precision as compared to analog testers, have an expanding use in different end-user industries, are versatile in nature, and face competition from small manufacturers selling cheap versions of the product. The increasing demand from various industries for incorporation of technology is a major influencer of the demand for digital multimeters. However, the sale of low quality and cheap digital multimeters by local manufacturers is expected to restrain growth of the market. Meanwhile, increasing number of applications due to the adoption of Internet of Things (IoT) and Industry 4.0 provide an opportunity to market players during the forecast period.

Historical Data & Information

The digital multimeter market is fairly competitive, owing to the strong presence of existing vendors. Market vendors are expected to gain a competitive advantage over their competitors because they can cater to market demands with a wide range of products. The competitive environment in this market is expected to increase as technological innovations, product extensions, and different strategies are adopted by key vendors.

Key Developments/Strategies

Keysight Technologies, FLIR Systems Inc., Fluke Corporation, and Tektronix Inc. are among the top companies which hold a prime share in the digital multimeter market. Top market players have adopted various strategies such as product launches, contracts, and others to expand their foothold in the digital multimeter market.

  • In July 2021, Fluke launched Fluke IRR1-SOL it has been designed from the ground up to simplify the installation, commissioning, and troubleshooting of photovoltaic arrays by measuring irradiance, temperature, inclination, and direction of the solar array with a single handheld tool.
  • In May 2021, Teledyne Technologies, Inc. completed the acquisition of FLIR Systems, in a cash-and-stock deal worth approximately $8.2 billion. By acquiring FLIR Systems, Teledyne not only expanded its imaging sensor and meters portfolio in terms of volumes, but the deal also helped it gaining production efficiency.
  • In September 2020, Gossen Metrawatt developed, DAkkS-calibrated multimeter generation, adding a device for the automotive sector. The new METRAHIT IM E DRIVE is an all-in-one solution combining all relevant test and measurement functions for maintenance, service, and diagnostics of electric machines, drives, and systems.
  • In December 2022, HIOKI launched the DC Hipot tester ST5680 for the safety inspection process of battery modules. The DC Hipot test is one of the electrical safety tests in the module production of LIBs (lithium-ion batteries). The required test conditions depend on the standards required for each battery. The DC Hipot tester ST5680 has the specifications to comply with a wide range of international standards.

Key Benefits For Stakeholders

  • This report provides a quantitative analysis of the market segments, current trends, estimations, and dynamics of the digital multimeter market analysis from 2021 to 2031 to identify the prevailing digital multimeter market opportunities.
  • The market research is offered along with information related to key drivers, restraints, and opportunities.
  • Porter's five forces analysis highlights the potency of buyers and suppliers to enable stakeholders make profit-oriented business decisions and strengthen their supplier-buyer network.
  • In-depth analysis of the digital multimeter market segmentation assists to determine the prevailing market opportunities.
  • Major countries in each region are mapped according to their revenue contribution to the global market.
  • Market player positioning facilitates benchmarking and provides a clear understanding of the present position of the market players.
  • The report includes the analysis of the regional as well as global digital multimeter market trends, key players, market segments, application areas, and market growth strategies.

Digital Multimeter Market Report Highlights

Aspects Details
Market Size By 2031 USD 1.2 billion
Growth Rate CAGR of 6.7%
Forecast period 2021 - 2031
Report Pages 213
By Product Type
  • Handheld
  • Desktop
  • Mounted
By Ranging Type
  • Auto-ranging
  • Manual
By Industry Vertical
  • Consumer Electronics
  • Automotive
  • Power Generation
  • Healthcare
  • Others
By Region
  • North America  (U.S., Canada, Mexico)
  • Europe  (UK, Germany, France, Italy, Spain, Rest of Europe)
  • Asia-Pacific  (China, Japan, India, South Korea, Rest of Asia-Pacific)
  • LAMEA  (Latin America, Middle East, Africa)
Key Market Players Rohde & Schwarz GmbH & Co KG, Keysight Technologies, HIOKI E.E. CORPORATION, Sanwa Electric Instrument Co., Ltd., National Instruments Corporation, Yokogawa Electric Corporation, TEKTRONIX, INC., Fluke Corporation, Gossen Metrawatt GmbH, FLIR Systems, Inc.
 
  • CHAPTER 1: INTRODUCTION

    • 1.1. Report description

    • 1.2. Key market segments

    • 1.3. Key benefits to the stakeholders

    • 1.4. Research Methodology

      • 1.4.1. Primary research

      • 1.4.2. Secondary research

      • 1.4.3. Analyst tools and models

  • CHAPTER 2: EXECUTIVE SUMMARY

    • 2.1. CXO Perspective

  • CHAPTER 3: MARKET OVERVIEW

    • 3.1. Market definition and scope

    • 3.2. Key findings

      • 3.2.1. Top impacting factors

      • 3.2.2. Top investment pockets

    • 3.3. Porter’s five forces analysis

      • 3.3.1. Moderate-to-high bargaining power of suppliers

      • 3.3.2. Moderate-to-high bargaining power of buyers

      • 3.3.3. Moderate-to-high threat of substitutes

      • 3.3.4. Low-to-moderate threat of new entrants

      • 3.3.5. Moderate-to-high intensity of rivalry

    • 3.4. Market dynamics

      • 3.4.1. Drivers

        • 3.4.1.1. Higher precision as compared to analog testers
        • 3.4.1.2. Expanding use of technology in different end-use industries
        • 3.4.1.3. Versatile nature of digital multimeters

      • 3.4.2. Restraints

        • 3.4.2.1. Competition from small players selling at cheap prices

      • 3.4.3. Opportunities

        • 3.4.3.1. Increasing adoption and implementation of Internet of Things (IoT) and Industry 4.0

    • 3.5. COVID-19 Impact Analysis on the market

  • CHAPTER 4: DIGITAL MULTIMETER MARKET, BY PRODUCT TYPE

    • 4.1. Overview

      • 4.1.1. Market size and forecast

    • 4.2. Handheld

      • 4.2.1. Key market trends, growth factors and opportunities

      • 4.2.2. Market size and forecast, by region

      • 4.2.3. Market share analysis by country

    • 4.3. Desktop

      • 4.3.1. Key market trends, growth factors and opportunities

      • 4.3.2. Market size and forecast, by region

      • 4.3.3. Market share analysis by country

    • 4.4. Mounted

      • 4.4.1. Key market trends, growth factors and opportunities

      • 4.4.2. Market size and forecast, by region

      • 4.4.3. Market share analysis by country

  • CHAPTER 5: DIGITAL MULTIMETER MARKET, BY RANGING TYPE

    • 5.1. Overview

      • 5.1.1. Market size and forecast

    • 5.2. Auto-ranging

      • 5.2.1. Key market trends, growth factors and opportunities

      • 5.2.2. Market size and forecast, by region

      • 5.2.3. Market share analysis by country

    • 5.3. Manual

      • 5.3.1. Key market trends, growth factors and opportunities

      • 5.3.2. Market size and forecast, by region

      • 5.3.3. Market share analysis by country

  • CHAPTER 6: DIGITAL MULTIMETER MARKET, BY INDUSTRY VERTICAL

    • 6.1. Overview

      • 6.1.1. Market size and forecast

    • 6.2. Consumer Electronics

      • 6.2.1. Key market trends, growth factors and opportunities

      • 6.2.2. Market size and forecast, by region

      • 6.2.3. Market share analysis by country

    • 6.3. Automotive

      • 6.3.1. Key market trends, growth factors and opportunities

      • 6.3.2. Market size and forecast, by region

      • 6.3.3. Market share analysis by country

    • 6.4. Power Generation

      • 6.4.1. Key market trends, growth factors and opportunities

      • 6.4.2. Market size and forecast, by region

      • 6.4.3. Market share analysis by country

    • 6.5. Healthcare

      • 6.5.1. Key market trends, growth factors and opportunities

      • 6.5.2. Market size and forecast, by region

      • 6.5.3. Market share analysis by country

    • 6.6. Others

      • 6.6.1. Key market trends, growth factors and opportunities

      • 6.6.2. Market size and forecast, by region

      • 6.6.3. Market share analysis by country

  • CHAPTER 7: DIGITAL MULTIMETER MARKET, BY REGION

    • 7.1. Overview

      • 7.1.1. Market size and forecast By Region

    • 7.2. North America

      • 7.2.1. Key trends and opportunities

      • 7.2.2. Market size and forecast, by Product Type

      • 7.2.3. Market size and forecast, by Ranging Type

      • 7.2.4. Market size and forecast, by Industry Vertical

      • 7.2.5. Market size and forecast, by country

        • 7.2.5.1. U.S.
          • 7.2.5.1.1. Key market trends, growth factors and opportunities
          • 7.2.5.1.2. Market size and forecast, by Product Type
          • 7.2.5.1.3. Market size and forecast, by Ranging Type
          • 7.2.5.1.4. Market size and forecast, by Industry Vertical
        • 7.2.5.2. Canada
          • 7.2.5.2.1. Key market trends, growth factors and opportunities
          • 7.2.5.2.2. Market size and forecast, by Product Type
          • 7.2.5.2.3. Market size and forecast, by Ranging Type
          • 7.2.5.2.4. Market size and forecast, by Industry Vertical
        • 7.2.5.3. Mexico
          • 7.2.5.3.1. Key market trends, growth factors and opportunities
          • 7.2.5.3.2. Market size and forecast, by Product Type
          • 7.2.5.3.3. Market size and forecast, by Ranging Type
          • 7.2.5.3.4. Market size and forecast, by Industry Vertical
    • 7.3. Europe

      • 7.3.1. Key trends and opportunities

      • 7.3.2. Market size and forecast, by Product Type

      • 7.3.3. Market size and forecast, by Ranging Type

      • 7.3.4. Market size and forecast, by Industry Vertical

      • 7.3.5. Market size and forecast, by country

        • 7.3.5.1. UK
          • 7.3.5.1.1. Key market trends, growth factors and opportunities
          • 7.3.5.1.2. Market size and forecast, by Product Type
          • 7.3.5.1.3. Market size and forecast, by Ranging Type
          • 7.3.5.1.4. Market size and forecast, by Industry Vertical
        • 7.3.5.2. Germany
          • 7.3.5.2.1. Key market trends, growth factors and opportunities
          • 7.3.5.2.2. Market size and forecast, by Product Type
          • 7.3.5.2.3. Market size and forecast, by Ranging Type
          • 7.3.5.2.4. Market size and forecast, by Industry Vertical
        • 7.3.5.3. France
          • 7.3.5.3.1. Key market trends, growth factors and opportunities
          • 7.3.5.3.2. Market size and forecast, by Product Type
          • 7.3.5.3.3. Market size and forecast, by Ranging Type
          • 7.3.5.3.4. Market size and forecast, by Industry Vertical
        • 7.3.5.4. Italy
          • 7.3.5.4.1. Key market trends, growth factors and opportunities
          • 7.3.5.4.2. Market size and forecast, by Product Type
          • 7.3.5.4.3. Market size and forecast, by Ranging Type
          • 7.3.5.4.4. Market size and forecast, by Industry Vertical
        • 7.3.5.5. Spain
          • 7.3.5.5.1. Key market trends, growth factors and opportunities
          • 7.3.5.5.2. Market size and forecast, by Product Type
          • 7.3.5.5.3. Market size and forecast, by Ranging Type
          • 7.3.5.5.4. Market size and forecast, by Industry Vertical
        • 7.3.5.6. Rest of Europe
          • 7.3.5.6.1. Key market trends, growth factors and opportunities
          • 7.3.5.6.2. Market size and forecast, by Product Type
          • 7.3.5.6.3. Market size and forecast, by Ranging Type
          • 7.3.5.6.4. Market size and forecast, by Industry Vertical
    • 7.4. Asia-Pacific

      • 7.4.1. Key trends and opportunities

      • 7.4.2. Market size and forecast, by Product Type

      • 7.4.3. Market size and forecast, by Ranging Type

      • 7.4.4. Market size and forecast, by Industry Vertical

      • 7.4.5. Market size and forecast, by country

        • 7.4.5.1. China
          • 7.4.5.1.1. Key market trends, growth factors and opportunities
          • 7.4.5.1.2. Market size and forecast, by Product Type
          • 7.4.5.1.3. Market size and forecast, by Ranging Type
          • 7.4.5.1.4. Market size and forecast, by Industry Vertical
        • 7.4.5.2. Japan
          • 7.4.5.2.1. Key market trends, growth factors and opportunities
          • 7.4.5.2.2. Market size and forecast, by Product Type
          • 7.4.5.2.3. Market size and forecast, by Ranging Type
          • 7.4.5.2.4. Market size and forecast, by Industry Vertical
        • 7.4.5.3. India
          • 7.4.5.3.1. Key market trends, growth factors and opportunities
          • 7.4.5.3.2. Market size and forecast, by Product Type
          • 7.4.5.3.3. Market size and forecast, by Ranging Type
          • 7.4.5.3.4. Market size and forecast, by Industry Vertical
        • 7.4.5.4. South Korea
          • 7.4.5.4.1. Key market trends, growth factors and opportunities
          • 7.4.5.4.2. Market size and forecast, by Product Type
          • 7.4.5.4.3. Market size and forecast, by Ranging Type
          • 7.4.5.4.4. Market size and forecast, by Industry Vertical
        • 7.4.5.5. Rest of Asia-Pacific
          • 7.4.5.5.1. Key market trends, growth factors and opportunities
          • 7.4.5.5.2. Market size and forecast, by Product Type
          • 7.4.5.5.3. Market size and forecast, by Ranging Type
          • 7.4.5.5.4. Market size and forecast, by Industry Vertical
    • 7.5. LAMEA

      • 7.5.1. Key trends and opportunities

      • 7.5.2. Market size and forecast, by Product Type

      • 7.5.3. Market size and forecast, by Ranging Type

      • 7.5.4. Market size and forecast, by Industry Vertical

      • 7.5.5. Market size and forecast, by country

        • 7.5.5.1. Latin America
          • 7.5.5.1.1. Key market trends, growth factors and opportunities
          • 7.5.5.1.2. Market size and forecast, by Product Type
          • 7.5.5.1.3. Market size and forecast, by Ranging Type
          • 7.5.5.1.4. Market size and forecast, by Industry Vertical
        • 7.5.5.2. Middle East
          • 7.5.5.2.1. Key market trends, growth factors and opportunities
          • 7.5.5.2.2. Market size and forecast, by Product Type
          • 7.5.5.2.3. Market size and forecast, by Ranging Type
          • 7.5.5.2.4. Market size and forecast, by Industry Vertical
        • 7.5.5.3. Africa
          • 7.5.5.3.1. Key market trends, growth factors and opportunities
          • 7.5.5.3.2. Market size and forecast, by Product Type
          • 7.5.5.3.3. Market size and forecast, by Ranging Type
          • 7.5.5.3.4. Market size and forecast, by Industry Vertical
  • CHAPTER 8: COMPETITIVE LANDSCAPE

    • 8.1. Introduction

    • 8.2. Top winning strategies

    • 8.3. Product Mapping of Top 10 Player

    • 8.4. Competitive Dashboard

    • 8.5. Competitive Heatmap

    • 8.6. Top player positioning, 2021

  • CHAPTER 9: COMPANY PROFILES

    • 9.1. Keysight Technologies

      • 9.1.1. Company overview

      • 9.1.2. Key Executives

      • 9.1.3. Company snapshot

      • 9.1.4. Operating business segments

      • 9.1.5. Product portfolio

      • 9.1.6. Business performance

      • 9.1.7. Key strategic moves and developments

    • 9.2. Gossen Metrawatt GmbH

      • 9.2.1. Company overview

      • 9.2.2. Key Executives

      • 9.2.3. Company snapshot

      • 9.2.4. Operating business segments

      • 9.2.5. Product portfolio

      • 9.2.6. Key strategic moves and developments

    • 9.3. National Instruments Corporation

      • 9.3.1. Company overview

      • 9.3.2. Key Executives

      • 9.3.3. Company snapshot

      • 9.3.4. Operating business segments

      • 9.3.5. Product portfolio

      • 9.3.6. Business performance

      • 9.3.7. Key strategic moves and developments

    • 9.4. TEKTRONIX, INC.

      • 9.4.1. Company overview

      • 9.4.2. Key Executives

      • 9.4.3. Company snapshot

      • 9.4.4. Operating business segments

      • 9.4.5. Product portfolio

      • 9.4.6. Key strategic moves and developments

    • 9.5. Yokogawa Electric Corporation

      • 9.5.1. Company overview

      • 9.5.2. Key Executives

      • 9.5.3. Company snapshot

      • 9.5.4. Operating business segments

      • 9.5.5. Product portfolio

      • 9.5.6. Business performance

      • 9.5.7. Key strategic moves and developments

    • 9.6. Fluke Corporation

      • 9.6.1. Company overview

      • 9.6.2. Key Executives

      • 9.6.3. Company snapshot

      • 9.6.4. Operating business segments

      • 9.6.5. Product portfolio

      • 9.6.6. Key strategic moves and developments

    • 9.7. FLIR Systems, Inc.

      • 9.7.1. Company overview

      • 9.7.2. Key Executives

      • 9.7.3. Company snapshot

      • 9.7.4. Operating business segments

      • 9.7.5. Product portfolio

      • 9.7.6. Business performance

      • 9.7.7. Key strategic moves and developments

    • 9.8. Rohde & Schwarz GmbH & Co KG

      • 9.8.1. Company overview

      • 9.8.2. Key Executives

      • 9.8.3. Company snapshot

      • 9.8.4. Operating business segments

      • 9.8.5. Product portfolio

    • 9.9. Sanwa Electric Instrument Co., Ltd.

      • 9.9.1. Company overview

      • 9.9.2. Key Executives

      • 9.9.3. Company snapshot

      • 9.9.4. Operating business segments

      • 9.9.5. Product portfolio

      • 9.9.6. Key strategic moves and developments

    • 9.10. HIOKI E.E. CORPORATION

      • 9.10.1. Company overview

      • 9.10.2. Key Executives

      • 9.10.3. Company snapshot

      • 9.10.4. Operating business segments

      • 9.10.5. Product portfolio

      • 9.10.6. Business performance

      • 9.10.7. Key strategic moves and developments

  • LIST OF TABLES

  • TABLE 01. GLOBAL DIGITAL MULTIMETER MARKET, BY PRODUCT TYPE, 2021-2031 (REVENUE, $MILLION)
    TABLE 02. DIGITAL MULTIMETER MARKET FOR HANDHELD, BY REGION, 2021-2031 (REVENUE, $MILLION)
    TABLE 03. DIGITAL MULTIMETER MARKET FOR DESKTOP, BY REGION, 2021-2031 (REVENUE, $MILLION)
    TABLE 04. DIGITAL MULTIMETER MARKET FOR MOUNTED, BY REGION, 2021-2031 (REVENUE, $MILLION)
    TABLE 05. GLOBAL DIGITAL MULTIMETER MARKET, BY RANGING TYPE, 2021-2031 (REVENUE, $MILLION)
    TABLE 06. DIGITAL MULTIMETER MARKET FOR AUTO-RANGING, BY REGION, 2021-2031 (REVENUE, $MILLION)
    TABLE 07. DIGITAL MULTIMETER MARKET FOR MANUAL, BY REGION, 2021-2031 (REVENUE, $MILLION)
    TABLE 08. GLOBAL DIGITAL MULTIMETER MARKET, BY INDUSTRY VERTICAL, 2021-2031 (REVENUE, $MILLION)
    TABLE 09. DIGITAL MULTIMETER MARKET FOR CONSUMER ELECTRONICS, BY REGION, 2021-2031 (REVENUE, $MILLION)
    TABLE 10. DIGITAL MULTIMETER MARKET FOR AUTOMOTIVE, BY REGION, 2021-2031 (REVENUE, $MILLION)
    TABLE 11. DIGITAL MULTIMETER MARKET FOR POWER GENERATION, BY REGION, 2021-2031 (REVENUE, $MILLION)
    TABLE 12. DIGITAL MULTIMETER MARKET FOR HEALTHCARE, BY REGION, 2021-2031 (REVENUE, $MILLION)
    TABLE 13. DIGITAL MULTIMETER MARKET FOR OTHERS, BY REGION, 2021-2031 (REVENUE, $MILLION)
    TABLE 14. DIGITAL MULTIMETER MARKET, BY REGION, 2021-2031 (REVENUE, $MILLION)
    TABLE 15. NORTH AMERICA DIGITAL MULTIMETER MARKET, BY PRODUCT TYPE, 2021-2031 (REVENUE, $MILLION)
    TABLE 16. NORTH AMERICA DIGITAL MULTIMETER MARKET, BY RANGING TYPE, 2021-2031 (REVENUE, $MILLION)
    TABLE 17. NORTH AMERICA DIGITAL MULTIMETER MARKET, BY INDUSTRY VERTICAL, 2021-2031 (REVENUE, $MILLION)
    TABLE 18. NORTH AMERICA DIGITAL MULTIMETER MARKET, BY COUNTRY, 2021-2031 (REVENUE, $MILLION)
    TABLE 19. U.S. DIGITAL MULTIMETER MARKET, BY PRODUCT TYPE, 2021-2031 (REVENUE, $MILLION)
    TABLE 20. U.S. DIGITAL MULTIMETER MARKET, BY RANGING TYPE, 2021-2031 (REVENUE, $MILLION)
    TABLE 21. U.S. DIGITAL MULTIMETER MARKET, BY INDUSTRY VERTICAL, 2021-2031 (REVENUE, $MILLION)
    TABLE 22. CANADA DIGITAL MULTIMETER MARKET, BY PRODUCT TYPE, 2021-2031 (REVENUE, $MILLION)
    TABLE 23. CANADA DIGITAL MULTIMETER MARKET, BY RANGING TYPE, 2021-2031 (REVENUE, $MILLION)
    TABLE 24. CANADA DIGITAL MULTIMETER MARKET, BY INDUSTRY VERTICAL, 2021-2031 (REVENUE, $MILLION)
    TABLE 25. MEXICO DIGITAL MULTIMETER MARKET, BY PRODUCT TYPE, 2021-2031 (REVENUE, $MILLION)
    TABLE 26. MEXICO DIGITAL MULTIMETER MARKET, BY RANGING TYPE, 2021-2031 (REVENUE, $MILLION)
    TABLE 27. MEXICO DIGITAL MULTIMETER MARKET, BY INDUSTRY VERTICAL, 2021-2031 (REVENUE, $MILLION)
    TABLE 28. EUROPE DIGITAL MULTIMETER MARKET, BY PRODUCT TYPE, 2021-2031 (REVENUE, $MILLION)
    TABLE 29. EUROPE DIGITAL MULTIMETER MARKET, BY RANGING TYPE, 2021-2031 (REVENUE, $MILLION)
    TABLE 30. EUROPE DIGITAL MULTIMETER MARKET, BY INDUSTRY VERTICAL, 2021-2031 (REVENUE, $MILLION)
    TABLE 31. EUROPE DIGITAL MULTIMETER MARKET, BY COUNTRY, 2021-2031 (REVENUE, $MILLION)
    TABLE 32. UK DIGITAL MULTIMETER MARKET, BY PRODUCT TYPE, 2021-2031 (REVENUE, $MILLION)
    TABLE 33. UK DIGITAL MULTIMETER MARKET, BY RANGING TYPE, 2021-2031 (REVENUE, $MILLION)
    TABLE 34. UK DIGITAL MULTIMETER MARKET, BY INDUSTRY VERTICAL, 2021-2031 (REVENUE, $MILLION)
    TABLE 35. GERMANY DIGITAL MULTIMETER MARKET, BY PRODUCT TYPE, 2021-2031 (REVENUE, $MILLION)
    TABLE 36. GERMANY DIGITAL MULTIMETER MARKET, BY RANGING TYPE, 2021-2031 (REVENUE, $MILLION)
    TABLE 37. GERMANY DIGITAL MULTIMETER MARKET, BY INDUSTRY VERTICAL, 2021-2031 (REVENUE, $MILLION)
    TABLE 38. FRANCE DIGITAL MULTIMETER MARKET, BY PRODUCT TYPE, 2021-2031 (REVENUE, $MILLION)
    TABLE 39. FRANCE DIGITAL MULTIMETER MARKET, BY RANGING TYPE, 2021-2031 (REVENUE, $MILLION)
    TABLE 40. FRANCE DIGITAL MULTIMETER MARKET, BY INDUSTRY VERTICAL, 2021-2031 (REVENUE, $MILLION)
    TABLE 41. ITALY DIGITAL MULTIMETER MARKET, BY PRODUCT TYPE, 2021-2031 (REVENUE, $MILLION)
    TABLE 42. ITALY DIGITAL MULTIMETER MARKET, BY RANGING TYPE, 2021-2031 (REVENUE, $MILLION)
    TABLE 43. ITALY DIGITAL MULTIMETER MARKET, BY INDUSTRY VERTICAL, 2021-2031 (REVENUE, $MILLION)
    TABLE 44. SPAIN DIGITAL MULTIMETER MARKET, BY PRODUCT TYPE, 2021-2031 (REVENUE, $MILLION)
    TABLE 45. SPAIN DIGITAL MULTIMETER MARKET, BY RANGING TYPE, 2021-2031 (REVENUE, $MILLION)
    TABLE 46. SPAIN DIGITAL MULTIMETER MARKET, BY INDUSTRY VERTICAL, 2021-2031 (REVENUE, $MILLION)
    TABLE 47. REST OF EUROPE DIGITAL MULTIMETER MARKET, BY PRODUCT TYPE, 2021-2031 (REVENUE, $MILLION)
    TABLE 48. REST OF EUROPE DIGITAL MULTIMETER MARKET, BY RANGING TYPE, 2021-2031 (REVENUE, $MILLION)
    TABLE 49. REST OF EUROPE DIGITAL MULTIMETER MARKET, BY INDUSTRY VERTICAL, 2021-2031 (REVENUE, $MILLION)
    TABLE 50. ASIA-PACIFIC DIGITAL MULTIMETER MARKET, BY PRODUCT TYPE, 2021-2031 (REVENUE, $MILLION)
    TABLE 51. ASIA-PACIFIC DIGITAL MULTIMETER MARKET, BY RANGING TYPE, 2021-2031 (REVENUE, $MILLION)
    TABLE 52. ASIA-PACIFIC DIGITAL MULTIMETER MARKET, BY INDUSTRY VERTICAL, 2021-2031 (REVENUE, $MILLION)
    TABLE 53. ASIA-PACIFIC DIGITAL MULTIMETER MARKET, BY COUNTRY, 2021-2031 (REVENUE, $MILLION)
    TABLE 54. CHINA DIGITAL MULTIMETER MARKET, BY PRODUCT TYPE, 2021-2031 (REVENUE, $MILLION)
    TABLE 55. CHINA DIGITAL MULTIMETER MARKET, BY RANGING TYPE, 2021-2031 (REVENUE, $MILLION)
    TABLE 56. CHINA DIGITAL MULTIMETER MARKET, BY INDUSTRY VERTICAL, 2021-2031 (REVENUE, $MILLION)
    TABLE 57. JAPAN DIGITAL MULTIMETER MARKET, BY PRODUCT TYPE, 2021-2031 (REVENUE, $MILLION)
    TABLE 58. JAPAN DIGITAL MULTIMETER MARKET, BY RANGING TYPE, 2021-2031 (REVENUE, $MILLION)
    TABLE 59. JAPAN DIGITAL MULTIMETER MARKET, BY INDUSTRY VERTICAL, 2021-2031 (REVENUE, $MILLION)
    TABLE 60. INDIA DIGITAL MULTIMETER MARKET, BY PRODUCT TYPE, 2021-2031 (REVENUE, $MILLION)
    TABLE 61. INDIA DIGITAL MULTIMETER MARKET, BY RANGING TYPE, 2021-2031 (REVENUE, $MILLION)
    TABLE 62. INDIA DIGITAL MULTIMETER MARKET, BY INDUSTRY VERTICAL, 2021-2031 (REVENUE, $MILLION)
    TABLE 63. SOUTH KOREA DIGITAL MULTIMETER MARKET, BY PRODUCT TYPE, 2021-2031 (REVENUE, $MILLION)
    TABLE 64. SOUTH KOREA DIGITAL MULTIMETER MARKET, BY RANGING TYPE, 2021-2031 (REVENUE, $MILLION)
    TABLE 65. SOUTH KOREA DIGITAL MULTIMETER MARKET, BY INDUSTRY VERTICAL, 2021-2031 (REVENUE, $MILLION)
    TABLE 66. REST OF ASIA-PACIFIC DIGITAL MULTIMETER MARKET, BY PRODUCT TYPE, 2021-2031 (REVENUE, $MILLION)
    TABLE 67. REST OF ASIA-PACIFIC DIGITAL MULTIMETER MARKET, BY RANGING TYPE, 2021-2031 (REVENUE, $MILLION)
    TABLE 68. REST OF ASIA-PACIFIC DIGITAL MULTIMETER MARKET, BY INDUSTRY VERTICAL, 2021-2031 (REVENUE, $MILLION)
    TABLE 69. LAMEA DIGITAL MULTIMETER MARKET, BY PRODUCT TYPE, 2021-2031 (REVENUE, $MILLION)
    TABLE 70. LAMEA DIGITAL MULTIMETER MARKET, BY RANGING TYPE, 2021-2031 (REVENUE, $MILLION)
    TABLE 71. LAMEA DIGITAL MULTIMETER MARKET, BY INDUSTRY VERTICAL, 2021-2031 (REVENUE, $MILLION)
    TABLE 72. LAMEA DIGITAL MULTIMETER MARKET, BY COUNTRY, 2021-2031 (REVENUE, $MILLION)
    TABLE 73. LATIN AMERICA DIGITAL MULTIMETER MARKET, BY PRODUCT TYPE, 2021-2031 (REVENUE, $MILLION)
    TABLE 74. LATIN AMERICA DIGITAL MULTIMETER MARKET, BY RANGING TYPE, 2021-2031 (REVENUE, $MILLION)
    TABLE 75. LATIN AMERICA DIGITAL MULTIMETER MARKET, BY INDUSTRY VERTICAL, 2021-2031 (REVENUE, $MILLION)
    TABLE 76. MIDDLE EAST DIGITAL MULTIMETER MARKET, BY PRODUCT TYPE, 2021-2031 (REVENUE, $MILLION)
    TABLE 77. MIDDLE EAST DIGITAL MULTIMETER MARKET, BY RANGING TYPE, 2021-2031 (REVENUE, $MILLION)
    TABLE 78. MIDDLE EAST DIGITAL MULTIMETER MARKET, BY INDUSTRY VERTICAL, 2021-2031 (REVENUE, $MILLION)
    TABLE 79. AFRICA DIGITAL MULTIMETER MARKET, BY PRODUCT TYPE, 2021-2031 (REVENUE, $MILLION)
    TABLE 80. AFRICA DIGITAL MULTIMETER MARKET, BY RANGING TYPE, 2021-2031 (REVENUE, $MILLION)
    TABLE 81. AFRICA DIGITAL MULTIMETER MARKET, BY INDUSTRY VERTICAL, 2021-2031 (REVENUE, $MILLION)
    TABLE 82. KEYSIGHT TECHNOLOGIES: KEY EXECUTIVES
    TABLE 83. KEYSIGHT TECHNOLOGIES: COMPANY SNAPSHOT
    TABLE 84. KEYSIGHT TECHNOLOGIES: SERVICE SEGMENTS
    TABLE 85. KEYSIGHT TECHNOLOGIES: PRODUCT PORTFOLIO
    TABLE 86. KEYSIGHT TECHNOLOGIES: KEY STRATERGIES
    TABLE 87. GOSSEN METRAWATT GMBH: KEY EXECUTIVES
    TABLE 88. GOSSEN METRAWATT GMBH: COMPANY SNAPSHOT
    TABLE 89. GOSSEN METRAWATT GMBH: PRODUCT SEGMENTS
    TABLE 90. GOSSEN METRAWATT GMBH: PRODUCT PORTFOLIO
    TABLE 91. GOSSEN METRAWATT GMBH: KEY STRATERGIES
    TABLE 92. NATIONAL INSTRUMENTS CORPORATION: KEY EXECUTIVES
    TABLE 93. NATIONAL INSTRUMENTS CORPORATION: COMPANY SNAPSHOT
    TABLE 94. NATIONAL INSTRUMENTS CORPORATION: PRODUCT SEGMENTS
    TABLE 95. NATIONAL INSTRUMENTS CORPORATION: PRODUCT PORTFOLIO
    TABLE 96. NATIONAL INSTRUMENTS CORPORATION: KEY STRATERGIES
    TABLE 97. TEKTRONIX, INC.: KEY EXECUTIVES
    TABLE 98. TEKTRONIX, INC.: COMPANY SNAPSHOT
    TABLE 99. TEKTRONIX, INC.: PRODUCT SEGMENTS
    TABLE 100. TEKTRONIX, INC.: PRODUCT PORTFOLIO
    TABLE 101. TEKTRONIX, INC.: KEY STRATERGIES
    TABLE 102. YOKOGAWA ELECTRIC CORPORATION: KEY EXECUTIVES
    TABLE 103. YOKOGAWA ELECTRIC CORPORATION: COMPANY SNAPSHOT
    TABLE 104. YOKOGAWA ELECTRIC CORPORATION: SERVICE SEGMENTS
    TABLE 105. YOKOGAWA ELECTRIC CORPORATION: PRODUCT PORTFOLIO
    TABLE 106. YOKOGAWA ELECTRIC CORPORATION: KEY STRATERGIES
    TABLE 107. FLUKE CORPORATION: KEY EXECUTIVES
    TABLE 108. FLUKE CORPORATION: COMPANY SNAPSHOT
    TABLE 109. FLUKE CORPORATION: PRODUCT SEGMENTS
    TABLE 110. FLUKE CORPORATION: PRODUCT PORTFOLIO
    TABLE 111. FLUKE CORPORATION: KEY STRATERGIES
    TABLE 112. FLIR SYSTEMS, INC.: KEY EXECUTIVES
    TABLE 113. FLIR SYSTEMS, INC.: COMPANY SNAPSHOT
    TABLE 114. FLIR SYSTEMS, INC.: PRODUCT SEGMENTS
    TABLE 115. FLIR SYSTEMS, INC.: PRODUCT PORTFOLIO
    TABLE 116. FLIR SYSTEMS, INC.: KEY STRATERGIES
    TABLE 117. ROHDE & SCHWARZ GMBH & CO KG: KEY EXECUTIVES
    TABLE 118. ROHDE & SCHWARZ GMBH & CO KG: COMPANY SNAPSHOT
    TABLE 119. ROHDE & SCHWARZ GMBH & CO KG: PRODUCT SEGMENTS
    TABLE 120. ROHDE & SCHWARZ GMBH & CO KG: PRODUCT PORTFOLIO
    TABLE 121. SANWA ELECTRIC INSTRUMENT CO., LTD.: KEY EXECUTIVES
    TABLE 122. SANWA ELECTRIC INSTRUMENT CO., LTD.: COMPANY SNAPSHOT
    TABLE 123. SANWA ELECTRIC INSTRUMENT CO., LTD.: PRODUCT SEGMENTS
    TABLE 124. SANWA ELECTRIC INSTRUMENT CO., LTD.: PRODUCT PORTFOLIO
    TABLE 125. SANWA ELECTRIC INSTRUMENT CO., LTD.: KEY STRATERGIES
    TABLE 126. HIOKI E.E. CORPORATION: KEY EXECUTIVES
    TABLE 127. HIOKI E.E. CORPORATION: COMPANY SNAPSHOT
    TABLE 128. HIOKI E.E. CORPORATION: SERVICE SEGMENTS
    TABLE 129. HIOKI E.E. CORPORATION: PRODUCT PORTFOLIO
    TABLE 130. HIOKI E.E. CORPORATION: KEY STRATERGIES
  • LIST OF FIGURES

  • FIGURE 01. DIGITAL MULTIMETER MARKET, 2021-2031
    FIGURE 02. SEGMENTATION OF DIGITAL MULTIMETER MARKET, 2021-2031
    FIGURE 03. TOP INVESTMENT POCKETS IN DIGITAL MULTIMETER MARKET (2022-2031)
    FIGURE 04. MODERATE-TO-HIGH BARGAINING POWER OF SUPPLIERS
    FIGURE 05. MODERATE-TO-HIGH BARGAINING POWER OF BUYERS
    FIGURE 06. MODERATE-TO-HIGH THREAT OF SUBSTITUTES
    FIGURE 07. LOW-TO-MODERATE THREAT OF NEW ENTRANTS
    FIGURE 08. MODERATE-TO-HIGH INTENSITY OF RIVALRY
    FIGURE 09. DRIVERS, RESTRAINTS AND OPPORTUNITIES: GLOBALDIGITAL MULTIMETER MARKET
    FIGURE 10. DIGITAL MULTIMETER MARKET, BY PRODUCT TYPE, 2021(%)
    FIGURE 11. COMPARATIVE SHARE ANALYSIS OF DIGITAL MULTIMETER MARKET FOR HANDHELD, BY COUNTRY 2021-2031(%)
    FIGURE 12. COMPARATIVE SHARE ANALYSIS OF DIGITAL MULTIMETER MARKET FOR DESKTOP, BY COUNTRY 2021-2031(%)
    FIGURE 13. COMPARATIVE SHARE ANALYSIS OF DIGITAL MULTIMETER MARKET FOR MOUNTED, BY COUNTRY 2021-2031(%)
    FIGURE 14. DIGITAL MULTIMETER MARKET, BY RANGING TYPE, 2021(%)
    FIGURE 15. COMPARATIVE SHARE ANALYSIS OF DIGITAL MULTIMETER MARKET FOR AUTO-RANGING, BY COUNTRY 2021-2031(%)
    FIGURE 16. COMPARATIVE SHARE ANALYSIS OF DIGITAL MULTIMETER MARKET FOR MANUAL, BY COUNTRY 2021-2031(%)
    FIGURE 17. DIGITAL MULTIMETER MARKET, BY INDUSTRY VERTICAL, 2021(%)
    FIGURE 18. COMPARATIVE SHARE ANALYSIS OF DIGITAL MULTIMETER MARKET FOR CONSUMER ELECTRONICS, BY COUNTRY 2021-2031(%)
    FIGURE 19. COMPARATIVE SHARE ANALYSIS OF DIGITAL MULTIMETER MARKET FOR AUTOMOTIVE, BY COUNTRY 2021-2031(%)
    FIGURE 20. COMPARATIVE SHARE ANALYSIS OF DIGITAL MULTIMETER MARKET FOR POWER GENERATION, BY COUNTRY 2021-2031(%)
    FIGURE 21. COMPARATIVE SHARE ANALYSIS OF DIGITAL MULTIMETER MARKET FOR HEALTHCARE, BY COUNTRY 2021-2031(%)
    FIGURE 22. COMPARATIVE SHARE ANALYSIS OF DIGITAL MULTIMETER MARKET FOR OTHERS, BY COUNTRY 2021-2031(%)
    FIGURE 23. DIGITAL MULTIMETER MARKET BY REGION, 2021
    FIGURE 24. U.S. DIGITAL MULTIMETER MARKET, 2021-2031 ($MILLION)
    FIGURE 25. CANADA DIGITAL MULTIMETER MARKET, 2021-2031 ($MILLION)
    FIGURE 26. MEXICO DIGITAL MULTIMETER MARKET, 2021-2031 ($MILLION)
    FIGURE 27. UK DIGITAL MULTIMETER MARKET, 2021-2031 ($MILLION)
    FIGURE 28. GERMANY DIGITAL MULTIMETER MARKET, 2021-2031 ($MILLION)
    FIGURE 29. FRANCE DIGITAL MULTIMETER MARKET, 2021-2031 ($MILLION)
    FIGURE 30. ITALY DIGITAL MULTIMETER MARKET, 2021-2031 ($MILLION)
    FIGURE 31. SPAIN DIGITAL MULTIMETER MARKET, 2021-2031 ($MILLION)
    FIGURE 32. REST OF EUROPE DIGITAL MULTIMETER MARKET, 2021-2031 ($MILLION)
    FIGURE 33. CHINA DIGITAL MULTIMETER MARKET, 2021-2031 ($MILLION)
    FIGURE 34. JAPAN DIGITAL MULTIMETER MARKET, 2021-2031 ($MILLION)
    FIGURE 35. INDIA DIGITAL MULTIMETER MARKET, 2021-2031 ($MILLION)
    FIGURE 36. SOUTH KOREA DIGITAL MULTIMETER MARKET, 2021-2031 ($MILLION)
    FIGURE 37. REST OF ASIA-PACIFIC DIGITAL MULTIMETER MARKET, 2021-2031 ($MILLION)
    FIGURE 38. LATIN AMERICA DIGITAL MULTIMETER MARKET, 2021-2031 ($MILLION)
    FIGURE 39. MIDDLE EAST DIGITAL MULTIMETER MARKET, 2021-2031 ($MILLION)
    FIGURE 40. AFRICA DIGITAL MULTIMETER MARKET, 2021-2031 ($MILLION)
    FIGURE 41. TOP WINNING STRATEGIES, BY YEAR
    FIGURE 42. TOP WINNING STRATEGIES, BY DEVELOPMENT
    FIGURE 43. TOP WINNING STRATEGIES, BY COMPANY
    FIGURE 44. PRODUCT MAPPING OF TOP 10 PLAYERS
    FIGURE 45. COMPETITIVE DASHBOARD
    FIGURE 46. COMPETITIVE HEATMAP: DIGITAL MULTIMETER MARKET
    FIGURE 47. TOP PLAYER POSITIONING, 2021
    FIGURE 48. KEYSIGHT TECHNOLOGIES: NET REVENUE, 2019-2021 ($MILLION)
    FIGURE 49. KEYSIGHT TECHNOLOGIES: RESEARCH & DEVELOPMENT EXPENDITURE, 2019-2021
    FIGURE 50. KEYSIGHT TECHNOLOGIES: REVENUE SHARE BY SEGMENT, 2021 (%)
    FIGURE 51. KEYSIGHT TECHNOLOGIES: REVENUE SHARE BY REGION, 2021 (%)
    FIGURE 52. NATIONAL INSTRUMENTS CORPORATION: NET REVENUE, 2019-2021 ($MILLION)
    FIGURE 53. NATIONAL INSTRUMENTS CORPORATION: RESEARCH & DEVELOPMENT EXPENDITURE, 2019-2021 ($MILLION)
    FIGURE 54. NATIONAL INSTRUMENTS CORPORATION: REVENUE SHARE BY REGION, 2021 (%)
    FIGURE 55. YOKOGAWA ELECTRIC CORPORATION: NET REVENUE, 2019-2021 ($MILLION)
    FIGURE 56. YOKOGAWA ELECTRIC CORPORATION: RESEARCH & DEVELOPMENT EXPENDITURE, 2019-2021
    FIGURE 57. YOKOGAWA ELECTRIC CORPORATION: REVENUE SHARE BY SEGMENT, 2021 (%)
    FIGURE 58. YOKOGAWA ELECTRIC CORPORATION: REVENUE SHARE BY REGION, 2021 (%)
    FIGURE 59. FLIR SYSTEMS, INC.: NET REVENUE, 2019-2021 ($MILLION)
    FIGURE 60. FLIR SYSTEMS, INC.: RESEARCH & DEVELOPMENT EXPENDITURE, 2019-2021 ($MILLION)
    FIGURE 61. FLIR SYSTEMS, INC.: REVENUE SHARE BY SEGMENT, 2021 (%)
    FIGURE 62. FLIR SYSTEMS, INC.: REVENUE SHARE BY REGION, 2021 (%)
    FIGURE 63. HIOKI E.E. CORPORATION: NET REVENUE, 2019-2021 ($MILLION)
    FIGURE 64. HIOKI E.E. CORPORATION: RESEARCH & DEVELOPMENT EXPENDITURE, 2019-2021 ($MILLION)


Digital multimeters have provided consistent sales in the market for a very long time and this is expected to continue in the foreseeable future as well. The demand is expected to be driven by several factors such as the versatility of the device, its availability in various forms such as handheld, mounted, auto-ranging and manual, and its rapidly increasing usage in several industries on account-of their ongoing transformation driven by technological adoption.

Adoption of technology by industries and governments for all sections of supply-chain, ranging from manufacturing to transportation and delivery of public services is expected to have the largest impact on the global digital multimeter market in the coming years. For instance, Industry 4.0 now seems to be in full swing, since its start in 2011. Start-ups are now receiving around $3 billion in funding each year, M&A activity has doubled, and more than 50,000 research papers were written on the subject in 2021 itself. Furthermore, this has happened on the back of powerful electrical and electronic equipment such as powerful chipsets, widespread cloud services adoption, open interfaces for edge-computing hardware, better communication standards and protocols, and highly relevant AI models. The global COVID-19 pandemic only helped further the trend towards Industry 4.0 and the progress in Internet of Things (IoT) has also encouraged further adoption. These trends are only expected to continue in the forthcoming years, on the back of widespread competition between countries as well as companies on the technological front, as the adoption of technologies is expected to drive efficiencies, productivity and profits.

Demand for digital multimeters is expected to be driven by these developments as not only is the adoption of this technology important, but also its proper testing, maintenance and repair. According to a report by the National Association of Software and Services Companies (NASSCOM) and Capgemini, global investments in Industry 4.0 have approximately 10X in the past decade and will reach $200+ billion by 2025. Such large investments in technology will also involve investments in their testing, maintenance and repair, and this aspect is expected to prove highly beneficial to the global digital multimeter market.

PURCHASE OPTIONS

Call or Email us

U.S.-Canada Toll-free: +1-800-792-5285
Int'l : +1-503-894-6022
Europe : +44-845-528-1300
Email : help@alliedmarketresearch.com
 
FREQUENTLY ASKED QUESTIONS?

A. The estimated market size of digital multimeter market in 2021 was $617.54 million and it is expected to reach $1,186.94 million by 2031 at a CAGR of 6.7%.

A. The handheld type of digital multimeter isd the leading type in the market.

A. Consumer electronics is the leading industry vertical of the digital multimeter market

A. Asia-Pacific is the largest regional market of the digital multimeter market

A. The top companies to hold a share in the digital multimeter market are Keysight Technologies, Gossen Metrawatt GmbH, National Instruments Corporation, Tektronix, Inc., Yokogawa Electric Corporation, Fluke Corporation, FLIR Systems, Inc., Rohde & Schwarz GmbH & Co KG, Sanwa Electric Instrument Co., Ltd., and Hioki E.E. Corporation

Looking for Customization?

 Customization Request

Have a Question?

 Speak with Analyst

Any Confusion?

 Inquire Before Buying

Have a glance of the Report

  Request Sample
RELATED TAGS

Purchase Full Report of
Digital Multimeter Market

Start reading instantly.
This Report and over 68,418+ more Reports, Available with Avenue Library. T&C*.

  • Online Only
  • $3,570
  • Online cloud access only
  • Restricted print, copy, paste & download
  • Read only
  • Free industry update
    (Within 180 days)
  • Free report update in next update cycle
    (Feb 2024 - Feb 2025)
  • Data Pack
  • $3,840
  • Restricted to one authorized user
  • One print only
  • Available in
    Excel
  • Free industry update
    (Within 180 days)
  •   Free report update in next update cycle
    (Feb 2024 - Feb 2025)
  • Single User
  • $5,730
  • Restricted to one authorized user
  • One print only
  • Available in
    PDF
  • Free industry update
    (Within 180 days)
  •   Free report update in next update cycle
    (Feb 2024 - Feb 2025)
  • Five Users
  • $6,450
  • Limited to five authorized users
  • Print upto five copies
  • Available in
    PDF
  • Free industry update
    (Within 180 days)
  •   Free report update in next update cycle
    (Feb 2024 - Feb 2025)
  • Enterprise
    License/PDF

  • $9,600
  • Unlimited
    within
    company/enterprise
  • Available in Excel & PDF
  • Free industry update
    (Within 180 days)
  •   Free report update in next update cycle
    (Feb 2024 - Feb 2025)
  • Library
    Membership

  • $999 $ 1,175
    Per User/ Per month/ Billed annually
  • Published Content
    E-access
  • Company Profiles
    E-access
  • Newly Added Content Access
  • 10 PDF
    Downloads
  • 5 Excel Data
    Pack Downloads
  • 250 Company Profiles PDF Downloads
  • Buy Now

*Taxes/Fees, if applicable will be added during checkout. All prices in USD

RELATED REPORTS
 

Why Allied Market Research?


Infallible Methodology

To ensure high-level data integrity, accurate analysis, and impeccable forecasts

Analyst Support

For complete satisfaction

Customization

On-demand customization of scope of the report to exactly meet your needs

TARGETED MARKET VIEW

Targeted market view to provide pertinent information and save time of readers

Get fresh content delivered

Get insights on topics that are crucial for your business. Stay abreast of your interest areas.

Get Industry Data Alerts

Why Allied Market Research?

Infallible Methodology

To ensure high-level data integrity, accurate analysis, and impeccable forecasts

Analyst Support

For complete satisfaction

Customization

On-demand customization of scope of the report to exactly meet your needs

TARGETED MARKET VIEW

Targeted market view to provide pertinent information and save time of readers