
Driving Simulator Market Overview
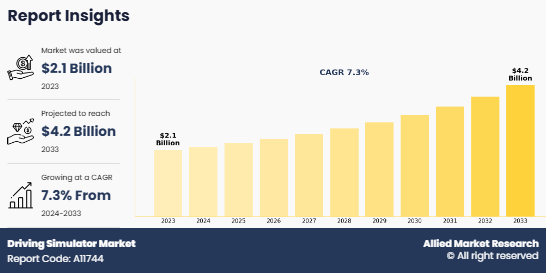
The global Driving Simulator Market size was valued at USD 2.1 billion in 2023, and is projected to reach USD 4.2 billion by 2033, growing at a CAGR of 7.3% from 2024 to 2033. Rising demand for autonomous vehicle testing and validation fuels the growth of the driving simulator market. Simulators offer safe, controlled, and repeatable testing environments.
Key Market Trends & Insights
- Car Simulator segment dominated the Driving Simulator Market in 2023 and is expected to maintain its lead.
- Training segment led the market in 2023 and will likely remain dominant.
- Less Than $500k budget segment dominated in 2023 and is projected to sustain growth.
- Automotive Industry segment held the largest share in 2023 and is set to continue dominance.
- Simulators without Motion Platform led the market in 2023 and are expected to remain dominant.
- Screen-Based Displays segment dominated in 2023 and is likely to sustain leadership.
- Asia-Pacific region held the largest market share in 2023 and is projected to maintain its dominance.
Market Size & Forecast
- 2033 Projected Market Size: USD 4.2 billion
- 2023 Market Size: USD 2.1 billion
- Compound Annual Growth Rate (CAGR) (2024-2033): 7.3%
Introduction
Autonomous vehicles must undergo rigorous testing and validation before they can be deployed on public roads. Safety is a paramount concern, and driving simulators offer a controlled and repeatable environment to evaluate the performance of self-driving systems. These simulators can recreate various real-world scenarios, including hazardous conditions, to ensure that the autonomous vehicle responds appropriately and safely.
Driving simulators play a crucial role in the early stages of autonomous vehicle development when physical prototypes may not be available. They allow researchers and engineers to experiment with various sensor configurations, control algorithms, and software components in a safe and virtual environment.
Market Dynamics
Autonomous vehicle simulation provider presented its advanced simulator at the major tech event. For instance, in June 2022, MORAI, a prominent developer of full-stack autonomous vehicle simulation technology in Korea, showcased an innovative product, MORAI SIM Drive, at CommunicAsia 2022. This advanced simulator accurately replicates the driving experience of autonomous vehicles and offers realistic virtual environments, sensor simulations, and vehicle models identical to the real world. Utilizing high-definition maps and a powerful 3D graphic engine (Unity), MORAI SIM Drive automates the creation of virtual environments, providing an immersive and authentic network representation for thorough validation of autonomous vehicles. Moreover, researchers working on autonomous vehicle simulation have launched advanced driving simulation solutions. For instance, in June 2022, MIT scientists introduced the first open-source simulation engine that may create lifelike environments for training and testing autonomous vehicles. This breakthrough technology allows for the development of realistic virtual scenarios to enhance the training and validation of self-driving cars.
Hence, surge in demand for autonomous vehicles coupled with increased focus on development and testing through driving simulators propel the growth of the driving simulator market.
Despite the advancements in driving simulator technology, they may not fully replicate the complexities and subtleties of real-world driving. While driving simulators provide a controlled and safe environment for learners to practice various scenarios, they cannot completely emulate the unpredictability and dynamic nature of actual road conditions.
For example, driving simulators might not capture the nuanced interactions with other drivers, pedestrians, or animals on the road, which are common in real-life driving. Weather conditions, road construction, and unexpected hazards may also be challenging to replicate realistically in a virtual environment. As a result, learners might not experience the same level of stress, pressure, and decision-making challenges that they would encounter on real roads.
This limitation raises questions about the transferability of skills learned in a driving simulator to real-life driving situations. While simulators can improve basic driving skills and decision-making, they might not fully prepare learners for every real-world driving scenario they could encounter.
To address this restraint, driving simulator developers continually strive to enhance the realism of simulations and incorporate more dynamic elements into the training scenarios. The integration of AI and IoT technologies, as well as the use of real-world data for scenario creation, aims to bridge the gap between virtual and real-world driving experiences.
VR and AR technologies enhance the driving simulator experience, making it more immersive, engaging, and effective. VR and AR technologies provide a highly immersive experience for users, making them feel like they are in a realistic driving environment. By wearing VR headsets or using AR overlays, learners can have a 360- degree view of the virtual driving scenarios, complete with lifelike visuals and audio. This heightened sense of immersion improves the effectiveness of driver training, as learners can experience real-world driving situations more realistically.
In addition, VR and AR allow driving simulators to replicate complex driving scenarios with incredible accuracy. For instance, learners can practice driving on challenging terrains, adverse weather conditions, or busy city streets, all in a safe virtual environment. The ability to create realistic scenarios enhances the training experience and better prepares drivers for real-world challenges.
Moreover, used cars are used as driving simulators by startups through AR and VR. For instance, in July 2022, Viennese startup Nekonata XR Technologies (NXRT) developed mixed reality simulators called "XQ Avatar" that may transform any vehicle into an immersive driving simulator. By merging virtual reality with the real environment, users can have an immersive driving experience. The system is versatile and may be used in any vehicle, making it convenient for virtual test drives in car dealerships. Thus, VR and AR technologies make driving simulators more immersive and effective, replicating realistic driving scenarios and offering virtual test drives in car dealerships which presents lucrative opportunity in driving simulator market.
Market Segmentation
The driving simulator market is segmented into simulator type, application, vehicle type, motion platform, display solution, budget, end user and region. By Application Type: Training, Automotive Testing, Entertainment. By Vehicle Type: Car Simulator, Truck and Bus Simulator, Driver-in-the-Loop Simulators, Others. By Simulator Type: Training Simulator, Advanced Driving Simulator, Full-Motion Simulators, Static Simulators. By Motion Platform: Simulators with Motion Platform, Simulators without Motion Platform. By Display Solution: Screen-Based Displays, Projector-Based Displays. By Budget: Less Than $500k, $500k to $1.5 Mn, More Than $1.5 Mn. By End User: Automotive Industry, Aerospace Industry, Defense and Public Security, Academic and Research Institutions, Commercial Training Centers, Entertainment and Gaming. Based on the region, the market is categorized into North America, Europe, Asia-Pacific and LAMEA.
Vehicle Type

Based on type, the Car Simulator segment had the dominating Driving Simulator Market Share in the year 2023 and is likely to remain dominant during the forecast period. The dominance of the car simulator segment is attributed to its widespread application in driver training, vehicle testing, and motorsport simulation. Car simulators offer realistic environments for safe and cost-effective training, reducing the risk of accidents during practice. Automotive manufacturers also use simulators extensively for testing vehicle dynamics, improving design efficiency, and reducing development costs. Additionally, the growing interest in virtual motorsports and e-racing has further fueled Driving Simulator Market Demand for car simulators. Continuous advancements in immersive technologies like VR and AI are expected to strengthen the segment’s position in the market.
By Applicaton

Based on applications, the training segment dominated the global market in the year 2023 and is likely to remain dominant during the Driving Simulator Market Forecast period. The training segment’s dominance stems from the increasing need for safe, efficient, and controlled environments to train drivers across various vehicle categories, including commercial, passenger, and military vehicles. Driving simulators provide a cost-effective way to improve skill levels, simulate real-world scenarios, and enhance road safety without physical risks. Regulatory mandates for professional driver training in sectors like logistics and defense have further propelled the adoption of simulators. The growing integration of AI and machine learning for personalized training experiences is also boosting the segment’s Driving Simulator Market Growth prospects.
By Budget

Based on budget, the Less Than $500k segment dominated the global market in the year 2023 and is likely to remain dominant during the forecast period. Simulators priced under $500k are highly preferred due to their affordability and accessibility for small to medium-sized enterprises and training centers. These systems provide essential functionalities, making them ideal for driving schools, vocational training programs, and educational institutions. The rapid expansion of budget-conscious markets in emerging economies has further driven demand in this segment. Additionally, technological advancements have enabled manufacturers to offer high-quality simulation systems at reduced costs, ensuring broader adoption across industries without compromising on essential features.
By End User

Based on end user, the Automotive Industry segment dominated the global market in the year 2023 and is likely to remain dominant during the forecast period. The automotive industry’s reliance on simulators for R&D, vehicle testing, and safety assessments has driven its market dominance. Simulators enable manufacturers to test new vehicle designs, autonomous driving systems, and safety features under controlled conditions, reducing development time and costs. With the shift toward electric and autonomous vehicles, simulators play a crucial role in testing battery performance, sensor integration, and AI algorithms. Furthermore, the industry benefits from simulators’ ability to simulate diverse terrains and driving scenarios, facilitating global product testing without the need for extensive physical trials.
By Motion Platforms

Based on motion platforms, the Simulators without Motion Platform segment dominated the global market in the year 2023 and is likely to remain dominant during the forecast period. Simulators without motion platforms are favored due to their affordability, ease of installation, and lower maintenance costs compared to motion-based systems. These simulators are widely used in driver training, where realistic visuals and responsive controls suffice to create effective learning environments. Their compact design and lower energy consumption make them ideal for small training centers and academic institutions. The increasing adoption of virtual reality (VR) and augmented reality (AR) technologies in these simulators enhances their realism and training effectiveness, further solidifying their market dominance.
By Display Solutions

Based on display solutions, the Screen-Based Displays segment dominated the global market in the year 2023 and is likely to remain dominant during the forecast period. Screen-based displays remain dominant due to their cost-effectiveness, accessibility, and ability to deliver realistic visual simulations. These systems are widely used across applications like driver training, vehicle testing, and gaming, offering immersive experiences with minimal setup requirements. Advancements in display technologies, such as high-definition and ultra-wide screens, enhance the realism of driving environments. Their compatibility with a wide range of software and peripherals makes them a versatile choice for various industries. Furthermore, the rising demand for portable and easy-to-operate simulators has significantly contributed to the growth of this segment.
By Region

Based on the region, the Asia-Pacific region dominated the global market in the year 2023 and is likely to remain dominant during the forecast period. The Asia-Pacific region’s dominance is driven by rapid urbanization, increasing vehicle ownership, and growing investments in road safety initiatives. Countries like China, India, and Japan are witnessing high demand for driving simulators in training schools, automotive R&D, and defense sectors. The expansion of local automotive manufacturing hubs and government regulations mandating professional driver training further boost the market. Additionally, the region’s technological advancements, such as VR integration and AI-powered simulators, enhance product capabilities. The large population base and rising disposable incomes create a strong demand for cost-effective simulation solutions.
Which are the Top Driving Simulator companies
The following are the leading companies in the market. These players have adopted various strategies to increase their market penetration and strengthen their position in the driving simulator industry.
- Cruden
- Tecknotrove
- Hottinger Brel & Kjær (HBK)
- AVSimulation
- CXC Simulations
- Thales
- Arotech Corporation
- Exail Technologies (former GROUPE GORGE)
- Moog Inc.
- AB Dynamics PLC
Key Benefits for Stakeholders
- This report provides a quantitative analysis of the market segments, current trends, estimations, and dynamics of the driving simulator market analysis from 2023 to 2033 to identify the prevailing Driving Simulator Market Opportunity.
- The market research is offered along with information related to key drivers, restraints, and opportunities.
- Porter's five forces analysis highlights the potency of buyers and suppliers to enable stakeholders make profit-oriented business decisions and strengthen their supplier-buyer network.
- In-depth analysis of the driving simulator market segmentation assists to determine the prevailing Driving Simulator Industry opportunities.
- Major countries in each region are mapped according to their revenue contribution to the global market.
- Market player positioning facilitates benchmarking and provides a clear understanding of the present position of the market players.
- The report includes the analysis of the regional as well as global driving simulator market trends, key players, market segments, application areas, and market growth strategies.
Driving Simulator Market Report Highlights
| Aspects | Details |
| Market Size By 2033 | USD 4.2 billion |
| Growth Rate | CAGR of 7.3% |
| Forecast period | 2023 - 2033 |
| Report Pages | 300 |
| By Vehicle Type |
|
| By Application |
|
| By Simulator Type |
|
| By Budget |
|
| By End user |
|
| By Motion platform |
|
| By Display solution |
|
| By Region |
|
| Key Market Players | Hottinger Brel & Kjr, Arotech Corporation, Rheinmetall AG, CKAS Mechatronics Pty Ltd, KaTron A.S., Exail Technologies, AB Dynamics PLC, L3Harris Technologies, Inc., Cruden BV, AVSimulation, Elbit Systems Ltd., Moog Inc., Applied Intuition, Inc., CREATIVEX CONSULTING PTE LTD., Lander Simulation & Training Solutions, CXC SIMULATIONS, HAVELSAN Inc., Indra Sistemas, Thales, OKTAL SYDAC, Tecknotrove |
Analyst Review
According to the insights of the CXOs of leading companies, the driving simulator in the automotive market is expected to witness remarkable growth in the future owing to a more cost-effective training alternative than the old technique.
Driving simulators are revolutionizing the driver training and automotive industry, and CXOs are increasingly recognizing their potential to drive innovation, improve operational efficiency, and enhance customer experiences. Moreover, driving simulators offer automakers the ability to optimize the product development process. By leveraging real-time data captured from physical assets, companies may analyze and simulate various scenarios, leading to improved design iterations, enhanced vehicle performance, and reduced development time.
Further, Driver-in-the-Loop (DIL) simulators bridge the gap between offline simulations and real-world evaluations. These simulators enable a live individual to actively participate and "close the loop" in what would typically be an offline vehicle simulation. In essence, a DIL simulator establishes a direct link between a human driver and a simulated vehicle encounter, enhancing the authenticity of the experience.
The purpose of DIL simulation is to create an accessible platform where real individuals and potentially AI systems can engage with virtual vehicles within virtual environments. Automakers utilize DIL simulation both prior to constructing physical prototypes and alongside prototype testing, serving as a streamlined approach to accumulate extensive testing scenarios. As John Wilkinson, Lead Performance Engineer at General Motors, elucidates, DIL simulation offers an efficient method to cycle individuals through numerous iterations of virtual prototypes, providing an immersive experience that mirrors real car dynamics.
Thus, CXOs predict significant growth in the driving simulator market due to cost-effective training. Digital twins optimize product development, while DIL simulators bridge offline and real-world testing for an immersive experience.
The global driving simulator market was valued at $2,113.6 million in 2023, and is projected to reach $4,177.0 million by 2033, registering a CAGR of 7.3% from 2024 to 2033.
From 2024-2033 would be forecast period in the market report.
$2,113.6 million is the market value of Driving Simulator Market in 2022. The market is studied across North America, Europe, Asia-Pacific, and LAMEA.
2023 is base year calculated in the Driving Simulator Market report. The leading companies adopt strategies such as product launch, partnership, acquisition, expansion, and collaboration to strengthen their market position.
Cruden, Tecknotrove, Hottinger Brel & Kjær (HBK), AVSimulation, CXC Simulations, Thales, Arotech Corporation, Exail Technologies (former GROUPE GORGE), Moog Inc., and AB Dynamics PLC are the top companies hold the market share in Driving Simulator Market.
Loading Table Of Content...
Loading Research Methodology...

