
Drug Discovery Informatics Market Research, 2032
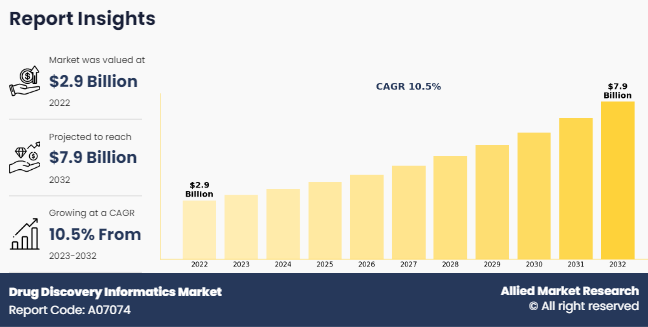
The global drug discovery informatics market size was valued at $2.9 billion in 2022, and is projected to reach $7.9 billion by 2032, growing at a CAGR of 10.5% from 2023 to 2032. Major factors driving the growth of the market are increased research spending on informatics by biotechnology and pharmaceutical companies coupled with the growing demand and support for rare disease and orphan drug research. For instance, according to National Center for Science and Engineering Statistics in 2022, the research and development spending by academic institutions totaled $97.8 billion in FY 2022, an increase of $8.0 billion from FY 2021. Such an increase in research spending highlights the demand and pace at which the market is growing.
Drug discovery is a process which requires a huge amount of information. Drug discovery informatics includes databases of various molecules and drugs which are used by various pharmaceutical companies to perform their research. Various software are used to manage and filter the databases. Drug discovery informatics makes use of IT platforms, vital information and other processes to improve and rise over challenges. This sector used modern improvised technology like data storage, processing the data, managing and analyzing it.
Key Takeaways
- By application, the drug discovery segment dominated the global market in 2022.
- By function, the sequencing and target data analysis segment acquired a major share in the global market in 2022.
- By end use, the pharmaceutical companies segment acquired a major share in the global market in 2022.
- By region, North America dominated the market in terms of revenue in 2022.
Market Dynamics
The market is primarily driven by an increase in focus in drug discovery by utilizing informatics software and the advancements in high performance computing and web services. Additionally, the increasing adoption of in silico modelling tools and rising demand for innovative drug molecules will further drive the market growth.
However, high costs associated with the informatics software might restrain the market growth. Further, the growth in biotechnology and biologics industry especially in emerging markets will create many lucrative opportunities in the market.
The market's expansion is further propelled by the introduction of advanced information technology solutions in drug discovery, intensifying competition among industry participants. For instance, Certara, Inc. unveiled the Simcyp Physiologically based Pharmacokinetic (PBPK) Simulator version 20, which offers new models for assessing drug action during pregnancy and lactation. This aids in making critical decisions concerning optimizing medicine safety and efficacy profiles.
Moreover, there is a growing inclination among companies to embrace informatics solutions to streamline and expedite the drug discovery process. Curve Therapeutics Ltd. implemented the CDD Vault platform to manage its genetically encoded Microcycle platform. This hosted platform provides secure data management and facilitates seamless real-time data sharing, fostering collaborative discoveries across the pharmaceutical, biotechnology, and academic sectors.
The ongoing global endeavors in COVID-19 drug discovery have also contributed to the market's expansion. Scientists have utilized in silico tools and virtual screening techniques to identify potential drug candidates targeting viral proteins and human ACE2 receptors. Additionally, companies are developing web services and solutions tailored specifically for various stages of drug development related to COVID-19. For example, the IBM Visual Molecular Explorer platform has been employed to explore a curated set of molecules targeting the SARS-CoV-2 virus, enabling the sharing of AI-generated artifacts, and aiding in the design of optimal medicines.
Segments Overview
The drug discovery informatics market share is segmented into application, function, end user, and region. Based on application, the market is segmented into drug discovery and drug development. Based on function, the market is segmented into sequencing and target data analysis, library, and database preparation, docking, molecular modelling, and others. Based on end users, the market is segmented into biotechnology companies, pharmaceutical companies, contract research organizations, and other end users. Region wise, the drug discovery informatics market size is segmented into North America, Europe, Asia-Pacific, and LAMEA.
By Application
By application segment, the drug discovery dominated the drug discovery informatics market share in 2022 and is expected to continue this trend during the drug discovery informatics market forecast period. Drug discovery is growing significantly due to the increased research spending and the utilization of artificial intelligence in drug discovery processes. For instance, in 2022, Iktos, announced their collaboration with Teijin Pharma Limited to evolve Artificial Intelligence for small molecules drug discovery.

By Function
By function, the sequencing and target data analysis segment dominated the market in 2022 and is expected continue this trend during the forecast period. Bioinformatic solutions play a crucial role in building primary and secondary databases containing nucleic acids, proteins, and other biomolecule sequences. Informatics software is utilized to efficiently mine and store genome sequencing data, enabling the identification of genes and targeted proteins. This process greatly aids in the development of potential drugs.

By End User
By end use, the pharmaceutical companies segment dominated the market in 2022. Pharmaceutical companies are using informatics software extensively for pre-clinical research, target identification, compound screening and lead identification. Such increased usage for varied drug discovery applications will further drive the drug discovery informatics market growth.

By Region
By region, North America dominated the market in 2022 and is expected to continue this trend during the forecast period. This is due to the presence of well established CROs and rise in R&D expenditure by pharmaceutical and biopharmaceutical companies. However, Asia-Pacific is expected to grow with a faster CAGR during the analysis period. This is mainly due to the rapid growth rate in pharmaceutical and biologics industry coupled with the less stringent regulations for drug discovery process.

Competitive Analysis
Major players have adopted partnership and collaboration as their main strategy. For instance, in May 2023, Google Cloud announced two new AI powered life science solutions to accelerate drug discovery and precision medicine for pharmaceutical firms, biotechnology companies and public sector organizations.
Recent Developments in Drug Discovery Informatics Industry
- In January 2022, Discngine announced a strategic partnership with ChemAxon. This partnership will help both the companies streamline pharma and biotech research involving complex biomolecular structural data.
Key Benefits for Stakeholders
- This report provides a quantitative analysis of the market segments, current trends, estimations, and dynamics of the drug discovery informatics market analysis from 2022 to 2032 to identify the prevailing drug discovery informatics market opportunity.
- The market research is offered along with information related to key drivers, restraints, and opportunities.
- Porter's five forces analysis highlights the potency of buyers and suppliers to enable stakeholders make profit-oriented business decisions and strengthen their supplier-buyer network.
- In-depth analysis of the drug discovery informatics industry segmentation assists to determine the prevailing market opportunities.
- Major countries in each region are mapped according to their revenue contribution to the global market.
- Market player positioning facilitates benchmarking and provides a clear understanding of the present position of the market players.
- The report includes the analysis of the regional as well as global drug discovery informatics market trends, key players, market segments, application areas, and market growth strategies.
Drug Discovery Informatics Market Report Highlights
| Aspects | Details |
| Forecast period | 2022 - 2032 |
| Report Pages | 280 |
| By Application |
|
| By Function |
|
| By End User |
|
| By Region |
|
| Key Market Players | Certara, Inc., Thermo Fisher Scientific Inc., Accenture, Jubilant Pharmova, Oracle Corporation, Albany Molecular Research, Inc. |
Analyst Review
According to several interviews conducted, the drug discovery informatics market is expected to witness significant growth in the future, owing to the increase in prevalence of cancer & chronic diseases and surge in investments in R&D activities for drug discovery.
According to the perspectives of CXOs, the drug discovery informatics market is expected to witness steady growth in the future. The increasing prevalence rate of metabolic, genetic, & other chronic diseases and technological advancement in drug discovery are anticipated to fuel the market's growth. The surge in pharmaceutical companies' investments in private contract research organizations and academic research institutes to reduce the cost and time for the discovery of new drugs, rising healthcare expenditure, and technological advancement are the key factors driving the market's growth.
However, the high cost of drug discovery as well as high risk of failure is anticipated to hamper the growth of the market to some extent over the forecast period. On the contrary, emerging economies such as India, China, Mexico, and Brazil provide lucrative opportunities for the growth of the market, owing to the availability of low-cost skilled manpower and a large population in developing countries to conduct clinical trials for the development of novel drug therapies. As per CXOs, North America is expected to dominate the global drug discovery informatics market during the forecast period, followed by Europe.
Yes, competitive landscape is included in the Drug Discovery Informatics Market report
High cost of drug informatics software and its related set is the major restraint in the market
Key trends are the increased usage of informatics software to develop personalized medicine.
The drug discovery dominated the market in 2022 and is expected to continue this trend during the forecast period
North America dominated the market in 2022 and is expected to continue this trend during the forecast period.
The global drug discovery informatics market size was valued at $2.9 million in 2022 and is projected to reach $7.9 million by 2032, registering a CAGR of 10.5% from 2023 to 2032.
Carters, Charles River Laboratories, PerkinElmer and Dassault Systems are key companies to occupy major share in the market
Increased research spending coupled with the growing demand and support for rare disease and orphan disease
Loading Table Of Content...
Loading Research Methodology...

