0
2022
Electric Vehicle Power Inverter Market

Electric Vehicle Power Inverter Market

by Propulsion (Hybrid Vehicle, Plug in Hybrid Vehicle, Battery Electric Vehicle), by Inverter Type (Traction Inverter, Soft Switching Inverter), by Vehicle Type (Passenger Vehicle, Commercial Vehicle), by Level of Integration (Integrated Inverter System, Separate Inverter System, Mechatronic Integration System), by Distribution Channel (OEM, Aftermarket): Global Opportunity Analysis and Industry Forecast, 2021-2031

Report Code: A08757
Jul 2022 | Pages: 425
Tables: 250
Charts: 74
  • Formats*:

  • pdf

    Single User License, Five User
    License & Enterprise User License

  • xls

    Data Pack Excel License

  • ppt

    It comes with the additional cost
    of $2500.00 contact sales.


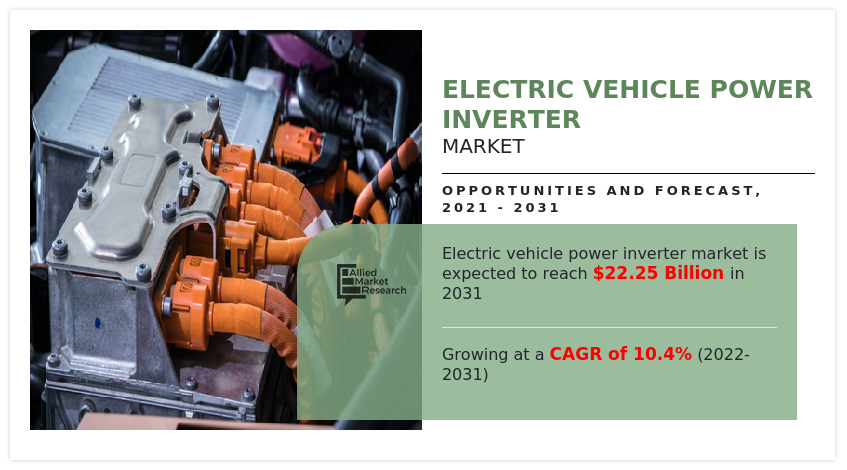
The global electric vehicle power inverter market was valued at $8.67 billion in 2021, and is projected to reach $22.25 billion by 2031, growing at a CAGR of 10.4% from 2022 to 2031.
The COVID-19 impact on automotive industry is unpredictable, and is expected to remain in force for a few years. The COVID-19 outbreak forced governments across the globe to implement stringent lockdown and ban import–export of essential raw material items for most of 2020, and few months in 2021. This led to sudden decline in availability of important raw materials for components. As a result of interrupted supply chains and production schedules caused by the COVID-19 pandemic, aviation production and sales suffered severely, which, in turn, negatively impacted the electric vehicle power inverter market in 2020. Moreover, COVID-19 outbreak has resulted in disruptions for automotive industry in terms of manufacturing. The majority of OEMs have shut down their production and other essential operations during the pandemic. For instance, global automotive light vehicle (LV) sales fell by 20% from 2019-2020. In addition, global EV sales decreased by 18% in 2020. However, with the pandemic situation easing out, the automotive manufacture connected work business is expected to recover rapidly. Moreover, on the global level, there is a rise in inclination toward the need for eco-friendly vehicles, which is expected to fuel the demand for efficient power inverter for electric vehicles

Electric Vehicle Power Inverter Market, Electric Vehicle Power Inverter Industry

The electric vehicle power inverter market is segmented into Propulsion, Inverter Type, Vehicle Type, Level of Integration and Distribution Channel.

An electric vehicle power inverter is a device that converts the Direct Current (DC) power used in an electric vehicle motor to Alternating Current (AC). Electric vehicle power inverter has wider application in electric vehicles. The converted current is further utilized by motors to operate compatible devices and sensors, which utilizes AC current for their operation. Moreover, in electric vehicles, the power can be utilized for plug-in outlets and other standard 120-volt devices.

Factors such as increase in demand for electric vehicles, proactive government initiatives for the development of electric vehicle, and surge in demand for low-emission & fuel-efficient vehicles are anticipated to boost the growth of the global electric vehicle power inverter market during the forecast timeframe. However, lack of sufficient infrastructure for electric vehicles and high manufacturing cost of electric vehicles are expected to hinder the growth of the global electric vehicle power inverter industry during the forecast period. Moreover, technological advancement in electric vehicles and rise in demand for solar powered electric vehicles are anticipated to create an opportunity for the electric vehicle power inverter market in near future.

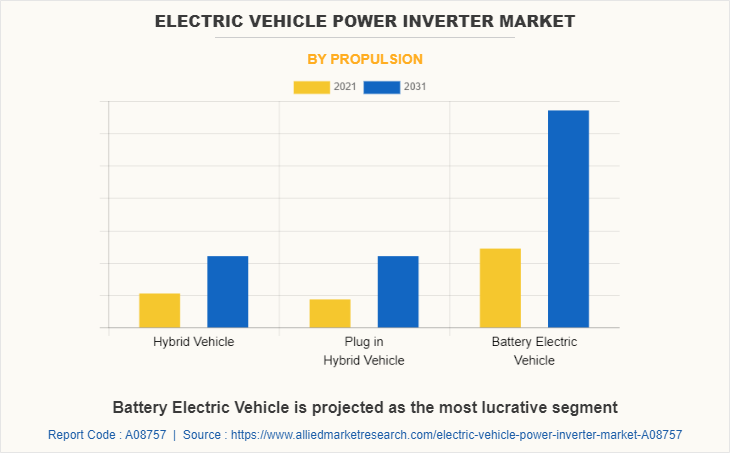
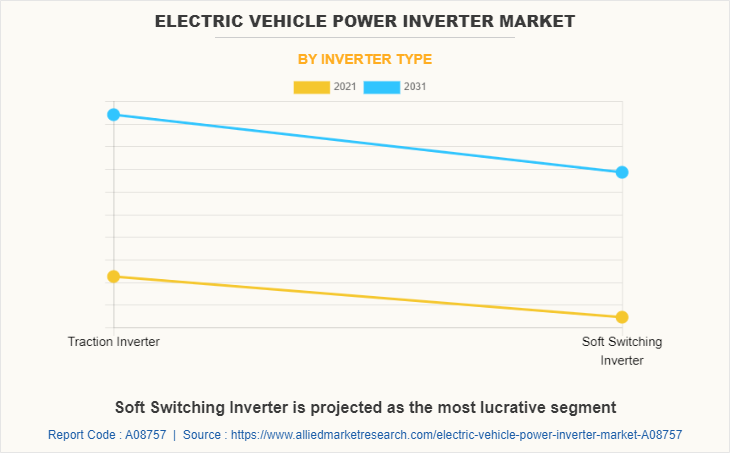
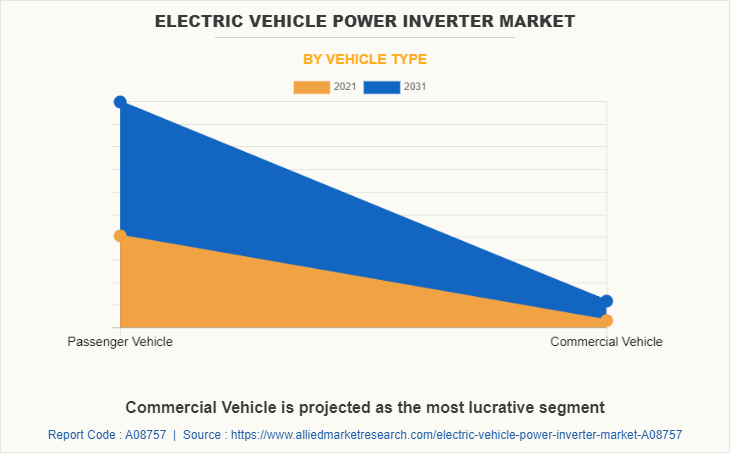
Electric vehicle power inverter market is segmented on the basis of propulsion, inverter type, vehicle type, level of integration, distribution channel, and region. By propulsion, it is divided into full hybrid vehicle, plug-in hybrid vehicle, and battery electric vehicle. By inverter type, it is fragmented into traction inverter, and soft switching inverter. By vehicle type, it is bifurcated into passenger cars and commercial vehicles. By level of integration, it is divided into integrated inverter system, separate inverter system, and mechatronic integration system. By distribution channel, the market is divided into OEM and Aftermarket.  By region, the market is analyzed across North America, Europe, Asia-Pacific, and LAMEA.
Electric Vehicle Power Inverter Market

The key players that operate in this electric vehicle power inverter market are Aptiv, BYD COMPAY LTD., Continental AG, CWB Automotive Electronics Co., Ltd., Denso Corporation, Hitachi Astemo, Ltd. (Subsidiary of Hitachi, Ltd.), Lear Corporation, Marelli Holdings Co., Ltd., Meidensha Corporation, Mitsubishi Electric Corporation, Nissan motors co., Ltd., Robert Bosch GmbH, Siemens, Sungchang, Toyota Industries Corporation, Valeo, and Vitesco Technologies.

Increase in demand for electric vehicles

Electric vehicles offer multiple advantages such as low operating cost compared to conventional gasoline engine, implementation of stringent government regulations to limit environment pollution, and decreased emissions from tailpipes, which significantly boost their demand across the globe. For instance, electric vehicle sales have increased, owing to growth in China, the U.S., and Europe. Sales of electric vehicles increased by 160% in the first half of 2021 from a year earlier, to 2.6 million units, representing 26% of new sales in the global automotive market. Further, this, in turn, is expected to escalate the need for electric vehicle power inverter for electric vehicles during the forecast period. In addition, key players operating in the electric vehicle power inverter market are adopting various strategic moves such as product development and product launch to tap the business potential. For instance, ABB Ltd. launched all-in-one electric vehicle charger, which provides the fastest charging experience in the market. The new electric vehicle charger is the world‐â„¢s fastest charger that can deliver 100 km of range in less than three minutes. Further, the new charger is designed explicitly to charge up to four vehicles at once. Therefore, factors such as increase in charging stations in public places & highways, low operating cost, and implementation of stringent government regulations to limit environment pollution are expected to spur electric vehicles across the globe.  The market for power inverter is directly related to the growth of automotive production and sales of electric vehicles as these vehicles are equipped with large circuits. Owing to this, the growth in electric vehicles market is expected to propel the market for electric vehicle power inverter industry during the forecast period. 
Electric Vehicle Power Inverter Market

Proactive government initiatives for the development of electric vehicle

The electric vehicles market has grown exponentially due to factors, such as climate change and efforts to achieve net zero emissions. Moreover, favorable incentives and policies introduced by governments of different countries to promote electric vehicles boost the growth of the EV industry. For instance, in 2021, in California, the Clean Vehicle Rebate Project (CVRP) promoted clean vehicle adoption in California by offering rebates ranging from $1,000 to $7,000 for purchases or leases of new zero-emission vehicle. Moreover, in 2021, New Zealand proposed clean car discount, in which new car buyers received $8,625 rebate for electric vehicles (EVs) less than $80,000, including GST and road costs. Rise in awareness of climate change and surge in demand for electric cars lead to increase in the production of electric vehicles. For instance, according to a report by the IEA organization, 2022, EV vehicles globally reached 6.7 million units in 2021, a 3.7 million units over 2020, accounting for 4.1% of the market share. In 2020, the electrical percentage of automobile income was about 2.4%, which increased from about 2% in 2019. Moreover, some countries announced policies banning and phasing out gasoline and diesel cars. Such measures taken by various governments encourage automakers and other market players to adopt the new electric vehicle trend. For instance, in 2022, Ford Motor plans to invest $20 billion in an effort to expand electrification of its lineup with an investment of 20 billion dollars. In addition, in 2021, China's tech giant, Xiaomi officially confirmed its plans to enter the smart electric vehicle business by investing RMB 10 billion (roughly $1.55 billion) in the first phase.  Such proactive government initiatives for the development of electric vehicles fuel the growth of electric vehicles, which further boost the electric vehicle power inverter market.
Electric Vehicle Power Inverter Market

Lack of sufficient infrastructure for electric vehicles

A robust EV charging infrastructure is necessary for the adoption of electric vehicles. Electric vehicles are yet to become mainstream despite their benefits from environmental and economic perspectives. Lack of electric vehicle charging stations limit the electric vehicle industry. For instance, according to a report by Grant Thornton-Bharat and the Federation of Indian Chambers of Commerce & Industry (FICCI), in June 2021, India was expected to require a four lakh public charging station to power an estimated total of 2 million electric vehicles on the road by 2026. As of December 2021, India currently has only 1,028 public electric vehicle charging stations. In addition, according to a report published by International Energy Agency (IEA) in 2021, the global electric vehicle fleet reached 10 million units in 2020, which increased by 43% from 2019, gaining 1% stake share. Battery electric vehicles (BEVs) covered two-thirds of new electric car registrations and two-thirds of the stock in 2020. Hence, unavailability of enough charging stations decreases the growth of electric vehicles, which makes it difficult for electric vehicle power inverter market to prosper. Thus, negatively impacting the electric vehicle production and acceptance, which in turn hampers the growth of the EV power inverter market. Therefore, such misalignment between charging demand and the allocation of infrastructure discourages the production of electric vehicles and further hinders the growth of the market.

Technological advancement in electric vehicles

Automobile companies focus on production of advanced electric vehicle systems that are expected to have lower particular emission at relatively lowers costs. Companies have started producing downsized engines to be implemented in vehicles as smaller engines help achieve the upcoming fuel emission norms such as Bharat Stage VI and Euro VI. This is owing to the fact that they produce lesser emissions as compared to heavier and larger engines. Compactness and cost-effectiveness of these downsized small engines add another dimension to their usefulness in order to improve the efficiency of the vehicle. Similarly, the companies operating in electric vehicle power inverter market are developing advanced integrated motor and inverter in order to reduced system complexity, faster system setup & construction, and increased motor driver compatibility. For instance, in April 2019, Dana launched the TM4 MOTIVE, an integrated motor and inverter for the light vehicle market. The TM4 MOTIVE includes a high-RPM permanent magnet electric motor, power-dense electronic inverter, and advanced controls. Such developments in the field of electric vehicles is expected to propel the market for vehicle inverters during the forecast period
Electric Vehicle Power Inverter Market

Key Benefits For Stakeholders

  • This report provides a quantitative analysis of the market segments, current trends, estimations, and dynamics of the electric vehicle power inverter market analysis from 2021 to 2031 to identify the prevailing electric vehicle power inverter market opportunities.
  • The market research is offered along with information related to key drivers, restraints, and opportunities.
  • Porter's five forces analysis highlights the potency of buyers and suppliers to enable stakeholders make profit-oriented business decisions and strengthen their supplier-buyer network.
  • In-depth analysis of the electric vehicle power inverter market segmentation assists to determine the prevailing market opportunities.
  • Major countries in each region are mapped according to their revenue contribution to the global market.
  • Market player positioning facilitates benchmarking and provides a clear understanding of the present position of the market players.
  • The report includes the analysis of the regional as well as global electric vehicle power inverter market trends, key players, market segments, application areas, and market growth strategies.

Electric Vehicle Power Inverter Market Report Highlights

Aspects Details
By Propulsion
  • Hybrid Vehicle
  • Plug in Hybrid Vehicle
  • Battery Electric Vehicle
By Inverter Type
  • Traction Inverter
  • Soft Switching Inverter
By Vehicle Type
  • Passenger Vehicle
  • Commercial Vehicle
By Level of Integration
  • Integrated Inverter System
  • Separate Inverter System
  • Mechatronic Integration System
By Distribution Channel
  • OEM
  • Aftermarket
By Region
  • North America  (U.S., Canada, Mexico)
  • Europe  (Germany, France, Russia, Netherlands, U.K., Poland, Spain, Rest of Europe)
  • Asia-Pacific  (China, India, Japan, South Korea, Asean, Rest of Asia-Pacific)
  • LAMEA  (Brazil, UAE, Saudi Arabia, South Africa, Rest of LAMEA)
Key Market Players CWB Automotive Electronics Co., Ltd., Valeo Group, Aptiv PLC, Sungchang Autotech Co., Ltd., Robert Bosch GmbH, Vitesco Technologies, Lear Corporation, Mitsubishi Electric Corporation, Meidensha Corporation, Siemens, Changsha BYD, DENSO Corporation, Hitachi Astemo Ltd, Nissan, Toyota Industries Corporation, Marelli Corporation, Continental
 
  • CHAPTER 1:INTRODUCTION

    • 1.1.Report description

    • 1.2.Key market segments

    • 1.3.Key benefits to the stakeholders

    • 1.4.Research Methodology

      • 1.4.1.Secondary research

      • 1.4.2.Primary research

      • 1.4.3.Analyst tools and models

  • CHAPTER 2:EXECUTIVE SUMMARY

    • 2.1.Key findings of the study

    • 2.2.CXO Perspective

  • CHAPTER 3:MARKET OVERVIEW

    • 3.1.Market definition and scope

    • 3.2.Key findings

      • 3.2.1.Top investment pockets

    • 3.3.Porter’s five forces analysis

    • 3.4.Top player positioning

    • 3.5.Market dynamics

      • 3.5.1.Drivers

      • 3.5.2.Restraints

      • 3.5.3.Opportunities

    • 3.6.COVID-19 Impact Analysis on the market

  • CHAPTER 4: ELECTRIC VEHICLE POWER INVERTER MARKET, BY PROPULSION

    • 4.1 Overview

      • 4.1.1 Market size and forecast

    • 4.2 Hybrid Vehicle

      • 4.2.1 Key market trends, growth factors and opportunities

      • 4.2.2 Market size and forecast, by region

      • 4.2.3 Market analysis by country

    • 4.3 Plug in Hybrid Vehicle

      • 4.3.1 Key market trends, growth factors and opportunities

      • 4.3.2 Market size and forecast, by region

      • 4.3.3 Market analysis by country

    • 4.4 Battery Electric Vehicle

      • 4.4.1 Key market trends, growth factors and opportunities

      • 4.4.2 Market size and forecast, by region

      • 4.4.3 Market analysis by country

  • CHAPTER 5: ELECTRIC VEHICLE POWER INVERTER MARKET, BY INVERTER TYPE

    • 5.1 Overview

      • 5.1.1 Market size and forecast

    • 5.2 Traction Inverter

      • 5.2.1 Key market trends, growth factors and opportunities

      • 5.2.2 Market size and forecast, by region

      • 5.2.3 Market analysis by country

    • 5.3 Soft Switching Inverter

      • 5.3.1 Key market trends, growth factors and opportunities

      • 5.3.2 Market size and forecast, by region

      • 5.3.3 Market analysis by country

  • CHAPTER 6: ELECTRIC VEHICLE POWER INVERTER MARKET, BY VEHICLE TYPE

    • 6.1 Overview

      • 6.1.1 Market size and forecast

    • 6.2 Passenger Vehicle

      • 6.2.1 Key market trends, growth factors and opportunities

      • 6.2.2 Market size and forecast, by region

      • 6.2.3 Market analysis by country

    • 6.3 Commercial Vehicle

      • 6.3.1 Key market trends, growth factors and opportunities

      • 6.3.2 Market size and forecast, by region

      • 6.3.3 Market analysis by country

  • CHAPTER 7: ELECTRIC VEHICLE POWER INVERTER MARKET, BY LEVEL OF INTEGRATION

    • 7.1 Overview

      • 7.1.1 Market size and forecast

    • 7.2 Integrated Inverter System

      • 7.2.1 Key market trends, growth factors and opportunities

      • 7.2.2 Market size and forecast, by region

      • 7.2.3 Market analysis by country

    • 7.3 Separate Inverter System

      • 7.3.1 Key market trends, growth factors and opportunities

      • 7.3.2 Market size and forecast, by region

      • 7.3.3 Market analysis by country

    • 7.4 Mechatronic Integration System

      • 7.4.1 Key market trends, growth factors and opportunities

      • 7.4.2 Market size and forecast, by region

      • 7.4.3 Market analysis by country

  • CHAPTER 8: ELECTRIC VEHICLE POWER INVERTER MARKET, BY DISTRIBUTION CHANNEL

    • 8.1 Overview

      • 8.1.1 Market size and forecast

    • 8.2 OEM

      • 8.2.1 Key market trends, growth factors and opportunities

      • 8.2.2 Market size and forecast, by region

      • 8.2.3 Market analysis by country

    • 8.3 Aftermarket

      • 8.3.1 Key market trends, growth factors and opportunities

      • 8.3.2 Market size and forecast, by region

      • 8.3.3 Market analysis by country

  • CHAPTER 9: ELECTRIC VEHICLE POWER INVERTER MARKET, BY REGION

    • 9.1 Overview

      • 9.1.1 Market size and forecast

    • 9.2 North America

      • 9.2.1 Key trends and opportunities

      • 9.2.2 North America Market size and forecast, by Propulsion

      • 9.2.3 North America Market size and forecast, by Inverter Type

      • 9.2.4 North America Market size and forecast, by Vehicle Type

      • 9.2.5 North America Market size and forecast, by Level of Integration

      • 9.2.6 North America Market size and forecast, by Distribution Channel

      • 9.2.7 North America Market size and forecast, by country

        • 9.2.7.1 U.S.
          • 9.2.7.1.1 Market size and forecast, by Propulsion
          • 9.2.7.1.2 Market size and forecast, by Inverter Type
          • 9.2.7.1.3 Market size and forecast, by Vehicle Type
          • 9.2.7.1.4 Market size and forecast, by Level of Integration
          • 9.2.7.1.5 Market size and forecast, by Distribution Channel
        • 9.2.7.2 Canada
          • 9.2.7.2.1 Market size and forecast, by Propulsion
          • 9.2.7.2.2 Market size and forecast, by Inverter Type
          • 9.2.7.2.3 Market size and forecast, by Vehicle Type
          • 9.2.7.2.4 Market size and forecast, by Level of Integration
          • 9.2.7.2.5 Market size and forecast, by Distribution Channel
        • 9.2.7.3 Mexico
          • 9.2.7.3.1 Market size and forecast, by Propulsion
          • 9.2.7.3.2 Market size and forecast, by Inverter Type
          • 9.2.7.3.3 Market size and forecast, by Vehicle Type
          • 9.2.7.3.4 Market size and forecast, by Level of Integration
          • 9.2.7.3.5 Market size and forecast, by Distribution Channel
    • 9.3 Europe

      • 9.3.1 Key trends and opportunities

      • 9.3.2 Europe Market size and forecast, by Propulsion

      • 9.3.3 Europe Market size and forecast, by Inverter Type

      • 9.3.4 Europe Market size and forecast, by Vehicle Type

      • 9.3.5 Europe Market size and forecast, by Level of Integration

      • 9.3.6 Europe Market size and forecast, by Distribution Channel

      • 9.3.7 Europe Market size and forecast, by country

        • 9.3.7.1 Germany
          • 9.3.7.1.1 Market size and forecast, by Propulsion
          • 9.3.7.1.2 Market size and forecast, by Inverter Type
          • 9.3.7.1.3 Market size and forecast, by Vehicle Type
          • 9.3.7.1.4 Market size and forecast, by Level of Integration
          • 9.3.7.1.5 Market size and forecast, by Distribution Channel
        • 9.3.7.2 France
          • 9.3.7.2.1 Market size and forecast, by Propulsion
          • 9.3.7.2.2 Market size and forecast, by Inverter Type
          • 9.3.7.2.3 Market size and forecast, by Vehicle Type
          • 9.3.7.2.4 Market size and forecast, by Level of Integration
          • 9.3.7.2.5 Market size and forecast, by Distribution Channel
        • 9.3.7.3 Russia
          • 9.3.7.3.1 Market size and forecast, by Propulsion
          • 9.3.7.3.2 Market size and forecast, by Inverter Type
          • 9.3.7.3.3 Market size and forecast, by Vehicle Type
          • 9.3.7.3.4 Market size and forecast, by Level of Integration
          • 9.3.7.3.5 Market size and forecast, by Distribution Channel
        • 9.3.7.4 Netherlands
          • 9.3.7.4.1 Market size and forecast, by Propulsion
          • 9.3.7.4.2 Market size and forecast, by Inverter Type
          • 9.3.7.4.3 Market size and forecast, by Vehicle Type
          • 9.3.7.4.4 Market size and forecast, by Level of Integration
          • 9.3.7.4.5 Market size and forecast, by Distribution Channel
        • 9.3.7.5 U.K.
          • 9.3.7.5.1 Market size and forecast, by Propulsion
          • 9.3.7.5.2 Market size and forecast, by Inverter Type
          • 9.3.7.5.3 Market size and forecast, by Vehicle Type
          • 9.3.7.5.4 Market size and forecast, by Level of Integration
          • 9.3.7.5.5 Market size and forecast, by Distribution Channel
        • 9.3.7.6 Poland
          • 9.3.7.6.1 Market size and forecast, by Propulsion
          • 9.3.7.6.2 Market size and forecast, by Inverter Type
          • 9.3.7.6.3 Market size and forecast, by Vehicle Type
          • 9.3.7.6.4 Market size and forecast, by Level of Integration
          • 9.3.7.6.5 Market size and forecast, by Distribution Channel
        • 9.3.7.7 Spain
          • 9.3.7.7.1 Market size and forecast, by Propulsion
          • 9.3.7.7.2 Market size and forecast, by Inverter Type
          • 9.3.7.7.3 Market size and forecast, by Vehicle Type
          • 9.3.7.7.4 Market size and forecast, by Level of Integration
          • 9.3.7.7.5 Market size and forecast, by Distribution Channel
        • 9.3.7.8 Rest of Europe
          • 9.3.7.8.1 Market size and forecast, by Propulsion
          • 9.3.7.8.2 Market size and forecast, by Inverter Type
          • 9.3.7.8.3 Market size and forecast, by Vehicle Type
          • 9.3.7.8.4 Market size and forecast, by Level of Integration
          • 9.3.7.8.5 Market size and forecast, by Distribution Channel
    • 9.4 Asia-Pacific

      • 9.4.1 Key trends and opportunities

      • 9.4.2 Asia-Pacific Market size and forecast, by Propulsion

      • 9.4.3 Asia-Pacific Market size and forecast, by Inverter Type

      • 9.4.4 Asia-Pacific Market size and forecast, by Vehicle Type

      • 9.4.5 Asia-Pacific Market size and forecast, by Level of Integration

      • 9.4.6 Asia-Pacific Market size and forecast, by Distribution Channel

      • 9.4.7 Asia-Pacific Market size and forecast, by country

        • 9.4.7.1 China
          • 9.4.7.1.1 Market size and forecast, by Propulsion
          • 9.4.7.1.2 Market size and forecast, by Inverter Type
          • 9.4.7.1.3 Market size and forecast, by Vehicle Type
          • 9.4.7.1.4 Market size and forecast, by Level of Integration
          • 9.4.7.1.5 Market size and forecast, by Distribution Channel
        • 9.4.7.2 India
          • 9.4.7.2.1 Market size and forecast, by Propulsion
          • 9.4.7.2.2 Market size and forecast, by Inverter Type
          • 9.4.7.2.3 Market size and forecast, by Vehicle Type
          • 9.4.7.2.4 Market size and forecast, by Level of Integration
          • 9.4.7.2.5 Market size and forecast, by Distribution Channel
        • 9.4.7.3 Japan
          • 9.4.7.3.1 Market size and forecast, by Propulsion
          • 9.4.7.3.2 Market size and forecast, by Inverter Type
          • 9.4.7.3.3 Market size and forecast, by Vehicle Type
          • 9.4.7.3.4 Market size and forecast, by Level of Integration
          • 9.4.7.3.5 Market size and forecast, by Distribution Channel
        • 9.4.7.4 South Korea
          • 9.4.7.4.1 Market size and forecast, by Propulsion
          • 9.4.7.4.2 Market size and forecast, by Inverter Type
          • 9.4.7.4.3 Market size and forecast, by Vehicle Type
          • 9.4.7.4.4 Market size and forecast, by Level of Integration
          • 9.4.7.4.5 Market size and forecast, by Distribution Channel
        • 9.4.7.5 Asean
          • 9.4.7.5.1 Market size and forecast, by Propulsion
          • 9.4.7.5.2 Market size and forecast, by Inverter Type
          • 9.4.7.5.3 Market size and forecast, by Vehicle Type
          • 9.4.7.5.4 Market size and forecast, by Level of Integration
          • 9.4.7.5.5 Market size and forecast, by Distribution Channel
        • 9.4.7.6 Rest of Asia-Pacific
          • 9.4.7.6.1 Market size and forecast, by Propulsion
          • 9.4.7.6.2 Market size and forecast, by Inverter Type
          • 9.4.7.6.3 Market size and forecast, by Vehicle Type
          • 9.4.7.6.4 Market size and forecast, by Level of Integration
          • 9.4.7.6.5 Market size and forecast, by Distribution Channel
    • 9.5 LAMEA

      • 9.5.1 Key trends and opportunities

      • 9.5.2 LAMEA Market size and forecast, by Propulsion

      • 9.5.3 LAMEA Market size and forecast, by Inverter Type

      • 9.5.4 LAMEA Market size and forecast, by Vehicle Type

      • 9.5.5 LAMEA Market size and forecast, by Level of Integration

      • 9.5.6 LAMEA Market size and forecast, by Distribution Channel

      • 9.5.7 LAMEA Market size and forecast, by country

        • 9.5.7.1 Brazil
          • 9.5.7.1.1 Market size and forecast, by Propulsion
          • 9.5.7.1.2 Market size and forecast, by Inverter Type
          • 9.5.7.1.3 Market size and forecast, by Vehicle Type
          • 9.5.7.1.4 Market size and forecast, by Level of Integration
          • 9.5.7.1.5 Market size and forecast, by Distribution Channel
        • 9.5.7.2 UAE
          • 9.5.7.2.1 Market size and forecast, by Propulsion
          • 9.5.7.2.2 Market size and forecast, by Inverter Type
          • 9.5.7.2.3 Market size and forecast, by Vehicle Type
          • 9.5.7.2.4 Market size and forecast, by Level of Integration
          • 9.5.7.2.5 Market size and forecast, by Distribution Channel
        • 9.5.7.3 Saudi Arabia
          • 9.5.7.3.1 Market size and forecast, by Propulsion
          • 9.5.7.3.2 Market size and forecast, by Inverter Type
          • 9.5.7.3.3 Market size and forecast, by Vehicle Type
          • 9.5.7.3.4 Market size and forecast, by Level of Integration
          • 9.5.7.3.5 Market size and forecast, by Distribution Channel
        • 9.5.7.4 South Africa
          • 9.5.7.4.1 Market size and forecast, by Propulsion
          • 9.5.7.4.2 Market size and forecast, by Inverter Type
          • 9.5.7.4.3 Market size and forecast, by Vehicle Type
          • 9.5.7.4.4 Market size and forecast, by Level of Integration
          • 9.5.7.4.5 Market size and forecast, by Distribution Channel
        • 9.5.7.5 Rest of LAMEA
          • 9.5.7.5.1 Market size and forecast, by Propulsion
          • 9.5.7.5.2 Market size and forecast, by Inverter Type
          • 9.5.7.5.3 Market size and forecast, by Vehicle Type
          • 9.5.7.5.4 Market size and forecast, by Level of Integration
          • 9.5.7.5.5 Market size and forecast, by Distribution Channel
  • CHAPTER 10: COMPANY LANDSCAPE

    • 10.1. Introduction

    • 10.2. Top winning strategies

    • 10.3. Product Mapping of Top 10 Player

    • 10.4. Competitive Dashboard

    • 10.5. Competitive Heatmap

    • 10.6. Key developments

  • CHAPTER 11: COMPANY PROFILES

    • 11.1 Aptiv PLC

      • 11.1.1 Company overview

      • 11.1.2 Company snapshot

      • 11.1.3 Operating business segments

      • 11.1.4 Product portfolio

      • 11.1.5 Business performance

      • 11.1.6 Key strategic moves and developments

    • 11.2 Changsha BYD

      • 11.2.1 Company overview

      • 11.2.2 Company snapshot

      • 11.2.3 Operating business segments

      • 11.2.4 Product portfolio

      • 11.2.5 Business performance

      • 11.2.6 Key strategic moves and developments

    • 11.3 Continental

      • 11.3.1 Company overview

      • 11.3.2 Company snapshot

      • 11.3.3 Operating business segments

      • 11.3.4 Product portfolio

      • 11.3.5 Business performance

      • 11.3.6 Key strategic moves and developments

    • 11.4 CWB Automotive Electronics Co., Ltd.

      • 11.4.1 Company overview

      • 11.4.2 Company snapshot

      • 11.4.3 Operating business segments

      • 11.4.4 Product portfolio

      • 11.4.5 Business performance

      • 11.4.6 Key strategic moves and developments

    • 11.5 DENSO Corporation

      • 11.5.1 Company overview

      • 11.5.2 Company snapshot

      • 11.5.3 Operating business segments

      • 11.5.4 Product portfolio

      • 11.5.5 Business performance

      • 11.5.6 Key strategic moves and developments

    • 11.6 Hitachi Astemo Ltd

      • 11.6.1 Company overview

      • 11.6.2 Company snapshot

      • 11.6.3 Operating business segments

      • 11.6.4 Product portfolio

      • 11.6.5 Business performance

      • 11.6.6 Key strategic moves and developments

    • 11.7 Lear Corporation

      • 11.7.1 Company overview

      • 11.7.2 Company snapshot

      • 11.7.3 Operating business segments

      • 11.7.4 Product portfolio

      • 11.7.5 Business performance

      • 11.7.6 Key strategic moves and developments

    • 11.8 Marelli Corporation

      • 11.8.1 Company overview

      • 11.8.2 Company snapshot

      • 11.8.3 Operating business segments

      • 11.8.4 Product portfolio

      • 11.8.5 Business performance

      • 11.8.6 Key strategic moves and developments

    • 11.9 Meidensha Corporation

      • 11.9.1 Company overview

      • 11.9.2 Company snapshot

      • 11.9.3 Operating business segments

      • 11.9.4 Product portfolio

      • 11.9.5 Business performance

      • 11.9.6 Key strategic moves and developments

    • 11.10 Mitsubishi Electric Corporation

      • 11.10.1 Company overview

      • 11.10.2 Company snapshot

      • 11.10.3 Operating business segments

      • 11.10.4 Product portfolio

      • 11.10.5 Business performance

      • 11.10.6 Key strategic moves and developments

    • 11.11 Nissan

      • 11.11.1 Company overview

      • 11.11.2 Company snapshot

      • 11.11.3 Operating business segments

      • 11.11.4 Product portfolio

      • 11.11.5 Business performance

      • 11.11.6 Key strategic moves and developments

    • 11.12 Robert Bosch GmbH

      • 11.12.1 Company overview

      • 11.12.2 Company snapshot

      • 11.12.3 Operating business segments

      • 11.12.4 Product portfolio

      • 11.12.5 Business performance

      • 11.12.6 Key strategic moves and developments

    • 11.13 Siemens

      • 11.13.1 Company overview

      • 11.13.2 Company snapshot

      • 11.13.3 Operating business segments

      • 11.13.4 Product portfolio

      • 11.13.5 Business performance

      • 11.13.6 Key strategic moves and developments

    • 11.14 Sungchang Autotech Co., Ltd.

      • 11.14.1 Company overview

      • 11.14.2 Company snapshot

      • 11.14.3 Operating business segments

      • 11.14.4 Product portfolio

      • 11.14.5 Business performance

      • 11.14.6 Key strategic moves and developments

    • 11.15 Toyota Industries Corporation

      • 11.15.1 Company overview

      • 11.15.2 Company snapshot

      • 11.15.3 Operating business segments

      • 11.15.4 Product portfolio

      • 11.15.5 Business performance

      • 11.15.6 Key strategic moves and developments

    • 11.16 Valeo Group

      • 11.16.1 Company overview

      • 11.16.2 Company snapshot

      • 11.16.3 Operating business segments

      • 11.16.4 Product portfolio

      • 11.16.5 Business performance

      • 11.16.6 Key strategic moves and developments

    • 11.17 Vitesco Technologies

      • 11.17.1 Company overview

      • 11.17.2 Company snapshot

      • 11.17.3 Operating business segments

      • 11.17.4 Product portfolio

      • 11.17.5 Business performance

      • 11.17.6 Key strategic moves and developments

  • LIST OF TABLES

  • TABLE 1. GLOBAL ELECTRIC VEHICLE POWER INVERTER MARKET, BY PROPULSION, 2021-2031 ($MILLION)
    TABLE 2. ELECTRIC VEHICLE POWER INVERTER MARKET SIZE, FOR HYBRID VEHICLE, BY REGION, 2021-2031 ($MILLION)
    TABLE 3. ELECTRIC VEHICLE POWER INVERTER MARKET FOR HYBRID VEHICLE BY COUNTRY, 2021-2031 ($MILLION)
    TABLE 4. ELECTRIC VEHICLE POWER INVERTER MARKET SIZE, FOR PLUG IN HYBRID VEHICLE, BY REGION, 2021-2031 ($MILLION)
    TABLE 5. ELECTRIC VEHICLE POWER INVERTER MARKET FOR PLUG IN HYBRID VEHICLE BY COUNTRY, 2021-2031 ($MILLION)
    TABLE 6. ELECTRIC VEHICLE POWER INVERTER MARKET SIZE, FOR BATTERY ELECTRIC VEHICLE, BY REGION, 2021-2031 ($MILLION)
    TABLE 7. ELECTRIC VEHICLE POWER INVERTER MARKET FOR BATTERY ELECTRIC VEHICLE BY COUNTRY, 2021-2031 ($MILLION)
    TABLE 8. GLOBAL ELECTRIC VEHICLE POWER INVERTER MARKET, BY INVERTER TYPE, 2021-2031 ($MILLION)
    TABLE 9. ELECTRIC VEHICLE POWER INVERTER MARKET SIZE, FOR TRACTION INVERTER, BY REGION, 2021-2031 ($MILLION)
    TABLE 10. ELECTRIC VEHICLE POWER INVERTER MARKET FOR TRACTION INVERTER BY COUNTRY, 2021-2031 ($MILLION)
    TABLE 11. ELECTRIC VEHICLE POWER INVERTER MARKET SIZE, FOR SOFT SWITCHING INVERTER, BY REGION, 2021-2031 ($MILLION)
    TABLE 12. ELECTRIC VEHICLE POWER INVERTER MARKET FOR SOFT SWITCHING INVERTER BY COUNTRY, 2021-2031 ($MILLION)
    TABLE 13. GLOBAL ELECTRIC VEHICLE POWER INVERTER MARKET, BY VEHICLE TYPE, 2021-2031 ($MILLION)
    TABLE 14. ELECTRIC VEHICLE POWER INVERTER MARKET SIZE, FOR PASSENGER VEHICLE, BY REGION, 2021-2031 ($MILLION)
    TABLE 15. ELECTRIC VEHICLE POWER INVERTER MARKET FOR PASSENGER VEHICLE BY COUNTRY, 2021-2031 ($MILLION)
    TABLE 16. ELECTRIC VEHICLE POWER INVERTER MARKET SIZE, FOR COMMERCIAL VEHICLE, BY REGION, 2021-2031 ($MILLION)
    TABLE 17. ELECTRIC VEHICLE POWER INVERTER MARKET FOR COMMERCIAL VEHICLE BY COUNTRY, 2021-2031 ($MILLION)
    TABLE 18. GLOBAL ELECTRIC VEHICLE POWER INVERTER MARKET, BY LEVEL OF INTEGRATION, 2021-2031 ($MILLION)
    TABLE 19. ELECTRIC VEHICLE POWER INVERTER MARKET SIZE, FOR INTEGRATED INVERTER SYSTEM, BY REGION, 2021-2031 ($MILLION)
    TABLE 20. ELECTRIC VEHICLE POWER INVERTER MARKET FOR INTEGRATED INVERTER SYSTEM BY COUNTRY, 2021-2031 ($MILLION)
    TABLE 21. ELECTRIC VEHICLE POWER INVERTER MARKET SIZE, FOR SEPARATE INVERTER SYSTEM, BY REGION, 2021-2031 ($MILLION)
    TABLE 22. ELECTRIC VEHICLE POWER INVERTER MARKET FOR SEPARATE INVERTER SYSTEM BY COUNTRY, 2021-2031 ($MILLION)
    TABLE 23. ELECTRIC VEHICLE POWER INVERTER MARKET SIZE, FOR MECHATRONIC INTEGRATION SYSTEM, BY REGION, 2021-2031 ($MILLION)
    TABLE 24. ELECTRIC VEHICLE POWER INVERTER MARKET FOR MECHATRONIC INTEGRATION SYSTEM BY COUNTRY, 2021-2031 ($MILLION)
    TABLE 25. GLOBAL ELECTRIC VEHICLE POWER INVERTER MARKET, BY DISTRIBUTION CHANNEL, 2021-2031 ($MILLION)
    TABLE 26. ELECTRIC VEHICLE POWER INVERTER MARKET SIZE, FOR OEM, BY REGION, 2021-2031 ($MILLION)
    TABLE 27. ELECTRIC VEHICLE POWER INVERTER MARKET FOR OEM BY COUNTRY, 2021-2031 ($MILLION)
    TABLE 28. ELECTRIC VEHICLE POWER INVERTER MARKET SIZE, FOR AFTERMARKET, BY REGION, 2021-2031 ($MILLION)
    TABLE 29. ELECTRIC VEHICLE POWER INVERTER MARKET FOR AFTERMARKET BY COUNTRY, 2021-2031 ($MILLION)
    TABLE 30. ELECTRIC VEHICLE POWER INVERTER MARKET, BY REGION, 2021-2031 ($MILLION)
    TABLE 31. NORTH AMERICA ELECTRIC VEHICLE POWER INVERTER MARKET, BY PROPULSION, 2021-2031 ($MILLION)
    TABLE 32. NORTH AMERICA ELECTRIC VEHICLE POWER INVERTER MARKET, BY INVERTER TYPE, 2021-2031 ($MILLION)
    TABLE 33. NORTH AMERICA ELECTRIC VEHICLE POWER INVERTER MARKET, BY VEHICLE TYPE, 2021-2031 ($MILLION)
    TABLE 34. NORTH AMERICA ELECTRIC VEHICLE POWER INVERTER MARKET, BY LEVEL OF INTEGRATION, 2021-2031 ($MILLION)
    TABLE 35. NORTH AMERICA ELECTRIC VEHICLE POWER INVERTER MARKET, BY DISTRIBUTION CHANNEL, 2021-2031 ($MILLION)
    TABLE 36. NORTH AMERICA ELECTRIC VEHICLE POWER INVERTER MARKET, BY COUNTRY, 2021-2031 ($MILLION)
    TABLE 37. U.S. ELECTRIC VEHICLE POWER INVERTER MARKET, BY PROPULSION, 2021-2031 ($MILLION)
    TABLE 38. U.S. ELECTRIC VEHICLE POWER INVERTER MARKET, BY INVERTER TYPE, 2021-2031 ($MILLION)
    TABLE 39. U.S. ELECTRIC VEHICLE POWER INVERTER MARKET, BY VEHICLE TYPE, 2021-2031 ($MILLION)
    TABLE 40. U.S. ELECTRIC VEHICLE POWER INVERTER MARKET, BY LEVEL OF INTEGRATION, 2021-2031 ($MILLION)
    TABLE 41. U.S. ELECTRIC VEHICLE POWER INVERTER MARKET, BY DISTRIBUTION CHANNEL, 2021-2031 ($MILLION)
    TABLE 42. CANADA ELECTRIC VEHICLE POWER INVERTER MARKET, BY PROPULSION, 2021-2031 ($MILLION)
    TABLE 43. CANADA ELECTRIC VEHICLE POWER INVERTER MARKET, BY INVERTER TYPE, 2021-2031 ($MILLION)
    TABLE 44. CANADA ELECTRIC VEHICLE POWER INVERTER MARKET, BY VEHICLE TYPE, 2021-2031 ($MILLION)
    TABLE 45. CANADA ELECTRIC VEHICLE POWER INVERTER MARKET, BY LEVEL OF INTEGRATION, 2021-2031 ($MILLION)
    TABLE 46. CANADA ELECTRIC VEHICLE POWER INVERTER MARKET, BY DISTRIBUTION CHANNEL, 2021-2031 ($MILLION)
    TABLE 47. MEXICO ELECTRIC VEHICLE POWER INVERTER MARKET, BY PROPULSION, 2021-2031 ($MILLION)
    TABLE 48. MEXICO ELECTRIC VEHICLE POWER INVERTER MARKET, BY INVERTER TYPE, 2021-2031 ($MILLION)
    TABLE 49. MEXICO ELECTRIC VEHICLE POWER INVERTER MARKET, BY VEHICLE TYPE, 2021-2031 ($MILLION)
    TABLE 50. MEXICO ELECTRIC VEHICLE POWER INVERTER MARKET, BY LEVEL OF INTEGRATION, 2021-2031 ($MILLION)
    TABLE 51. MEXICO ELECTRIC VEHICLE POWER INVERTER MARKET, BY DISTRIBUTION CHANNEL, 2021-2031 ($MILLION)
    TABLE 52. EUROPE ELECTRIC VEHICLE POWER INVERTER MARKET, BY PROPULSION, 2021-2031 ($MILLION)
    TABLE 53. EUROPE ELECTRIC VEHICLE POWER INVERTER MARKET, BY INVERTER TYPE, 2021-2031 ($MILLION)
    TABLE 54. EUROPE ELECTRIC VEHICLE POWER INVERTER MARKET, BY VEHICLE TYPE, 2021-2031 ($MILLION)
    TABLE 55. EUROPE ELECTRIC VEHICLE POWER INVERTER MARKET, BY LEVEL OF INTEGRATION, 2021-2031 ($MILLION)
    TABLE 56. EUROPE ELECTRIC VEHICLE POWER INVERTER MARKET, BY DISTRIBUTION CHANNEL, 2021-2031 ($MILLION)
    TABLE 57. EUROPE ELECTRIC VEHICLE POWER INVERTER MARKET, BY COUNTRY, 2021-2031 ($MILLION)
    TABLE 58. GERMANY ELECTRIC VEHICLE POWER INVERTER MARKET, BY PROPULSION, 2021-2031 ($MILLION)
    TABLE 59. GERMANY ELECTRIC VEHICLE POWER INVERTER MARKET, BY INVERTER TYPE, 2021-2031 ($MILLION)
    TABLE 60. GERMANY ELECTRIC VEHICLE POWER INVERTER MARKET, BY VEHICLE TYPE, 2021-2031 ($MILLION)
    TABLE 61. GERMANY ELECTRIC VEHICLE POWER INVERTER MARKET, BY LEVEL OF INTEGRATION, 2021-2031 ($MILLION)
    TABLE 62. GERMANY ELECTRIC VEHICLE POWER INVERTER MARKET, BY DISTRIBUTION CHANNEL, 2021-2031 ($MILLION)
    TABLE 63. FRANCE ELECTRIC VEHICLE POWER INVERTER MARKET, BY PROPULSION, 2021-2031 ($MILLION)
    TABLE 64. FRANCE ELECTRIC VEHICLE POWER INVERTER MARKET, BY INVERTER TYPE, 2021-2031 ($MILLION)
    TABLE 65. FRANCE ELECTRIC VEHICLE POWER INVERTER MARKET, BY VEHICLE TYPE, 2021-2031 ($MILLION)
    TABLE 66. FRANCE ELECTRIC VEHICLE POWER INVERTER MARKET, BY LEVEL OF INTEGRATION, 2021-2031 ($MILLION)
    TABLE 67. FRANCE ELECTRIC VEHICLE POWER INVERTER MARKET, BY DISTRIBUTION CHANNEL, 2021-2031 ($MILLION)
    TABLE 68. RUSSIA ELECTRIC VEHICLE POWER INVERTER MARKET, BY PROPULSION, 2021-2031 ($MILLION)
    TABLE 69. RUSSIA ELECTRIC VEHICLE POWER INVERTER MARKET, BY INVERTER TYPE, 2021-2031 ($MILLION)
    TABLE 70. RUSSIA ELECTRIC VEHICLE POWER INVERTER MARKET, BY VEHICLE TYPE, 2021-2031 ($MILLION)
    TABLE 71. RUSSIA ELECTRIC VEHICLE POWER INVERTER MARKET, BY LEVEL OF INTEGRATION, 2021-2031 ($MILLION)
    TABLE 72. RUSSIA ELECTRIC VEHICLE POWER INVERTER MARKET, BY DISTRIBUTION CHANNEL, 2021-2031 ($MILLION)
    TABLE 73. NETHERLANDS ELECTRIC VEHICLE POWER INVERTER MARKET, BY PROPULSION, 2021-2031 ($MILLION)
    TABLE 74. NETHERLANDS ELECTRIC VEHICLE POWER INVERTER MARKET, BY INVERTER TYPE, 2021-2031 ($MILLION)
    TABLE 75. NETHERLANDS ELECTRIC VEHICLE POWER INVERTER MARKET, BY VEHICLE TYPE, 2021-2031 ($MILLION)
    TABLE 76. NETHERLANDS ELECTRIC VEHICLE POWER INVERTER MARKET, BY LEVEL OF INTEGRATION, 2021-2031 ($MILLION)
    TABLE 77. NETHERLANDS ELECTRIC VEHICLE POWER INVERTER MARKET, BY DISTRIBUTION CHANNEL, 2021-2031 ($MILLION)
    TABLE 78. U.K. ELECTRIC VEHICLE POWER INVERTER MARKET, BY PROPULSION, 2021-2031 ($MILLION)
    TABLE 79. U.K. ELECTRIC VEHICLE POWER INVERTER MARKET, BY INVERTER TYPE, 2021-2031 ($MILLION)
    TABLE 80. U.K. ELECTRIC VEHICLE POWER INVERTER MARKET, BY VEHICLE TYPE, 2021-2031 ($MILLION)
    TABLE 81. U.K. ELECTRIC VEHICLE POWER INVERTER MARKET, BY LEVEL OF INTEGRATION, 2021-2031 ($MILLION)
    TABLE 82. U.K. ELECTRIC VEHICLE POWER INVERTER MARKET, BY DISTRIBUTION CHANNEL, 2021-2031 ($MILLION)
    TABLE 83. POLAND ELECTRIC VEHICLE POWER INVERTER MARKET, BY PROPULSION, 2021-2031 ($MILLION)
    TABLE 84. POLAND ELECTRIC VEHICLE POWER INVERTER MARKET, BY INVERTER TYPE, 2021-2031 ($MILLION)
    TABLE 85. POLAND ELECTRIC VEHICLE POWER INVERTER MARKET, BY VEHICLE TYPE, 2021-2031 ($MILLION)
    TABLE 86. POLAND ELECTRIC VEHICLE POWER INVERTER MARKET, BY LEVEL OF INTEGRATION, 2021-2031 ($MILLION)
    TABLE 87. POLAND ELECTRIC VEHICLE POWER INVERTER MARKET, BY DISTRIBUTION CHANNEL, 2021-2031 ($MILLION)
    TABLE 88. SPAIN ELECTRIC VEHICLE POWER INVERTER MARKET, BY PROPULSION, 2021-2031 ($MILLION)
    TABLE 89. SPAIN ELECTRIC VEHICLE POWER INVERTER MARKET, BY INVERTER TYPE, 2021-2031 ($MILLION)
    TABLE 90. SPAIN ELECTRIC VEHICLE POWER INVERTER MARKET, BY VEHICLE TYPE, 2021-2031 ($MILLION)
    TABLE 91. SPAIN ELECTRIC VEHICLE POWER INVERTER MARKET, BY LEVEL OF INTEGRATION, 2021-2031 ($MILLION)
    TABLE 92. SPAIN ELECTRIC VEHICLE POWER INVERTER MARKET, BY DISTRIBUTION CHANNEL, 2021-2031 ($MILLION)
    TABLE 93. REST OF EUROPE ELECTRIC VEHICLE POWER INVERTER MARKET, BY PROPULSION, 2021-2031 ($MILLION)
    TABLE 94. REST OF EUROPE ELECTRIC VEHICLE POWER INVERTER MARKET, BY INVERTER TYPE, 2021-2031 ($MILLION)
    TABLE 95. REST OF EUROPE ELECTRIC VEHICLE POWER INVERTER MARKET, BY VEHICLE TYPE, 2021-2031 ($MILLION)
    TABLE 96. REST OF EUROPE ELECTRIC VEHICLE POWER INVERTER MARKET, BY LEVEL OF INTEGRATION, 2021-2031 ($MILLION)
    TABLE 97. REST OF EUROPE ELECTRIC VEHICLE POWER INVERTER MARKET, BY DISTRIBUTION CHANNEL, 2021-2031 ($MILLION)
    TABLE 98. ASIA-PACIFIC ELECTRIC VEHICLE POWER INVERTER MARKET, BY PROPULSION, 2021-2031 ($MILLION)
    TABLE 99. ASIA-PACIFIC ELECTRIC VEHICLE POWER INVERTER MARKET, BY INVERTER TYPE, 2021-2031 ($MILLION)
    TABLE 100. ASIA-PACIFIC ELECTRIC VEHICLE POWER INVERTER MARKET, BY VEHICLE TYPE, 2021-2031 ($MILLION)
    TABLE 101. ASIA-PACIFIC ELECTRIC VEHICLE POWER INVERTER MARKET, BY LEVEL OF INTEGRATION, 2021-2031 ($MILLION)
    TABLE 102. ASIA-PACIFIC ELECTRIC VEHICLE POWER INVERTER MARKET, BY DISTRIBUTION CHANNEL, 2021-2031 ($MILLION)
    TABLE 103. ASIA-PACIFIC ELECTRIC VEHICLE POWER INVERTER MARKET, BY COUNTRY, 2021-2031 ($MILLION)
    TABLE 104. CHINA ELECTRIC VEHICLE POWER INVERTER MARKET, BY PROPULSION, 2021-2031 ($MILLION)
    TABLE 105. CHINA ELECTRIC VEHICLE POWER INVERTER MARKET, BY INVERTER TYPE, 2021-2031 ($MILLION)
    TABLE 106. CHINA ELECTRIC VEHICLE POWER INVERTER MARKET, BY VEHICLE TYPE, 2021-2031 ($MILLION)
    TABLE 107. CHINA ELECTRIC VEHICLE POWER INVERTER MARKET, BY LEVEL OF INTEGRATION, 2021-2031 ($MILLION)
    TABLE 108. CHINA ELECTRIC VEHICLE POWER INVERTER MARKET, BY DISTRIBUTION CHANNEL, 2021-2031 ($MILLION)
    TABLE 109. INDIA ELECTRIC VEHICLE POWER INVERTER MARKET, BY PROPULSION, 2021-2031 ($MILLION)
    TABLE 110. INDIA ELECTRIC VEHICLE POWER INVERTER MARKET, BY INVERTER TYPE, 2021-2031 ($MILLION)
    TABLE 111. INDIA ELECTRIC VEHICLE POWER INVERTER MARKET, BY VEHICLE TYPE, 2021-2031 ($MILLION)
    TABLE 112. INDIA ELECTRIC VEHICLE POWER INVERTER MARKET, BY LEVEL OF INTEGRATION, 2021-2031 ($MILLION)
    TABLE 113. INDIA ELECTRIC VEHICLE POWER INVERTER MARKET, BY DISTRIBUTION CHANNEL, 2021-2031 ($MILLION)
    TABLE 114. JAPAN ELECTRIC VEHICLE POWER INVERTER MARKET, BY PROPULSION, 2021-2031 ($MILLION)
    TABLE 115. JAPAN ELECTRIC VEHICLE POWER INVERTER MARKET, BY INVERTER TYPE, 2021-2031 ($MILLION)
    TABLE 116. JAPAN ELECTRIC VEHICLE POWER INVERTER MARKET, BY VEHICLE TYPE, 2021-2031 ($MILLION)
    TABLE 117. JAPAN ELECTRIC VEHICLE POWER INVERTER MARKET, BY LEVEL OF INTEGRATION, 2021-2031 ($MILLION)
    TABLE 118. JAPAN ELECTRIC VEHICLE POWER INVERTER MARKET, BY DISTRIBUTION CHANNEL, 2021-2031 ($MILLION)
    TABLE 119. SOUTH KOREA ELECTRIC VEHICLE POWER INVERTER MARKET, BY PROPULSION, 2021-2031 ($MILLION)
    TABLE 120. SOUTH KOREA ELECTRIC VEHICLE POWER INVERTER MARKET, BY INVERTER TYPE, 2021-2031 ($MILLION)
    TABLE 121. SOUTH KOREA ELECTRIC VEHICLE POWER INVERTER MARKET, BY VEHICLE TYPE, 2021-2031 ($MILLION)
    TABLE 122. SOUTH KOREA ELECTRIC VEHICLE POWER INVERTER MARKET, BY LEVEL OF INTEGRATION, 2021-2031 ($MILLION)
    TABLE 123. SOUTH KOREA ELECTRIC VEHICLE POWER INVERTER MARKET, BY DISTRIBUTION CHANNEL, 2021-2031 ($MILLION)
    TABLE 124. ASEAN ELECTRIC VEHICLE POWER INVERTER MARKET, BY PROPULSION, 2021-2031 ($MILLION)
    TABLE 125. ASEAN ELECTRIC VEHICLE POWER INVERTER MARKET, BY INVERTER TYPE, 2021-2031 ($MILLION)
    TABLE 126. ASEAN ELECTRIC VEHICLE POWER INVERTER MARKET, BY VEHICLE TYPE, 2021-2031 ($MILLION)
    TABLE 127. ASEAN ELECTRIC VEHICLE POWER INVERTER MARKET, BY LEVEL OF INTEGRATION, 2021-2031 ($MILLION)
    TABLE 128. ASEAN ELECTRIC VEHICLE POWER INVERTER MARKET, BY DISTRIBUTION CHANNEL, 2021-2031 ($MILLION)
    TABLE 129. REST OF ASIA-PACIFIC ELECTRIC VEHICLE POWER INVERTER MARKET, BY PROPULSION, 2021-2031 ($MILLION)
    TABLE 130. REST OF ASIA-PACIFIC ELECTRIC VEHICLE POWER INVERTER MARKET, BY INVERTER TYPE, 2021-2031 ($MILLION)
    TABLE 131. REST OF ASIA-PACIFIC ELECTRIC VEHICLE POWER INVERTER MARKET, BY VEHICLE TYPE, 2021-2031 ($MILLION)
    TABLE 132. REST OF ASIA-PACIFIC ELECTRIC VEHICLE POWER INVERTER MARKET, BY LEVEL OF INTEGRATION, 2021-2031 ($MILLION)
    TABLE 133. REST OF ASIA-PACIFIC ELECTRIC VEHICLE POWER INVERTER MARKET, BY DISTRIBUTION CHANNEL, 2021-2031 ($MILLION)
    TABLE 134. LAMEA ELECTRIC VEHICLE POWER INVERTER MARKET, BY PROPULSION, 2021-2031 ($MILLION)
    TABLE 135. LAMEA ELECTRIC VEHICLE POWER INVERTER MARKET, BY INVERTER TYPE, 2021-2031 ($MILLION)
    TABLE 136. LAMEA ELECTRIC VEHICLE POWER INVERTER MARKET, BY VEHICLE TYPE, 2021-2031 ($MILLION)
    TABLE 137. LAMEA ELECTRIC VEHICLE POWER INVERTER MARKET, BY LEVEL OF INTEGRATION, 2021-2031 ($MILLION)
    TABLE 138. LAMEA ELECTRIC VEHICLE POWER INVERTER MARKET, BY DISTRIBUTION CHANNEL, 2021-2031 ($MILLION)
    TABLE 139. LAMEA ELECTRIC VEHICLE POWER INVERTER MARKET, BY COUNTRY, 2021-2031 ($MILLION)
    TABLE 140. BRAZIL ELECTRIC VEHICLE POWER INVERTER MARKET, BY PROPULSION, 2021-2031 ($MILLION)
    TABLE 141. BRAZIL ELECTRIC VEHICLE POWER INVERTER MARKET, BY INVERTER TYPE, 2021-2031 ($MILLION)
    TABLE 142. BRAZIL ELECTRIC VEHICLE POWER INVERTER MARKET, BY VEHICLE TYPE, 2021-2031 ($MILLION)
    TABLE 143. BRAZIL ELECTRIC VEHICLE POWER INVERTER MARKET, BY LEVEL OF INTEGRATION, 2021-2031 ($MILLION)
    TABLE 144. BRAZIL ELECTRIC VEHICLE POWER INVERTER MARKET, BY DISTRIBUTION CHANNEL, 2021-2031 ($MILLION)
    TABLE 145. UAE ELECTRIC VEHICLE POWER INVERTER MARKET, BY PROPULSION, 2021-2031 ($MILLION)
    TABLE 146. UAE ELECTRIC VEHICLE POWER INVERTER MARKET, BY INVERTER TYPE, 2021-2031 ($MILLION)
    TABLE 147. UAE ELECTRIC VEHICLE POWER INVERTER MARKET, BY VEHICLE TYPE, 2021-2031 ($MILLION)
    TABLE 148. UAE ELECTRIC VEHICLE POWER INVERTER MARKET, BY LEVEL OF INTEGRATION, 2021-2031 ($MILLION)
    TABLE 149. UAE ELECTRIC VEHICLE POWER INVERTER MARKET, BY DISTRIBUTION CHANNEL, 2021-2031 ($MILLION)
    TABLE 150. SAUDI ARABIA ELECTRIC VEHICLE POWER INVERTER MARKET, BY PROPULSION, 2021-2031 ($MILLION)
    TABLE 151. SAUDI ARABIA ELECTRIC VEHICLE POWER INVERTER MARKET, BY INVERTER TYPE, 2021-2031 ($MILLION)
    TABLE 152. SAUDI ARABIA ELECTRIC VEHICLE POWER INVERTER MARKET, BY VEHICLE TYPE, 2021-2031 ($MILLION)
    TABLE 153. SAUDI ARABIA ELECTRIC VEHICLE POWER INVERTER MARKET, BY LEVEL OF INTEGRATION, 2021-2031 ($MILLION)
    TABLE 154. SAUDI ARABIA ELECTRIC VEHICLE POWER INVERTER MARKET, BY DISTRIBUTION CHANNEL, 2021-2031 ($MILLION)
    TABLE 155. SOUTH AFRICA ELECTRIC VEHICLE POWER INVERTER MARKET, BY PROPULSION, 2021-2031 ($MILLION)
    TABLE 156. SOUTH AFRICA ELECTRIC VEHICLE POWER INVERTER MARKET, BY INVERTER TYPE, 2021-2031 ($MILLION)
    TABLE 157. SOUTH AFRICA ELECTRIC VEHICLE POWER INVERTER MARKET, BY VEHICLE TYPE, 2021-2031 ($MILLION)
    TABLE 158. SOUTH AFRICA ELECTRIC VEHICLE POWER INVERTER MARKET, BY LEVEL OF INTEGRATION, 2021-2031 ($MILLION)
    TABLE 159. SOUTH AFRICA ELECTRIC VEHICLE POWER INVERTER MARKET, BY DISTRIBUTION CHANNEL, 2021-2031 ($MILLION)
    TABLE 160. REST OF LAMEA ELECTRIC VEHICLE POWER INVERTER MARKET, BY PROPULSION, 2021-2031 ($MILLION)
    TABLE 161. REST OF LAMEA ELECTRIC VEHICLE POWER INVERTER MARKET, BY INVERTER TYPE, 2021-2031 ($MILLION)
    TABLE 162. REST OF LAMEA ELECTRIC VEHICLE POWER INVERTER MARKET, BY VEHICLE TYPE, 2021-2031 ($MILLION)
    TABLE 163. REST OF LAMEA ELECTRIC VEHICLE POWER INVERTER MARKET, BY LEVEL OF INTEGRATION, 2021-2031 ($MILLION)
    TABLE 164. REST OF LAMEA ELECTRIC VEHICLE POWER INVERTER MARKET, BY DISTRIBUTION CHANNEL, 2021-2031 ($MILLION)
    TABLE 165.APTIV PLC: COMPANY SNAPSHOT
    TABLE 166.APTIV PLC: OPERATING SEGMENTS
    TABLE 167.APTIV PLC: PRODUCT PORTFOLIO
    TABLE 168.APTIV PLC: NET SALES,
    TABLE 169.APTIV PLC: KEY STRATERGIES
    TABLE 170.CHANGSHA BYD: COMPANY SNAPSHOT
    TABLE 171.CHANGSHA BYD: OPERATING SEGMENTS
    TABLE 172.CHANGSHA BYD: PRODUCT PORTFOLIO
    TABLE 173.CHANGSHA BYD: NET SALES,
    TABLE 174.CHANGSHA BYD: KEY STRATERGIES
    TABLE 175.CONTINENTAL: COMPANY SNAPSHOT
    TABLE 176.CONTINENTAL: OPERATING SEGMENTS
    TABLE 177.CONTINENTAL: PRODUCT PORTFOLIO
    TABLE 178.CONTINENTAL: NET SALES,
    TABLE 179.CONTINENTAL: KEY STRATERGIES
    TABLE 180.CWB AUTOMOTIVE ELECTRONICS CO., LTD.: COMPANY SNAPSHOT
    TABLE 181.CWB AUTOMOTIVE ELECTRONICS CO., LTD.: OPERATING SEGMENTS
    TABLE 182.CWB AUTOMOTIVE ELECTRONICS CO., LTD.: PRODUCT PORTFOLIO
    TABLE 183.CWB AUTOMOTIVE ELECTRONICS CO., LTD.: NET SALES,
    TABLE 184.CWB AUTOMOTIVE ELECTRONICS CO., LTD.: KEY STRATERGIES
    TABLE 185.DENSO CORPORATION: COMPANY SNAPSHOT
    TABLE 186.DENSO CORPORATION: OPERATING SEGMENTS
    TABLE 187.DENSO CORPORATION: PRODUCT PORTFOLIO
    TABLE 188.DENSO CORPORATION: NET SALES,
    TABLE 189.DENSO CORPORATION: KEY STRATERGIES
    TABLE 190.HITACHI ASTEMO LTD: COMPANY SNAPSHOT
    TABLE 191.HITACHI ASTEMO LTD: OPERATING SEGMENTS
    TABLE 192.HITACHI ASTEMO LTD: PRODUCT PORTFOLIO
    TABLE 193.HITACHI ASTEMO LTD: NET SALES,
    TABLE 194.HITACHI ASTEMO LTD: KEY STRATERGIES
    TABLE 195.LEAR CORPORATION: COMPANY SNAPSHOT
    TABLE 196.LEAR CORPORATION: OPERATING SEGMENTS
    TABLE 197.LEAR CORPORATION: PRODUCT PORTFOLIO
    TABLE 198.LEAR CORPORATION: NET SALES,
    TABLE 199.LEAR CORPORATION: KEY STRATERGIES
    TABLE 200.MARELLI CORPORATION: COMPANY SNAPSHOT
    TABLE 201.MARELLI CORPORATION: OPERATING SEGMENTS
    TABLE 202.MARELLI CORPORATION: PRODUCT PORTFOLIO
    TABLE 203.MARELLI CORPORATION: NET SALES,
    TABLE 204.MARELLI CORPORATION: KEY STRATERGIES
    TABLE 205.MEIDENSHA CORPORATION: COMPANY SNAPSHOT
    TABLE 206.MEIDENSHA CORPORATION: OPERATING SEGMENTS
    TABLE 207.MEIDENSHA CORPORATION: PRODUCT PORTFOLIO
    TABLE 208.MEIDENSHA CORPORATION: NET SALES,
    TABLE 209.MEIDENSHA CORPORATION: KEY STRATERGIES
    TABLE 210.MITSUBISHI ELECTRIC CORPORATION: COMPANY SNAPSHOT
    TABLE 211.MITSUBISHI ELECTRIC CORPORATION: OPERATING SEGMENTS
    TABLE 212.MITSUBISHI ELECTRIC CORPORATION: PRODUCT PORTFOLIO
    TABLE 213.MITSUBISHI ELECTRIC CORPORATION: NET SALES,
    TABLE 214.MITSUBISHI ELECTRIC CORPORATION: KEY STRATERGIES
    TABLE 215.NISSAN: COMPANY SNAPSHOT
    TABLE 216.NISSAN: OPERATING SEGMENTS
    TABLE 217.NISSAN: PRODUCT PORTFOLIO
    TABLE 218.NISSAN: NET SALES,
    TABLE 219.NISSAN: KEY STRATERGIES
    TABLE 220.ROBERT BOSCH GMBH: COMPANY SNAPSHOT
    TABLE 221.ROBERT BOSCH GMBH: OPERATING SEGMENTS
    TABLE 222.ROBERT BOSCH GMBH: PRODUCT PORTFOLIO
    TABLE 223.ROBERT BOSCH GMBH: NET SALES,
    TABLE 224.ROBERT BOSCH GMBH: KEY STRATERGIES
    TABLE 225.SIEMENS: COMPANY SNAPSHOT
    TABLE 226.SIEMENS: OPERATING SEGMENTS
    TABLE 227.SIEMENS: PRODUCT PORTFOLIO
    TABLE 228.SIEMENS: NET SALES,
    TABLE 229.SIEMENS: KEY STRATERGIES
    TABLE 230.SUNGCHANG AUTOTECH CO., LTD.: COMPANY SNAPSHOT
    TABLE 231.SUNGCHANG AUTOTECH CO., LTD.: OPERATING SEGMENTS
    TABLE 232.SUNGCHANG AUTOTECH CO., LTD.: PRODUCT PORTFOLIO
    TABLE 233.SUNGCHANG AUTOTECH CO., LTD.: NET SALES,
    TABLE 234.SUNGCHANG AUTOTECH CO., LTD.: KEY STRATERGIES
    TABLE 235.TOYOTA INDUSTRIES CORPORATION: COMPANY SNAPSHOT
    TABLE 236.TOYOTA INDUSTRIES CORPORATION: OPERATING SEGMENTS
    TABLE 237.TOYOTA INDUSTRIES CORPORATION: PRODUCT PORTFOLIO
    TABLE 238.TOYOTA INDUSTRIES CORPORATION: NET SALES,
    TABLE 239.TOYOTA INDUSTRIES CORPORATION: KEY STRATERGIES
    TABLE 240.VALEO GROUP: COMPANY SNAPSHOT
    TABLE 241.VALEO GROUP: OPERATING SEGMENTS
    TABLE 242.VALEO GROUP: PRODUCT PORTFOLIO
    TABLE 243.VALEO GROUP: NET SALES,
    TABLE 244.VALEO GROUP: KEY STRATERGIES
    TABLE 245.VITESCO TECHNOLOGIES: COMPANY SNAPSHOT
    TABLE 246.VITESCO TECHNOLOGIES: OPERATING SEGMENTS
    TABLE 247.VITESCO TECHNOLOGIES: PRODUCT PORTFOLIO
    TABLE 248.VITESCO TECHNOLOGIES: NET SALES,
    TABLE 249.VITESCO TECHNOLOGIES: KEY STRATERGIES
  • LIST OF FIGURES

  • FIGURE 1.ELECTRIC VEHICLE POWER INVERTER MARKET SEGMENTATION
    FIGURE 2.ELECTRIC VEHICLE POWER INVERTER MARKET,2021-2031
    FIGURE 3.ELECTRIC VEHICLE POWER INVERTER MARKET,2021-2031
    FIGURE 4. TOP INVESTMENT POCKETS, BY REGION
    FIGURE 5.PORTER FIVE-1
    FIGURE 6.PORTER FIVE-2
    FIGURE 7.PORTER FIVE-3
    FIGURE 8.PORTER FIVE-4
    FIGURE 9.PORTER FIVE-5
    FIGURE 10.TOP PLAYER POSITIONING
    FIGURE 11.ELECTRIC VEHICLE POWER INVERTER MARKET:DRIVERS, RESTRAINTS AND OPPORTUNITIES
    FIGURE 12.ELECTRIC VEHICLE POWER INVERTER MARKET,BY PROPULSION,2021(%)
    FIGURE 13.COMPARATIVE SHARE ANALYSIS OF HYBRID VEHICLE ELECTRIC VEHICLE POWER INVERTER MARKET,2021-2031(%)
    FIGURE 14.COMPARATIVE SHARE ANALYSIS OF PLUG IN HYBRID VEHICLE ELECTRIC VEHICLE POWER INVERTER MARKET,2021-2031(%)
    FIGURE 15.COMPARATIVE SHARE ANALYSIS OF BATTERY ELECTRIC VEHICLE ELECTRIC VEHICLE POWER INVERTER MARKET,2021-2031(%)
    FIGURE 16.ELECTRIC VEHICLE POWER INVERTER MARKET,BY INVERTER TYPE,2021(%)
    FIGURE 17.COMPARATIVE SHARE ANALYSIS OF TRACTION INVERTER ELECTRIC VEHICLE POWER INVERTER MARKET,2021-2031(%)
    FIGURE 18.COMPARATIVE SHARE ANALYSIS OF SOFT SWITCHING INVERTER ELECTRIC VEHICLE POWER INVERTER MARKET,2021-2031(%)
    FIGURE 19.ELECTRIC VEHICLE POWER INVERTER MARKET,BY VEHICLE TYPE,2021(%)
    FIGURE 20.COMPARATIVE SHARE ANALYSIS OF PASSENGER VEHICLE ELECTRIC VEHICLE POWER INVERTER MARKET,2021-2031(%)
    FIGURE 21.COMPARATIVE SHARE ANALYSIS OF COMMERCIAL VEHICLE ELECTRIC VEHICLE POWER INVERTER MARKET,2021-2031(%)
    FIGURE 22.ELECTRIC VEHICLE POWER INVERTER MARKET,BY LEVEL OF INTEGRATION,2021(%)
    FIGURE 23.COMPARATIVE SHARE ANALYSIS OF INTEGRATED INVERTER SYSTEM ELECTRIC VEHICLE POWER INVERTER MARKET,2021-2031(%)
    FIGURE 24.COMPARATIVE SHARE ANALYSIS OF SEPARATE INVERTER SYSTEM ELECTRIC VEHICLE POWER INVERTER MARKET,2021-2031(%)
    FIGURE 25.COMPARATIVE SHARE ANALYSIS OF MECHATRONIC INTEGRATION SYSTEM ELECTRIC VEHICLE POWER INVERTER MARKET,2021-2031(%)
    FIGURE 26.ELECTRIC VEHICLE POWER INVERTER MARKET,BY DISTRIBUTION CHANNEL,2021(%)
    FIGURE 27.COMPARATIVE SHARE ANALYSIS OF OEM ELECTRIC VEHICLE POWER INVERTER MARKET,2021-2031(%)
    FIGURE 28.COMPARATIVE SHARE ANALYSIS OF AFTERMARKET ELECTRIC VEHICLE POWER INVERTER MARKET,2021-2031(%)
    FIGURE 29.ELECTRIC VEHICLE POWER INVERTER MARKET BY REGION,2021
    FIGURE 30.U.S. ELECTRIC VEHICLE POWER INVERTER MARKET,2021-2031($MILLION)
    FIGURE 31.CANADA ELECTRIC VEHICLE POWER INVERTER MARKET,2021-2031($MILLION)
    FIGURE 32.MEXICO ELECTRIC VEHICLE POWER INVERTER MARKET,2021-2031($MILLION)
    FIGURE 33.GERMANY ELECTRIC VEHICLE POWER INVERTER MARKET,2021-2031($MILLION)
    FIGURE 34.FRANCE ELECTRIC VEHICLE POWER INVERTER MARKET,2021-2031($MILLION)
    FIGURE 35.RUSSIA ELECTRIC VEHICLE POWER INVERTER MARKET,2021-2031($MILLION)
    FIGURE 36.NETHERLANDS ELECTRIC VEHICLE POWER INVERTER MARKET,2021-2031($MILLION)
    FIGURE 37.U.K. ELECTRIC VEHICLE POWER INVERTER MARKET,2021-2031($MILLION)
    FIGURE 38.POLAND ELECTRIC VEHICLE POWER INVERTER MARKET,2021-2031($MILLION)
    FIGURE 39.SPAIN ELECTRIC VEHICLE POWER INVERTER MARKET,2021-2031($MILLION)
    FIGURE 40.REST OF EUROPE ELECTRIC VEHICLE POWER INVERTER MARKET,2021-2031($MILLION)
    FIGURE 41.CHINA ELECTRIC VEHICLE POWER INVERTER MARKET,2021-2031($MILLION)
    FIGURE 42.INDIA ELECTRIC VEHICLE POWER INVERTER MARKET,2021-2031($MILLION)
    FIGURE 43.JAPAN ELECTRIC VEHICLE POWER INVERTER MARKET,2021-2031($MILLION)
    FIGURE 44.SOUTH KOREA ELECTRIC VEHICLE POWER INVERTER MARKET,2021-2031($MILLION)
    FIGURE 45.ASEAN ELECTRIC VEHICLE POWER INVERTER MARKET,2021-2031($MILLION)
    FIGURE 46.REST OF ASIA-PACIFIC ELECTRIC VEHICLE POWER INVERTER MARKET,2021-2031($MILLION)
    FIGURE 47.BRAZIL ELECTRIC VEHICLE POWER INVERTER MARKET,2021-2031($MILLION)
    FIGURE 48.UAE ELECTRIC VEHICLE POWER INVERTER MARKET,2021-2031($MILLION)
    FIGURE 49.SAUDI ARABIA ELECTRIC VEHICLE POWER INVERTER MARKET,2021-2031($MILLION)
    FIGURE 50.SOUTH AFRICA ELECTRIC VEHICLE POWER INVERTER MARKET,2021-2031($MILLION)
    FIGURE 51.REST OF LAMEA ELECTRIC VEHICLE POWER INVERTER MARKET,2021-2031($MILLION)
    FIGURE 52. TOP WINNING STRATEGIES, BY YEAR
    FIGURE 53. TOP WINNING STRATEGIES, BY DEVELOPMENT
    FIGURE 54. TOP WINNING STRATEGIES, BY COMPANY
    FIGURE 55.PRODUCT MAPPING OF TOP 10 PLAYERS
    FIGURE 56.COMPETITIVE DASHBOARD
    FIGURE 57.COMPETITIVE HEATMAP OF TOP 10 KEY PLAYERS
    FIGURE 58.APTIV PLC.: NET SALES ,($MILLION)
    FIGURE 59.CHANGSHA BYD.: NET SALES ,($MILLION)
    FIGURE 60.CONTINENTAL.: NET SALES ,($MILLION)
    FIGURE 61.CWB AUTOMOTIVE ELECTRONICS CO., LTD..: NET SALES ,($MILLION)
    FIGURE 62.DENSO CORPORATION.: NET SALES ,($MILLION)
    FIGURE 63.HITACHI ASTEMO LTD.: NET SALES ,($MILLION)
    FIGURE 64.LEAR CORPORATION.: NET SALES ,($MILLION)
    FIGURE 65.MARELLI CORPORATION.: NET SALES ,($MILLION)
    FIGURE 66.MEIDENSHA CORPORATION.: NET SALES ,($MILLION)
    FIGURE 67.MITSUBISHI ELECTRIC CORPORATION.: NET SALES ,($MILLION)
    FIGURE 68.NISSAN.: NET SALES ,($MILLION)
    FIGURE 69.ROBERT BOSCH GMBH.: NET SALES ,($MILLION)
    FIGURE 70.SIEMENS.: NET SALES ,($MILLION)
    FIGURE 71.SUNGCHANG AUTOTECH CO., LTD..: NET SALES ,($MILLION)
    FIGURE 72.TOYOTA INDUSTRIES CORPORATION.: NET SALES ,($MILLION)
    FIGURE 73.VALEO GROUP.: NET SALES ,($MILLION)
    FIGURE 74.VITESCO TECHNOLOGIES.: NET SALES ,($MILLION)


The electric vehicle power inverter market is expected to witness significant growth, due to stringent vehicle emission norms and an increase in the demand for fuel-efficient & low-emission vehicles. Usage of electric vehicles has increased in a wide range of cars, which include compact hatchbacks to SUVs and even two wheelers. The presence of stringent fuel efficiency norms in Europe has compelled vehicle manufacturers to develop zero emission technology for the vehicles. This further enhances the growth of the electric vehicle industry

Factors such as increase in demand for electric vehicles, proactive government initiatives for the development of electric vehicle, and surge in demand for low-emission and fuel-efficient vehicles are anticipated to boost the growth of the global electric vehicle power inverter market during the forecast timeframe. However, lack of sufficient infrastructure for electric vehicles and high manufacturing cost of electric vehicles are expected to hinder the growth of the global electric vehicle power inverter market during the forecast period. Moreover, technological advancement in electric vehicles and rise in demand for solar powered electric vehicles are expected to create an opportunity for the electric vehicle power inverter market in near future.

To fulfil the changing demand scenarios, market participants are concentrating on product developments and product launch to offer a diverse range of products and meet new business opportunities. For instance, in May 2022, Hitachi, Ltd and Hitachi Astemo, Ltd. developed basic technology for a thin-type inverter that achieves both energy conservation and miniaturization as a power converter for electric vehicles. Moreover, on 7th July 2022, Marelli Holdings Co., Ltd. launched its new 800 Volt Silicon Carbide inverters platform at Dritev. With higher efficiency and reduced size & weight, the solution allows increased driving range and further benefits in electric vehicles. In addition, market participants are continuously focusing on business expansion to improve their geographic and customer reach. For instance, in May 2022, Hitachi Astemo, Ltd. announced the start of mass production of electric vehicle inverters at its Miyagi No.4 Plant, located in Murata, Miyagi Prefecture, to meet the increasing demand for electrification products. To meet this increasing demand, Hitachi Astemo has expanded its production capabilities and product line-up of core components for electric vehicles, such as motors and inverters, through the establishment of manufacturing subsidiaries and the four company integration, which was completed in January 2021.

Furthermore, Electric vehicle power inverter market is segmented basis of propulsion, inverter type, vehicle type, level of integration, distribution channel, and region. By propulsion, it is divided into full hybrid vehicle, plug-in hybrid vehicle, and battery electric vehicle. By inverter type, it is divided into traction inverter, and soft switching inverter. By vehicle type, it is segmented into passenger cars, and commercial vehicles. By level of integration, it is divided into integrated inverter system, separate inverter system, and mechatronic integration system. By distribution channel, the market is divided into OEM, and aftermarket.  By region, the market is analyzed across North America, Europe, Asia-Pacific, and LAMEA.

The key players that operate in this market are Aptiv, BYD COMPAY LTD., Continental AG, CWB Automotive Electronics Co., Ltd., Denso Corporation, Hitachi Astemo, Ltd. (Subsidiary of Hitachi, Ltd.), Lear Corporation, Marelli Holdings Co., Ltd., Meidensha Corporation, Mitsubishi Electric Corporation, Nissan motors co., Ltd., Robert Bosch GmbH, Siemens, Sungchang, Toyota Industries Corporation, Valeo, and Vitesco Technologies

PURCHASE OPTIONS

Call or Email us

U.S.-Canada Toll-free: +1-800-792-5285
Int'l : +1-503-894-6022
Europe : +44-845-528-1300
Email : help@alliedmarketresearch.com
 
FREQUENTLY ASKED QUESTIONS?

A. The global electric vehicle power inverter market was valued at $8.67 billion in 2021, and is projected to reach $22.25 billion by 2031.

A. Integrated Inverter System is the leading segment of Electric Vehicle Power Inverter Market

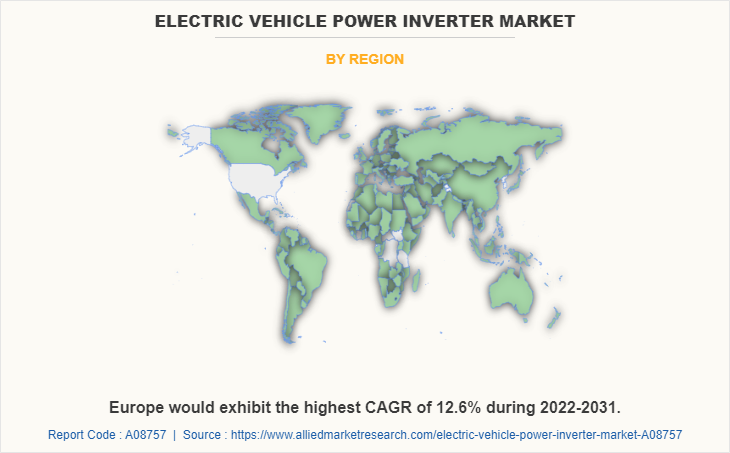
A. Asia-Pacific is the largest regional market for Electric Vehicle Power Inverter

A. The key players that operate in this market are Aptiv, BYD COMPAY LTD., Continental AG, CWB Automotive Electronics Co., Ltd., Denso Corporation, Hitachi Astemo, Ltd. (Subsidiary of Hitachi, Ltd.), Lear Corporation, Marelli Holdings Co., Ltd., Meidensha Corporation, Mitsubishi Electric Corporation, Nissan motors co., Ltd., Robert Bosch GmbH, Siemens, Sungchang, Toyota Industries Corporation, Valeo, and Vitesco Technologies

A. Increase in use of efficient electric vehicle power inverter for improved performance, higher efficiency and power density is major trend in the market

A. The report sample for global Electric Vehicle Power Inverter market report can be obtained on demand from the website.

Looking for Customization?

 Customization Request

Have a Question?

 Speak with Analyst

Any Confusion?

 Inquire Before Buying

Have a glance of the Report

  Request Sample
RELATED TAGS

Purchase Full Report of
Electric Vehicle Power Inverter Market

Start reading instantly.
This Report and over 66,804+ more Reports, Available with Avenue Library. T&C*.

  • Online Only
  • $3,570
  • Online cloud access only
  • Restricted print, copy, paste & download
  • Read only
  • Free industry update
    (Within 180 days)
  • Free report update in next update cycle
    (Jul 2023 - Jul 2024)
  • Data Pack
  • $3,840
  • Restricted to one authorized user
  • One print only
  • Available in
    Excel
  • Free industry update
    (Within 180 days)
  •   Free report update in next update cycle
    (Jul 2023 - Jul 2024)
  • Single User
  • $5,730
  • Restricted to one authorized user
  • One print only
  • Available in
    PDF
  • Free industry update
    (Within 180 days)
  •   Free report update in next update cycle
    (Jul 2023 - Jul 2024)
  • Five Users
  • $6,450
  • Limited to five authorized users
  • Print upto five copies
  • Available in
    PDF
  • Free industry update
    (Within 180 days)
  •   Free report update in next update cycle
    (Jul 2023 - Jul 2024)
  • Enterprise
    License/PDF

  • $9,600
  • Unlimited
    within
    company/enterprise
  • Available in Excel & PDF
  • Free industry update
    (Within 180 days)
  •   Free report update in next update cycle
    (Jul 2023 - Jul 2024)
  • Library
    Membership

  • $999 $ 1,175
    Per User/ Per month/ Billed annually
  • Published Content
    E-access
  • Company Profiles
    E-access
  • Newly Added Content Access
  • 10 PDF
    Downloads
  • 5 Excel Data
    Pack Downloads
  • 250 Company Profiles PDF Downloads
  • Buy Now

*Taxes/Fees, if applicable will be added during checkout. All prices in USD

RELATED REPORTS
 

Why Allied Market Research?


Infallible Methodology

To ensure high-level data integrity, accurate analysis, and impeccable forecasts

Analyst Support

For complete satisfaction

Customization

On-demand customization of scope of the report to exactly meet your needs

TARGETED MARKET VIEW

Targeted market view to provide pertinent information and save time of readers

Get fresh content delivered

Get insights on topics that are crucial for your business. Stay abreast of your interest areas.

Get Industry Data Alerts

Why Allied Market Research?

Infallible Methodology

To ensure high-level data integrity, accurate analysis, and impeccable forecasts

Analyst Support

For complete satisfaction

Customization

On-demand customization of scope of the report to exactly meet your needs

TARGETED MARKET VIEW

Targeted market view to provide pertinent information and save time of readers