
Embedded Computing Market Insights:
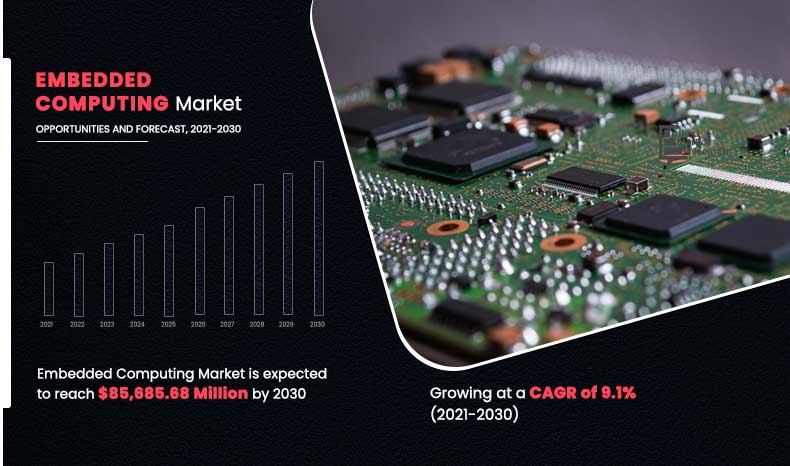
The global embedded computing market size was valued at USD 36,743.56 Million in 2020 and is projected to reach USD 85,685.68 Million by 2030, growing at a CAGR of 9.1% from 2021 to 2030.
Embedded systems are essential used to control, monitor, or perform specific functions of an electronic equipment by fixed set of programs, plans, or rules. It performs functions such as reading sensor inputs, processing the data, display required output, generating & transmitting commands, and transforming the information. Embedded systems applications are used across various sectors, including home applications and operating systems for smart devices, which contribute to the overall market growth., On the basis of type, the hardware segment dominated the overall embedded computing industry in 2020, and is expected to continue this trend throughout the forecast period. This is attributed due to rise in standards of living, technological awareness among people, and increase in disposable income of the country.
In addition, Asia-Pacific and LAMEA are expecting a potential growth in the hardware market during the forecast period, owing to their developments, increase in awareness about technologies, and cost-effective consumer electronics. These factors provide lucrative embedded computing market opportunities for the hardware segment. However, the software segment is expected to grow the most, and this trend is expected to continue during the forecast period. This is attributed to the rise in market of Internet of Things (IoT); surge in cognitive intelligence application, prediction, and analytical software; increase in use of mobile phones & applications; and rise in concern for system. office automation, banking, security, automobile, defense, telecommunications, consumer electronics, personal, healthcare, and smart card industries. These factors are expected to augment the embedded computing market demand.
Technology Insights:
The embedded computing market is experiencing significant growth as the demand for advanced, reliable, and efficient computing solutions across various industries continues to rise. Embedded systems, which combine hardware and software to perform specific tasks within a larger system, are integral to sectors such as automotive, healthcare, industrial automation, telecommunications, and consumer electronics. As technology evolves, businesses across these sectors are increasingly adopting embedded computing solutions to improve performance, enhance functionality, and reduce costs.
By Type
Software segment is projected as one of the most lucrative segments.
By end user, the communication sector segment held the largest share in 2020, and is expected to continue this trend during the forecast period. The communication sector segment is highly reliable on embedded computing applications, owing to increase in population and evolution of Internet of Thing (IoT). In addition, surge in use of consumer electronics devices, such as mobile devices, laptops, tablets, personal computers, satellites, television, and radar, along with falling prices of these devices facilitated the growth of embedded computing in the communication sector. However, the automotive sector segment is expected to reach the highest growth in the upcoming years. This is due the adoption of advanced embedded systems has increased rapidly. Automobile manufacturers deploy embedded systems in their cars for different functionalities such as audio systems, security, and ignition.
By End User
Automotive sector is projected as one of the most lucrative sector
In addition, major automobile manufacturers are inclined towards investing in technology advancement to develop vehicles that are more network savvy, safer, and energy efficient, which is expected to provide the lucrative growth opportunities for the automotive sector.
Top Impacting Factors:
Prominent impacting factors for the embedded computing market include use of embedded computing in consumer electronics, usage in AI, emerging economies, evolution in IoT, hardware limitation, high initial investments, and design & configuration of embedded computing systems. These factors have significantly contributed for the growth of embedded computing industry and affect the market during forecast period. In addition, rise in awareness among people regarding benefits of latest technology adoption along with increase in disposable income accelerate the adoption of consumer electronics across the globe which, in turn, is attributed to drive the embedded computing market worldwide.
Increase in Automation of Processes
The process control and industrial automation markets have been highly reliable on design and development of embedded computing and are strong end users of motherboards and other electronic components such as microcontrollers, microprocessors, and graphics cards. Rough designs to survive harsh environments, high performance, maximum power efficiencies, wide range of I/O, and communication interfaces are some of the factors in embedded computing that are required by industrial automation. The automation of processes enables organizations to reduce and manage cost associated with labor, and improve production process with higher uniformity. The scope of embedded computing systems has expanded from monitoring & control to the integration of graphics capabilities & touchscreen display capabilities for improved interaction. The demand for embedded computing system for industrial is projected to increase, which is anticipated to accelerate the market growth.
Market Trends Insights:
The embedded computing market is expected to witness significant growth during the forecast period. This is attributed to the advancements in technology and increase in the demand for smart, connected devices. The proliferation of the Internet of Things (IoT) and the integration of artificial intelligence (AI) are among the key factors transforming the embedded computing landscape. These innovations have enhanced the capabilities of embedded systems, enabling more efficient processing, real-time data analysis, and greater autonomy in a wide range of applications, from automotive to industrial automation. This is expected to accelerate the growth of the market in the upcoming years.
Furthermore, there is a growing trend toward edge computing fueled by the adoption of embedded systems. By processing data closer to the source, edge devices reduce latency, optimize bandwidth, and improve overall system efficiency, making them increasingly essential for applications like autonomous vehicles, smart cities, and industrial IoT. In addition, advancements in low-power processing and power-efficient designs have expanded the use of embedded systems in battery-operated devices, offering improved energy efficiency without sacrificing performance.
Another notable trends in the embedded computing market is expected to witness is the integration of machine learning and AI algorithms into embedded systems. These systems are capable of performing complex tasks, such as predictive maintenance, facial recognition, and speech recognition, directly on the edge, eliminating the need for cloud-based processing. As a result, manufacturers and developers are adopting embedded computing solutions that offer increased intelligence and decision-making capabilities. In addition, there is a shift in preference toward the use of open-source hardware and software platforms, which allow for faster development cycles and lower entry barriers for new players. This embedded technology is stimulating innovation and encouraging a wide range of industries to explore embedded solutions for their unique needs. This is expected to drive market growth in the upcoming years.
The report focuses on the growth prospects, restraints, and embedded computing market analysis. The study uses Porter’s five forces analysis of the smart devices industry to understand the impact of various factors such as bargaining power of suppliers, competitive intensity of competitors, threat of new entrants, threat of substitutes, and bargaining power of buyers on the embedded computing market trends.
Key Companies & Market Share Insights:
Key players in the embedded computing market include Arm Holdings Plc., Fujitsu Limited, Intel Corporation, IBM Corporation, Microchip Technology, Inc., Microsoft Corporation, Qualcomm IncorporatedRenesas Electronics Corporation, STMicroelectronics, and Texas Instruments Incorporated. These embedded computing companies hold significant market shares and are known for their comprehensive range of embedded computing products and services. Market share is influenced by factors such as product innovation, strategic partnerships, and the breadth of applications their technologies support. The competition among these key companies shapes the market dynamics and drives innovation in the embedded computing sector.
Segment Review:
The embedded computing industry is segmented on the basis of type, end users, and region. On this of type, it is divided into hardware and software. On the basis of hardware, it is further sub-divided into, microcontroller, microprocessor, digital signal processer and others Depending on end user, it is classified into communications, industrial, consumer electronics, automotive, healthcare, energy, and others. Region wise, it is analyzed across North America, Europe, Asia-Pacific, and LAMEA.
By Region
Asia-Pacific is projected as one of the most significant region.
Key Industry Developments:
- On July, 18, 2024, Avnet launched a new brand called Tria™ to consolidate its embedded compute options. This new brand will cover embedded compute boards, systems, and associated design and manufacturing services. The goal is to streamline Avnet's compute design and manufacturing capabilities, making it easier for OEMs to leverage the latest technology and get products to market faster.
- October 7, 2024, Analog Devices has launched a new initiative focused on embedded software development. This initiative aims to enhance the capabilities of embedded systems by providing comprehensive software solutions that complement their hardware offerings. By integrating advanced software with their embedded hardware, Analog Devices seeks to streamline development processes and improve performance for various applications in the embedded computing market.
- On September 12, 2024, AAEON and The Embedded Kit, a Witekio brand, announced a strategic partnership at SIDO Lyon to simplify the development process for industrial companies. The collaboration offered an integrated hardware and software bundle, addressing challenges in sourcing, integrating, and securing systems. The Embedded Kit provided a Linux-based tooling ecosystem with features like secure boot, OTA updates, and vulnerability monitoring. AAEON’s de next-RAP8, powered by 13th Gen Intel® Core™ Processors, delivered high performance for AI edge computing, enabling device makers to focus on innovation rather than integration.
- On September 4, 2024, Avnet Embedded was promoted to Platinum Partner status within NXP Semiconductor’s Global Partner Program. This recognition highlighted their collaboration in developing and implementing embedded compute modules based on NXP’s i.MX processors, using SMARC form factors. Thomas Staudinger, president of Avnet Embedded, and Ron Martino, EVP of Global Sales at NXP, both acknowledged the value and innovation brought by this partnership.
- On March 20,2025, QNX partnered with Advantech to enhance embedded systems development12. This collaboration aims to deliver pre-integrated solutions with a unified approach to market and product development, targeting sectors such as MedTech, robotics, industrial automation, aerospace and defense, and agricultural technology12. By streamlining the development process, they aim to accelerate time-to-market and improve cost efficiencies for their customers.
Key Benefits for Stakeholders:
- The study provides an in-depth analysis of the embedded computing market forecast along with the current trends and future estimations to elucidate the imminent investment pockets.
- Information about key drivers, restraints, and opportunities and their impact analysis on the embedded computing market size is provided.
- Porter’s five forces embedded computing market analysis illustrates the potency of buyers and suppliers operating in the market.
- The quantitative analysis of the embedded computing market share from 2020 to 2030 is provided to determine the market potential.
Embedded Computing Market Report Highlights
| Aspects | Details |
| By Type |
|
| By End User |
|
| By Region |
|
| By Key Market Players |
|
Analyst Review
According to CXOs of leading companies, advancements in technologies and increase in demand from end-user verticals across the globe accelerate the need for advanced embedded computing system. In addition, increase in adoption of connected devices and smart wearables among people drive the market growth. Moreover, the adoption of artificial intelligence is increasing at a significant rate in end user verticals due to the increase in demand for solving complex problems. The acceptance of artificial intelligence is observed in computer games, power system stabilizers, medical sciences, accounting database, and robotics.
Artificial intelligence is highly reliable on embedded computing for complete existence, therefore the rise in demand for artificial intelligence is projected to have positive impact over the embedded computing market growth.
Region wise, Asia-Pacific and LAMEA are expected to create huge growth opportunities for leading players offering embedded solutions and services. Presently, the adoption of embedded systems in these regions is low; however, in the near future, the penetration level of embedded computing systems is projected to increase at significant rate.
Major players operating in the embedded computing market are projected to invest significant amount in R&D to come up with advanced and efficient embedded solutions. In addition, strategic mergers & acquisitions and collaboration are anticipated to help these organizations to expand their market presence and profit margin rapidly.
The global embedded computing market is expected to grow at a compound annual growth rate (CAGR) of 9.1% from 2021 to 2030 to reach USD 85,685.68 Million by 2030
Major key players operating in the market are Arm Holdings Plc., Fujitsu Limited, Intel Corporation, IBM Corporation, Microchip Technology, Inc., Microsoft Corporation, Qualcomm IncorporatedRenesas Electronics Corporation, STMicroelectronics, and Texas Instruments Incorporated.
Region-wise, Asia-Pacific and LAMEA are expected to create huge growth opportunities for leading players offering embedded solutions and services.
The global embedded computing market size was valued at USD 36,743.56 Million in 2020 and is projected to reach USD 85,685.68 Million by 2030
Rise in awareness among people regarding benefits of latest technology adoption along with increase in disposable income accelerate the adoption of consumer electronics across the globe which, in turn, is attributed to drive the embedded computing market worldwide.
Loading Table Of Content...

