Report Code: A06878 | Dec 2021 | Pages: 204 | ||
Tables: 115 | Charts: 66 |
|
Pandemic disrupted the entire world and affected many industries.
Get detailed COVID-19 impact analysis on the Energy As A Service Market
Request Now !
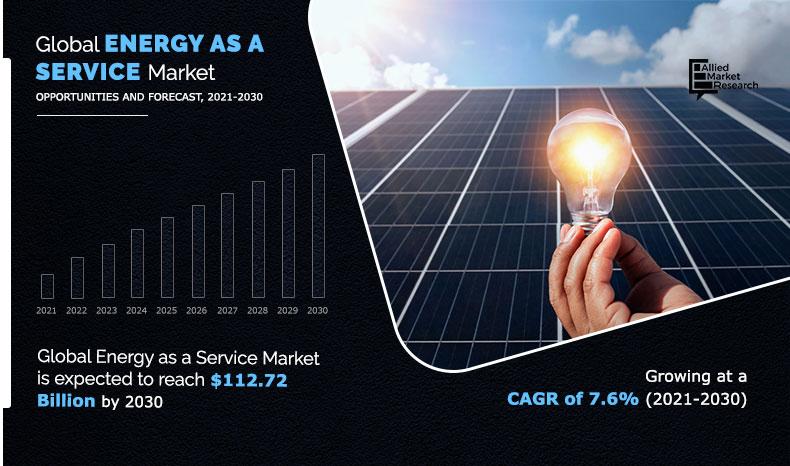
The global energy as a service market size was valued at $54.4 billion 2020, and is projected to reach $112.7 billion by 2030, growing at a CAGR of 7.6% from 2021 to 2030. Energy as a service is a swiftly growing and newly developed model that offers various energy related services and provides energy optimization solutions across small, medium and large businesses. It also increases awareness toward better management and increased installation of distributed generation sources. Energy as a service is used in different service types and detailed overview on these segments is given in the market study. The EAAS market provides detailed information on the end use segment that include commercial and industrial.
Electricity demand dropped to lower levels under lockdown, with dramatic reductions in services and IT industries and partial offset by higher residential use.
The growth of the global energy as a service market is driven by various factors that include rise in efforts by building owners to reduce energy cost of buildings, increase in renewable energy generation, rise in energy efficiency activities, rise in renewable energy adoption, and increase in smart grid installations On the contrary, owing to transition from traditional energy model to EaaS model by key players is anticipated to provide lucrative growth opportunities and maintain position in the market during the forecast period.
The energy as a service market is segmented into service, end user, and region. Depending on service type, the market is bifurcated into energy supply services, operation & maintenance, and energy efficiency & optimization. The end users covered in the study include commercial and industrial. Region wise, it is analyzed across North America, Europe, Asia-Pacific, and LAMEA.
The global market covers in-depth information of the major energy as a service industry participant. Some of the major players in the market include Veolia, Honeywell International Inc., EDF Renewables, and Enel X
Other players operating in the value chain of the global energy as a service market are Schneider Electric SE, Engie SA, Johnson Controls International, WGL Energy, Alpiq, General Electricnd and others.
The key players are adopting numerous strategies such as product launch, agreement, partnership, acquisition, and business expansion to stay competitive in the energy as a service market.
For instance, in June 2021, Honeywell and Alturas announced collaborative effort to deploy battery energy storage systems to customers globally. In this partnership Alturus will provide dedicated capital and structuring for Honeywell’s renewables & distributed assets projects
In addition, In June 2021, Honeywell launches Battery Energy storage systems platform to help users forecast and optimize energy costs. This product launch will expand the product portfolio of the company in the battery storage for grid stability and energy resource management.
The energy as a service market is analyzed and estimated in accordance with impacts of the drivers, restraints, and opportunities. The period studied in this report is 2021–2030. The report includes study of the market with respect to growth prospects and restraints based on the regional analysis. The study includes Porter’s five forces analysis of the industry to determine the impact of suppliers, competitors, new entrants, substitutes, and buyers on the market growth.
On the basis of service type, the energy supply services segment registered highest CAGR during the forecast period. This is attributed to increase in electric driven heavy manufacturing and transportation equipment are major factor that drive electric consumption, which propels demand for energy supply services.
On the basis of end use, the commercial segment dominated the global market in 2020, in terms of share. This is attributed to increase in demand for electricity from commercial applications such as restaurants, educational institutes, data centers, commercial complexes, and warehouses. In addition, rise in demand for optimization of energy consumption to reduce energy bills and to support sustainable environmental growth, which, in turn, is expected to drive growth of the market from 2021 to 2030.
Asia-Pacific has the highest share in the energy as a service market in 2020, and is anticipated to maintain its dominance throughout the forecast period. This is attributed to presence of key players and huge consumer base in the region. Furthermore, energy as a service is gaining importance, owing to increase in transformation across the energy industry including digitization, decarbonization, and rapid growth in distribution generation services, which is expected to augment growth of the energy as a service (EAAS) market during the forecast period.
COVID-19 impact on the market
Key Benefits For Stakeholders
Energy as a Service Market Report Highlights
Aspects | Details |
---|---|
By service type |
|
By end user |
|
By Region |
|
CHAPTER 1:INTRODUCTION
1.1.Report description
1.2.Key benefits for stakeholders
1.3.Key market segments
1.4.Research methodology
1.4.1.Primary research
1.4.2.Secondary research
1.4.3.Analyst tools and models
CHAPTER 2:EXECUTIVE SUMMARY
2.1.Key findings
2.2.CXO perspective
CHAPTER 3:MARKET OVERVIEW
3.1.Market definition and scope
3.2.Key Findings
3.2.1. Top investment pockets
3.3.Value chain analysis
3.4.Patent analysis
3.5.Market dynamics
3.5.1.Drivers
3.5.1.1.Increase in energy efficiency
3.5.1.2.Availability of finances and subsidies
3.5.1.3. Acceptance in residential sector
3.5.2.Restraints
3.5.2.1.High technological costs
3.5.2.2. Information barriers and uncertainty regarding technological performance
3.5.3.Opportunity
3.5.3.1.Integration of renewable energy
3.5.3.2. Electrification of transportation and commercial buildings
3.7.Impact of government regulations on the market
3.8.Impact of COVID-19 outbreak on the market
CHAPTER 4:ENERGY AS A SERVICE MARKET, BY SERVICE
4.1.Overview
4.1.1.Market size and forecast
4.2.Energy supply services
4.2.1.Key market trends, growth factors, and opportunities
4.2.2.Market size and forecast, by region
4.2.3.Comparative share analysis, by country
4.3.Maintenance & operation
4.3.1.Key market trends, growth factors, and opportunities
4.3.2.Market size and forecast, by region
4.3.3.Comparative share analysis, by country
4.4.Energy efficiency & optimization
4.4.1.Key market trends, growth factors, and opportunities
4.4.2.Market size and forecast, by region
4.4.3.Comparative share analysis, by country
4.5.Others
4.5.1.Key market trends, growth factors, and opportunities
4.5.2.Market size and forecast, by region
4.5.3.Comparative share analysis, by country
CHAPTER 5:ENERGY AS A SERVICE MARKET, BY END USE
5.1.Overview
5.1.1.Market size and forecast
5.2.Industrial
5.2.1.Key market trends, growth factors, and opportunities
5.2.2.Market size and forecast, by region
5.2.3.Comparative Share Analysis, by Country
5.3.Commercial
5.3.1.Key market trends, growth factors, and opportunities
5.3.2.Market size and forecast, by region
5.3.3.Comparative share Analysis, by country
CHAPTER 6:ENERGY AS A SERVICE MARKET, BY REGION
6.1.Overview
6.1.1.Market size and forecast, by region
6.2.North America
6.2.1.Key market trends, growth factors, and opportunities
6.2.2.Market size and forecast, by service
6.2.3.Market size and forecast, by end use
6.2.4.Market analysis, by country
6.2.4.1.U.S.
6.2.4.1.1.Market size and forecast, by service
6.2.4.1.2.Market size and forecast, by end use
6.2.4.2.Canada
6.2.4.2.1.Market size and forecast, by service
6.2.4.2.2.Market size and forecast, by end use
6.2.4.3.Mexico
6.2.4.3.1.Market size and forecast, by service
6.2.4.3.2.Market size and forecast, by end use
6.3.Europe
6.3.1.Key market trends, growth factors, and opportunities
6.3.2.Market size and forecast, by service
6.3.3.Market size and forecast, by end use
6.3.4.Market analysis, by country
6.3.4.1.Germany
6.3.4.1.1.Market size and forecast, by service
6.3.4.1.2.Market size and forecast, by end use
6.3.4.2.France
6.3.4.2.1.Market size and forecast, by service
6.3.4.2.2.Market size and forecast, by end use
6.3.4.3.Italy
6.3.4.3.1.Market size and forecast, by service
6.3.4.3.2.Market size and forecast, by end use
6.3.4.4.Spain
6.3.4.4.1.Market size and forecast, by service
6.3.4.4.2.Market size and forecast, by end use
6.3.4.5.UK
6.3.4.5.1.Market size and forecast, by service
6.3.4.5.2.Market size and forecast, by end use
6.3.4.6.Rest of Europe
6.3.4.6.1.Market size and forecast, by service
6.3.4.6.2.Market size and forecast, by end use
6.4.Asia-Pacific
6.4.1.Key market trends, growth factors, and opportunities
6.4.2.Market size and forecast, by service
6.4.3.Market size and forecast, by end use
6.4.4.Market analysis, by country
6.4.4.1.China
6.4.4.1.1.Market size and forecast, by service
6.4.4.1.2.Market size and forecast, by end use
6.4.4.2.Japan
6.4.4.2.1.Market size and forecast, by service
6.4.4.2.2.Market size and forecast, by end use
6.4.4.3.India
6.4.4.3.1.Market size and forecast, by service
6.4.4.3.2.Market size and forecast, by end use
6.4.4.4.South Korea
6.4.4.4.1.Market size and forecast, by service
6.4.4.4.2.Market size and forecast, by end use
6.4.4.5.Australia
6.4.4.5.1.Market size and forecast, by service
6.4.4.5.2.Market size and forecast, by end use
6.4.4.6.Rest of Asia Pacific
6.4.4.6.1.Market size and forecast, by service
6.4.4.6.2.Market size and forecast, by end use
6.5.LAMEA
6.5.1.Key market trends, growth factors, and opportunities
6.5.2.Market size and forecast, by service
6.5.3.Market size and forecast, by end use
6.5.4.Market analysis, by country
6.5.4.1.Brazil
6.5.4.1.1.Market size and forecast, by service
6.5.4.1.2.Market size and forecast, by end use
6.5.4.2.Saudi Arabia
6.5.4.2.1.Market size and forecast, by service
6.5.4.2.2.Market size and forecast, by end use
6.5.4.3.South Africa
6.5.4.3.1.Market size and forecast, by service
6.5.4.3.2.Market size and forecast, by end use
6.5.4.4.Rest of LAMEA
6.5.4.4.1.Market size and forecast, by service
6.5.4.4.2.Market size and forecast, by end use
CHAPTER 7:COMPETITIVE LANDSCAPE
7.1.Introduction
7.1.1.Market Player Positioning, 2020
7.2.Top winning strategies
7.2.1.Top winning strategies, by year
7.2.2.Top winning strategies, by development
7.2.3.Top winning strategies, by company
7.3.Product Mapping of Top 10 Player
7.4.Competitive Heatmap
7.5.Key developments
7.5.1.New product launch
7.5.2.Acquisitions
7.5.3.Partnerships
7.5.4.Business expansions
CHAPTER 8:COMPANY PROFILES
8.1.ALPIQ
8.1.1.Company overview
8.1.2.Key executives
8.1.3.Company snapshot
8.1.4.Operating business segments
8.1.5.Product portfolio
8.1.6.Business performance
8.1.7.Key strategic moves and developments
8.2.EDF RENEWABLES, INC.
8.2.1.Company overview
8.2.2.Key executives
8.2.3.Company snapshot
8.2.4.Product portfolio
8.2.5.Key strategic moves and developments
8.3.ENEL X
8.3.1.Company overview
8.3.2.Key executives
8.3.3.Company snapshot
8.3.4.Product portfolio
8.3.5.Business performance
8.3.6.Key strategic moves and developments
8.4.ENGIE
8.4.1.Company overview
8.4.2.Key executives
8.4.3.Company snapshot
8.4.4.Operating business segments
8.4.5.Product portfolio
8.4.6.R&D expenditure
8.4.7.Business performance
8.4.8.Key strategic moves and developments
8.5.GENERAL ELECTRIC
8.5.1.Company overview
8.5.2.Key executives
8.5.3.Company snapshot
8.5.4.Operating business segments
8.5.5.Product portfolio
8.5.6.R&D expenditure
8.5.7.Business performance
8.6.HONEYWELL169
8.6.1.Company overview
8.6.2.Key executives
8.6.3.Company snapshot
8.6.4.Operating business segments
8.6.5.Product portfolio
8.6.6.R&D expenditure
8.6.7.Business performance
8.6.8.Key strategic moves and developments
8.7.JOHNSON CONTROLS
8.7.1.Company overview
8.7.2.Key executives
8.7.3.Company snapshot
8.7.4.Operating business segments
8.7.5.Product portfolio
8.7.6.R&D expenditure
8.7.7.Business performance
8.7.8.Key strategic moves and developments
8.8.SCHNEIDER ELECTRIC
8.8.1.Company overview
8.8.2.Key executives
8.8.3.Company snapshot
8.8.4.Operating business segments
8.8.5.Product portfolio
8.8.6.R&D expenditure
8.8.7.Business performance
8.8.8.Key strategic moves and developments
8.9.VEOLIA
8.9.1.Company overview
8.9.2.Key executives
8.9.3.Company snapshot
8.9.4.Operating business segments
8.9.5.Product portfolio
8.9.6.R&D expenditure
8.9.7.Business performance
8.9.8.Key strategic moves and developments
8.10.WGL ENERGY
8.10.1.Company overview
8.10.2.Key executives
8.10.3.Company snapshot
8.10.4.Product portfolio
8.10.5.Business performance
8.10.6.Key strategic moves and developments
LIST OF TABLES
TABLE 01.ENERGY AS A SERVICE MARKET, BY SERVICE, 2020–2030 ($MILLION)
TABLE 02.ENERGY SUPPLY SERVICES MARKET, BY REGION, 2020–2030 ($MILLION)
TABLE 03.MAINTENANCE & OPERATION MARKET, BY REGION, 2020–2030 ($MILLION)
TABLE 04.ENERGY EFFICIENCY & OPTIMIZATION MARKET, BY REGION, 2020–2030 ($MILLION)
TABLE 05.ENERGY AS A SERVICE MARKET FOR OTHERS, BY REGION, 2020–2030 ($MILLION)
TABLE 06.ENERGY AS A SERVICE MARKET, BY END USE, 2020–2030 ($MILLION)
TABLE 07.ENERGY AS A SERVICE MARKET FOR INDUSTRIAL, BY REGION, 2020–2030 ($MILLION)
TABLE 08.ENERGY AS A SERVICE MARKET FOR COMMERCIAL, BY REGION, 2020–2030 ($MILLION)
TABLE 09.ENERGY AS A SERVICE MARKET, BY REGION, 2020-2030 ($MILLION)
TABLE 10.NORTH AMERICA ENERGY AS A SERVICE MARKET, BY SERVICE, 2020-2030 ($MILLION)
TABLE 11.NORTH AMERICA ENERGY AS A SERVICE MARKET, BY END USE, 2020-2030 ($MILLION)
TABLE 12.NORTH AMERICA ENERGY AS A SERVICE MARKET, BY COUNTRY, 2020-2030 ($MILLION)
TABLE 13.U.S. ENERGY AS A SERVICE MARKET, BY SERVICE, 2020-2030 ($MILLION)
TABLE 14.U.S. ENERGY AS A SERVICE MARKET, BY END USE, 2020-2030 ($MILLION)
TABLE 15.CANADA ENERGY AS A SERVICE MARKET, BY SERVICE, 2020-2030 ($MILLION)
TABLE 16.CANADA ENERGY AS A SERVICE MARKET, BY END USE, 2020-2030 ($MILLION)
TABLE 17.MEXICO ENERGY AS A SERVICE MARKET, BY SERVICE, 2020-2030 ($MILLION)
TABLE 18.MEXICO ENERGY AS A SERVICE MARKET, BY END USE, 2020-2030 ($MILLION)
TABLE 19.EUROPE ENERGY AS A SERVICE MARKET, BY SERVICE, 2020-2030 ($MILLION)
TABLE 20.EUROPE ENERGY AS A SERVICE MARKET, BY END USE, 2020-2030 ($MILLION)
TABLE 21.EUROPE ENERGY AS A SERVICE MARKET, BY COUNTRY, 2020-2030 ($MILLION)
TABLE 22.GERMANY ENERGY AS A SERVICE MARKET, BY SERVICE, 2020-2030 ($MILLION)
TABLE 23.GERMANY ENERGY AS A SERVICE MARKET, BY END USE, 2020-2030 ($MILLION)
TABLE 24.FRANCE ENERGY AS A SERVICE MARKET, BY SERVICE, 2020-2030 ($MILLION)
TABLE 25.FRANCE ENERGY AS A SERVICE MARKET, BY END USE, 2020-2030 ($MILLION)
TABLE 26.ITALY ENERGY AS A SERVICE MARKET, BY SERVICE, 2020-2030 ($MILLION)
TABLE 27.ITALY ENERGY AS A SERVICE MARKET, BY END USE, 2020-2030 ($MILLION)
TABLE 28.SPAIN ENERGY AS A SERVICE MARKET, BY SERVICE, 2020-2030 ($MILLION)
TABLE 29.SPAIN ENERGY AS A SERVICE MARKET, BY END USE, 2020-2030 ($MILLION)
TABLE 30.UK ENERGY AS A SERVICE MARKET, BY SERVICE, 2020-2030 ($MILLION)
TABLE 31.UK ENERGY AS A SERVICE MARKET, BY END USE, 2020-2030 ($MILLION)
TABLE 32.REST OF EUROPE ENERGY AS A SERVICE MARKET, BY SERVICE, 2020-2030 ($MILLION)
TABLE 33.REST OF EUROPE ENERGY AS A SERVICE MARKET, BY END USE, 2020-2030 ($MILLION)
TABLE 34.ASIA-PACIFIC ENERGY AS A SERVICE MARKET, BY SERVICE, 2020-2030 ($MILLION)
TABLE 35.ASIA-PACIFIC ENERGY AS A SERVICE MARKET, BY END USE, 2020-2030 ($MILLION)
TABLE 36.ASIA-PACIFIC ENERGY AS A SERVICE MARKET, BY COUNTRY, 2020-2030 ($MILLION)
TABLE 37.CHINA ENERGY AS A SERVICE MARKET, BY SERVICE, 2020-2030 ($MILLION)
TABLE 38.CHINA ENERGY AS A SERVICE MARKET, BY END USE, 2020-2030 ($MILLION)
TABLE 39.JAPAN ENERGY AS A SERVICE MARKET, BY SERVICE, 2020-2030 ($MILLION)
TABLE 40.JAPAN ENERGY AS A SERVICE MARKET, BY END USE, 2020-2030 ($MILLION)
TABLE 41.INDIA ENERGY AS A SERVICE MARKET, BY SERVICE, 2020-2030 ($MILLION)
TABLE 42.INDIA ENERGY AS A SERVICE MARKET, BY END USE, 2020-2030 ($MILLION)
TABLE 43.SOUTH KOREA ENERGY AS A SERVICE MARKET, BY SERVICE, 2020-2030 ($MILLION)
TABLE 44.SOUTH KOREA ENERGY AS A SERVICE MARKET, BY END USE, 2020-2030 ($MILLION)
TABLE 45.AUSTRALIA ENERGY AS A SERVICE MARKET, BY SERVICE, 2020-2030 ($MILLION)
TABLE 46.AUSTRALIA ENERGY AS A SERVICE MARKET, BY END USE, 2020-2030 ($MILLION)
TABLE 47.REST OF ASIA-PACIFIC ENERGY AS A SERVICE MARKET, BY SERVICE, 2020-2030 ($MILLION)
TABLE 48.REST OF ASIA-PACIFIC ENERGY AS A SERVICE MARKET, BY END USE, 2020-2030 ($MILLION)
TABLE 49.LAMEA ENERGY AS A SERVICE MARKET, BY SERVICE, 2020-2030 ($MILLION)
TABLE 50.LAMEA ENERGY AS A SERVICE MARKET, BY ENDE USE, 2020-2030 ($MILLION)
TABLE 51.LAMEA ENERGY AS A SERVICE MARKET, BY COUNTRY, 2020-2030 ($MILLION)
TABLE 52.BRAZIL ENERGY AS A SERVICE MARKET, BY SERVICE, 2020-2030 ($MILLION)
TABLE 53.BRAZIL ENERGY AS A SERVICE MARKET, BY END USE, 2020-2030 ($MILLION)
TABLE 54.SAUDI ARABIA ENERGY AS A SERVICE MARKET, BY SERVICE, 2020-2030 ($MILLION)
TABLE 55.SAUDI ARABIA ENERGY AS A SERVICE MARKET, BY END USE, 2020-2030 ($MILLION)
TABLE 56.SOUTH AFRICA ENERGY AS A SERVICE MARKET, BY SERVICE, 2020-2030 ($MILLION)
TABLE 57.SOUTH AFRICA ENERGY AS A SERVICE MARKET, BY END USE, 2020-2030 ($MILLION)
TABLE 58.REST OF LAMEA ENERGY AS A SERVICE MARKET, BY SERVICE, 2020-2030 ($MILLION)
TABLE 59.REST OF LAMEA ENERGY AS A SERVICE MARKET, BY END USE, 2020-2030 ($MILLION)
TABLE 60.KEY NEW PRODUCT LAUNCH (2016-2021)
TABLE 61.KEY ACQUISITIONS (2016-2021)
TABLE 62.KEY PARTNERSHIPS (2016-2021)
TABLE 63.KEY BUSINESS EXPANSIONS (2016-2021)
TABLE 64.ALPIQ: KEY EXECUTIVES
TABLE 65.ALPIQ: COMPANY SNAPSHOT
TABLE 66.ALPIQ: OPERATING SEGMENTS
TABLE 67.ALPIQ: PRODUCT PORTFOLIO
TABLE 68.ALPIQ: NET SALES, 2018–2020 ($MILLION)
TABLE 69.EDF RENEWABLES, INC.: KEY EXECUTIVES
TABLE 70.EDF RENEWABLES, INC.: COMPANY SNAPSHOT
TABLE 71.EDF RENEWABLES, INC.: PRODUCT PORTFOLIO
TABLE 72.ENEL X: KEY EXECUTIVES
TABLE 73.ENEL X: COMPANY SNAPSHOT
TABLE 74.ENEL X: PRODUCT PORTFOLIO
TABLE 75.ENEL X NET SALES, 2018–2020 ($MILLION)
TABLE 76.ENGIE: KEY EXECUTIVES
TABLE 77.ENGIE: COMPANY SNAPSHOT
TABLE 78.ENGIE: OPERATING SEGMENTS
TABLE 79.ENGIE: PRODUCT PORTFOLIO
TABLE 80.ENGIE: R&D EXPENDITURE, 2018–2020 ($MILLION)
TABLE 81.ENGIE: NET SALES, 2018–2020 ($MILLION)
TABLE 82.GENERAL ELECTRIC: KEY EXECUTIVES
TABLE 83.GENERAL ELECTRIC: COMPANY SNAPSHOT
TABLE 84.GENERAL ELECTRIC: OPERATING SEGMENTS
TABLE 85.GENERAL ELECTRIC: PRODUCT PORTFOLIO
TABLE 86.GENERAL ELECTRIC: R&D EXPENDITURE, 2018–2020 ($MILLION)
TABLE 87.GENERAL ELECTRIC: NET SALES, 2018–2020 ($MILLION)
TABLE 88.HONEYWELL: KEY EXECUTIVES
TABLE 89.HONEYWELL: COMPANY SNAPSHOT
TABLE 90.HONEYWELL: OPERATING SEGMENTS
TABLE 91.HONEYWELL: PRODUCT PORTFOLIO
TABLE 92.HONEYWELL: R&D EXPENDITURE, 2018–2020 ($MILLION)
TABLE 93.HONEYWELL: NET SALES, 2018–2020 ($MILLION)
TABLE 94.JOHNSON CONTROLS: KEY EXECUTIVES
TABLE 95.JOHNSON CONTROLS: COMPANY SNAPSHOT
TABLE 96.JOHNSON CONTROLS: OPERATING SEGMENTS
TABLE 97.JOHNSON CONTROLS: PRODUCT PORTFOLIO
TABLE 98.JOHNSON CONTROLS: R&D EXPENDITURE, 2018–2020 ($MILLION)
TABLE 99.JOHNSON CONTROLS: NET SALES, 2018–2020 ($MILLION)
TABLE 100.SCHNEIDER ELECTRIC: KEY EXECUTIVES
TABLE 101.SCHNEIDER ELECTRIC: COMPANY SNAPSHOT
TABLE 102.SCHNEIDER ELECTRIC: OPERATING SEGMENTS
TABLE 103.SCHNEIDER ELECTRIC: PRODUCT PORTFOLIO
TABLE 104.SCHNEIDER ELECTRIC: R&D EXPENDITURE, 2018–2020 ($MILLION)
TABLE 105.SCHNEIDER ELECTRIC: NET SALES, 2018–2020 ($MILLION)
TABLE 106.VEOLIA: KEY EXECUTIVES
TABLE 107.VEOLIA: COMPANY SNAPSHOT
TABLE 108.VEOLIA: OPERATING SEGMENTS
TABLE 109.VEOLIA: PRODUCT PORTFOLIO
TABLE 110.VEOLIA: R&D EXPENDITURE, 2018–2020 ($MILLION)
TABLE 111.VEOLIA: NET SALES, 2018–2020 ($MILLION)
TABLE 112.WGL ENERGY: KEY EXECUTIVES
TABLE 114.WGL ENERGY: COMPANY SNAPSHOT
TABLE 115.WGL ENERGY: PRODUCT PORTFOLIO
LIST OF FIGURES
FIGURE 01.KEY MARKET SEGMENTS
FIGURE 02.ENERGY AS A SERVICE MARKET SNAPSHOT, BY SEGMENTATION, 2020–2030
FIGURE 03.ENERGY AS A SERVICE MARKET SNAPSHOT, BY COUNTRY, 2020–2030
FIGURE 04.TOP INVESTMENT POCKETS
FIGURE 05.HIGH BARGAINING POWER OF SUPPLIERS
FIGURE 06.HIGH THREAT OF NEW ENTRANTS
FIGURE 07.HIGH THREAT OF SUBSTITUTES
FIGURE 08.HIGH INTENSITY OF RIVALRY
FIGURE 09.LOW BARGAINING POWER OF BUYERS
FIGURE 10.PATENT ANALYSIS FOR ENERGY AS A SERVICE
FIGURE 11.ENERGY AS A SERVICE MARKET DYNAMICS
FIGURE 12.VALUE CHAIN ANALYSIS FOR ENERGY AS A SERVICE MARKET
FIGURE 13.ENERGY AS A SERVICE MARKET, BY SERVICE, 2021–2030 ($MILLION)
FIGURE 14.COMPARATIVE ANALYSIS OF ENERGY SUPPLY SERVICES MARKET, BY COUNTRY, 2021 & 2030 ($MILLION)
FIGURE 15.COMPARATIVE ANALYSIS OF MAINTENANCE AND OPERATION MARKET, BY COUNTRY, 2021 & 2030 ($MILLION)
FIGURE 16.COMPARATIVE ANALYSIS OF ENERGY EFFICIENCY AND OPTIMIZATION MARKET, BY COUNTRY,
2021 & 2030 ($MILLION)
FIGURE 17.COMPARATIVE ANALYSIS OF OTHERS MARKET, BY COUNTRY, 2021 & 2030 ($MILLION)
FIGURE 18.ENERGY AS A SERVICE MARKET, BY END USE, 2021–2030 ($MILLION)
FIGURE 19.COMPARATIVE ANALYSIS OF ENERGY AS A SERVICE MARKET FOR INDUSTRIAL, BY COUNTRY,
2021 & 2030 ($MILLION)
FIGURE 20.COMPARATIVE ANALYSIS OF ENERGY AS A SERVICE MARKET FOR COMMERCIAL, BY COUNTRY, 2021 & 2030 ($MILLION)
FIGURE 21.U.S. ENERGY AS A SERVICE MARKET REVENUE, 2020–2030 ($MILLION)
FIGURE 22.CANADA ENERGY AS A SERVICE MARKET REVENUE, 2020–2030 ($MILLION)
FIGURE 23.MEXICO ENERGY AS A SERVICE MARKET REVENUE, 2020–2030 ($MILLION)
FIGURE 24.GERMANY ENERGY AS A SERVICE MARKET REVENUE, 2020–2030 ($MILLION)
FIGURE 25.FRANCE ENERGY AS A SERVICE MARKET REVENUE, 2020–2030 ($MILLION)
FIGURE 26.ITALY ENERGY AS A SERVICE MARKET REVENUE, 2020–2030 ($MILLION)
FIGURE 27.SPAIN ENERGY AS A SERVICE MARKET REVENUE, 2020–2030 ($MILLION)
FIGURE 28.UK ENERGY AS A SERVICE MARKET REVENUE, 2020–2030 ($MILLION)
FIGURE 29.REST OF EUROPE ENERGY AS A SERVICE MARKET REVENUE, 2020–2030 ($MILLION)
FIGURE 30.CHINA ENERGY AS A SERVICE MARKET REVENUE, 2020–2030 ($MILLION)
FIGURE 31.JAPAN ENERGY AS A SERVICE MARKET REVENUE, 2020–2030 ($MILLION)
FIGURE 32.INDIA ENERGY AS A SERVICE MARKET REVENUE, 2020–2030 ($MILLION)
FIGURE 33.SOUTH KOREA ENERGY AS A SERVICE MARKET REVENUE, 2020–2030 ($MILLION)
FIGURE 34.AUSTRALIA ENERGY AS A SERVICE MARKET REVENUE, 2020–2030 ($MILLION)
FIGURE 35.REST OF ASIA-PACIFIC ENERGY AS A SERVICE MARKET REVENUE, 2020–2030 ($MILLION)
FIGURE 36.BRAZIL ENERGY AS A SERVICE MARKET REVENUE, 2020–2030 ($MILLION)
FIGURE 37.SAUDI ARABIA ENERGY AS A SERVICE MARKET REVENUE, 2020–2030 ($MILLION)
FIGURE 38.SOUTH AFRICA ENERGY AS A SERVICE MARKET REVENUE, 2020–2030 ($MILLION)
FIGURE 39.REST OF LAMEA ENERGY AS A SERVICE MARKET REVENUE, 2020–2030 ($MILLION)
FIGURE 40.VEOLIA: R&D EXPENDITURE, 2018–2020 ($MILLION)
FIGURE 41.VEOLIA: NET SALES, 2018–2020 ($MILLION)
FIGURE 42.VEOLIA: REVENUE SHARE BY SEGMENT, 2020 (%)
FIGURE 43.VEOLIA: REVENUE SHARE BY REGION, 2020 (%)
FIGURE 44.HONEYWELL: R&D EXPENDITURE, 2018–2020 ($MILLION)
FIGURE 45.HONEYWELL: NET SALES, 2018–2020 ($MILLION)
FIGURE 46.HONEYWELL: REVENUE SHARE BY REGION, 2020 (%)
FIGURE 47.ENEL X: NET SALES, 2018–2020 ($MILLION)
FIGURE 48.SCHNEIDER ELECTRIC: R&D EXPENDITURE, 2018–2020 ($MILLION)
FIGURE 49.SCHNEIDER ELECTRIC: NET SALES, 2018–2020 ($MILLION)
FIGURE 50.SCHNEIDER ELECTRIC: REVENUE SHARE BY SEGMENT, 2020 (%)
FIGURE 51.SCHNEIDER ELECTRIC: REVENUE SHARE BY REGION, 2020 (%)
FIGURE 52.ENGIE: R&D EXPENDITURE, 2018–2020 ($MILLION)
FIGURE 53.ENGIE: NET SALES, 2018–2020 ($MILLION)
FIGURE 54.ENGIE: REVENUE SHARE BY SEGMENT, 2020 (%)
FIGURE 55.ENGIE: REVENUE SHARE BY REGION, 2020 (%)
FIGURE 56.JOHNSON CONTROLS: R&D EXPENDITURE, 2018–2020 ($MILLION)
FIGURE 57.JOHNSON CONTROLS: NET SALES, 2018–2020 ($MILLION)
FIGURE 58.JOHNSON CONTROLS: REVENUE SHARE BY SEGMENT, 2020 (%)
FIGURE 59.JOHNSON CONTROLS: REVENUE SHARE BY REGION, 2020 (%)
FIGURE 60.ALPIQ: NET SALES, 2018–2020 ($MILLION)
FIGURE 61.ALPIQ: REVENUE SHARE BY SEGMENT, 2020 (%)
FIGURE 62.ALPIQ: REVENUE SHARE BY REGION, 2020 (%)
FIGURE 63.GENERAL ELECTRIC: R&D EXPENDITURE, 2018–2020 ($MILLION)
FIGURE 64.GENERAL ELECTRIC: NET SALES, 2018–2020 ($MILLION)
FIGURE 65.GENERAL ELECTRIC: REVENUE SHARE BY SEGMENT, 2020 (%)
FIGURE 66.GENERAL ELECTRIC: REVENUE SHARE BY REGION, 2020 (%)
This section provides opinions of top-level CXOs operating in the energy as a service market. According to the insights of CXOs, the market is consolidated in nature, and is expected to grow at a significant rate during the forecast period. This is attributed to rise in awareness toward benefits of EaaS projects such as increased energy efficiency and government subsidies. Moreover, increase in distributed energy resources, decreasing cost of renewable power generation, and storage solutions also contributes toward the market growth. However, information barriers and high technological costs involved in EaaS projects discourages the market growth. The market growth for EaaS is expected to grow at a notable pace as many governments are working on action plans with targets to achieve energy efficiency and contribute toward environment-friendly methods in quest to reduce carbon footprint. This section provides opinions of top-level CXOs operating in the energy as a service market. According to the insights of CXOs, the market is consolidated in nature, and is expected to grow at a significant rate during the forecast period. This is attributed to rise in awareness toward benefits of EaaS projects such as increased energy efficiency and government subsidies. Moreover, increase in distributed energy resources, decreasing cost of renewable power generation, and storage solutions also contributes toward the market growth. However, information barriers and high technological costs involved in EaaS projects discourages the market growth. The market growth for EaaS is expected to grow at a notable pace as many governments are working on action plans with targets to achieve energy efficiency and contribute toward environment-friendly methods in quest to reduce carbon footprint.
A. Energy, Commercial, Residential, and Agriculture are the potential customers of Energy as a Service industry.
A. Partnership and agreement are the key growth strategy for Energy as a Service Market player in order to attract the end users.
A. To get latest version of Energy as a Service market report can be obtained on demand from the website.
A. Asia-Pacific will provide more business opportunities for Energy as a Service in future.
A. Akrema Group, Advanced Nanotech Lab, Diamon-Fusion International Inc., Fenzi SpA, Koninklijke DSM N.V, Nanoman, Nanopool GmbH, PPG Industries Inc., Unelko Corporation, and 3M.
A. The top ten market players are selected based on two key attributes - competitive strength and market positioning
A. Commercial segment holds the maximum share of the Energy as a Service Market.
A. Increase in surge in applications with widespread usage of solar energy as an alternative for conventional power generation and the support policies and the investment of the government and private organisations to promote solar energy are the driving factors and opportunities in the Energy as a Service Market.
A. Increase in demand for power due to increase in innovation of extensive power consuming electronic products led to the development of solar energy and this current trend expected to influence the Energy as a Service Market in the next few years.
A. Rise in demand for electricity from commercial applications such as restaurants, educational institutes, data centers, commercial complexes, and warehouses.
Start reading instantly.
This Report and over 66,782+ more Reports, Available with Avenue Library. T&C*.
Enterprise
License/PDF
Library
Membership
*Taxes/Fees, if applicable will be added during checkout. All prices in USD
To ensure high-level data integrity, accurate analysis, and impeccable forecasts
For complete satisfaction
On-demand customization of scope of the report to exactly meet your needs
Targeted market view to provide pertinent information and save time of readers
Get insights on topics that are crucial for your business. Stay abreast of your interest areas.
Get Industry Data AlertsTo ensure high-level data integrity, accurate analysis, and impeccable forecasts
For complete satisfaction
On-demand customization of scope of the report to exactly meet your needs
Targeted market view to provide pertinent information and save time of readers