0
2023
Ergonomic Chair Market

Ergonomic Chair Market

by Product Type (Swivel Chair, Adjustable chair, Fixed Chair, Others), by Seat Material (Fabric, Mesh, Leather, Others), by End Users (Residential, Commercial), by Distribution Channel (E commerce, Specialty Store, Hypermarket and Supermarket, Others): Global Opportunity Analysis and Industry Forecast, 2022-2031

Report Code: A12927
Feb 2023 | Pages: 250
Tables: 194
Charts: 75
  • Formats*:

  • pdf

    Single User License, Five User
    License & Enterprise User License

  • xls

    Data Pack Excel License

  • ppt

    It comes with the additional cost
    of $2500.00 contact sales.


Ergonomic Chair Market Research, 2031

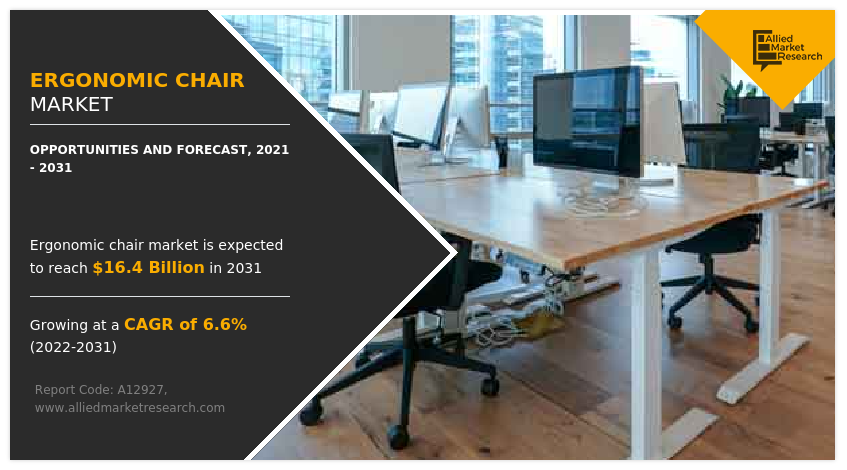
The global ergonomic chair market was valued at $8.5 billion in 2021, and is projected to reach $16.4 billion by 2031, growing at a CAGR of 6.6% from 2022 to 2031.

Ergonomic chairs are becoming more popular in the workplace as they are designed to promote good posture and reduce stress on the body. As users prioritize and invest in ergonomic office furniture, it will surge the ergonomic chair market growth.

Ergonomic Chair Market

The ergonomic chair market is segmented into Product Type, Seat Material, End Users and Distribution Channel.

The ergonomic chair market refers to the market for chair specifically designed to promote correct posture and reduce stress on the body. These chairs are commonly used in office environments but are becoming increasingly popular in other environments such as home offices and schools. The ergonomic chair industry, which encompasses a wide range of products from basic task chairs to high-end executive chairs, is driven by factors such as increasing awareness of the importance of ergonomics, the shift to working from home, and advances in technology and materials.In recent years, the use of ergonomic products such as chairs, desks and keyboards has increased in various settings. The use of ergonomic products in offices and workplaces is increasing as companies recognize the importance of ergonomic seating and equipment to employee comfort and productivity. Many companies are now investing in ergonomic chairs, desks, and keyboard trays to prevent musculoskeletal disorders and improve employee health. Ergonomic products are also becoming popular in healthcare environments such as hospitals and clinics. This is due to the realization that ergonomic seating and equipment can prevent healthcare worker fatigue and injury and improve patient care.
Schools and colleges are also beginning to introduce ergonomic products in their classrooms, libraries, and computer labs. This is due to the recognition that ergonomic seating can improve student comfort and learning. The trend of working from home has increased the demand for ergonomic products for the home office. People who work from home invest in ergonomic chairs and desks to avoid the discomfort and fatigue of sitting for long periods of time.

Ergonomic products like gaming chairs, desks, and keyboard trays are becoming more and more popular among gamers. These products are designed to provide comfort and support for long gaming sessions. Overall, the use of ergonomic products in a variety of settings is increasing as people realize the benefits that ergonomic seating and equipment bring to their comfort, productivity, and well-being.

Moreover, increasing awareness about the importance of ergonomics in the workplace is one of the key drivers of the ergonomic chair industry. Ergonomics is the study of how people interact with their environment, and it is becoming increasingly clear that ergonomic design can have a significant impact on employee health and productivity. By reducing stress on the body and promoting good posture, ergonomic chairs can help to prevent musculoskeletal disorders (MSDs) such as back pain and repetitive strain injuries. This is particularly important as more people are spending long hours sitting in front of a computer, which can exacerbate existing health problems and lead to new ones.

Another factor boosting demand in the ergonomic chair market is the shift to telecommuting. As more companies adopt remote work policies, employees are increasingly working from home and setting up home offices, which provide comfortable, supportive homes such as ergonomic chairs. His office furniture is in high demand.

In addition to these drivers, the ergonomic chair market size is also driven by advances in technology and materials. Today's ergonomic chairs are often made from quality materials such as mesh and breathable fabrics designed to keep the occupant cool and comfortable. It also has a wide range of features such as adjustable lumbar support, adjustable armrests and a reclining mechanism that can be adjusted to suit the user's specific needs.

Despite the growth of the ergonomic chair market share, there are also some challenges such as the high cost of ergonomic chairs which may be a barrier for some businesses and individuals. Additionally, the market for ergonomic chairs is not standardized, which can make it difficult for consumers to compare different products and make an informed decision.

As ergonomic design becomes more mainstream, there is a growing demand for innovative and advanced ergonomic chairs that offer better support and comfort. Companies that invest in research and development to create new and improved ergonomic chairs can differentiate themselves from their competitors and tap into this growing market. Additionally, there is a niche market for ergonomic chairs developed for specific industries and user groups, such as healthcare and gaming. Companies that specialize in these niches can differentiate themselves from their competitors and capitalize on these opportunities.

The market is also growing due to increased awareness of the importance of ergonomics in the workplace, the shift to remote work, and advances in technology and materials. The market for ergonomic chairs is expected to continue to grow as more companies prioritize employee well-being and invest in ergonomic office furniture. Despite the challenges, the market is expected to continue to perform well during the forecast period.

The market for ergonomic chairs has grown in recent years due to growing awareness of the importance of ergonomics in the workplace and the potential health benefits of using ergonomic chairs. The trend is expected to continue as more companies prioritize employee health and invest in ergonomic office furniture. Additionally, the shift to remote work and the need for comfortable home office furniture are also likely to contribute to the continued growth of the ergonomic chair market demand.

In addition, the OSHA Ergonomics Program Management Guidelines for Meat Processing Plants provides employers with information on how to identify and avoid ergonomic hazards in the meat processing industry. NIOSH also has a page on Ergonomics and Musculoskeletal Disorders (MSD) that provides information and resources for preventing injury and disability in the ergonomic workplace, including information on office ergonomics and computer workstations.

The Occupational Safety and Health Administration (OSHA) recommends using an ergonomic chair to prevent musculoskeletal disorders (MSD) from prolonged sitting. They suggest that an ergonomic chair should be customizable to the individual user and provide adequate support for the back, arms, and legs. The American Physical Therapy Association (APTA) also recommends supports the use of ergonomic chairs. They recommend that the chair should be adjustable to fit the individual user, provide lumbar support and allow for proper posture.

The University of California, San Diego conducted a study on the effects of ergonomic interventions, such as the use of ergonomic chairs, on the incidence of low back pain. The study found that ergonomic interventions, including the use of ergonomic chairs, were effective in reducing the incidence of low back pain among office workers. Another study by the Center for Health, Work & Environment at the University of Colorado found that the use of ergonomic chairs resulted in a significant reduction in reported pain and discomfort among office workers.

Many companies that manufacture ergonomic chairs are making new efforts to increase their market share. This includes developing innovative new products, improving manufacturing processes to reduce costs, and investing in marketing and advertising campaigns to increase brand awareness. Additionally, many companies are adopting sustainability and environmentally friendly manufacturing practices to appeal to consumers who prioritize these values.

The global ergonomic chair market forecast based on product type, seat material, end users, distribution channel, and region. According to product type, the market is categorized into Swivel Chair, Adjustable chair, Fixed chair, and others. Depending on seat material, the ergonomic chair market is fragmented into the fabric, mesh, leather, and others. As end users, it is divided into residential and commercial. On the distribution channel market is segmented into E-commerce, specialty store, hypermarket and supermarket, and others. Region-wise, the market is analyzed across North America (the U.S., Canada, and Mexico), Europe (Germany, UK, France, Russia, France, Spain, Italy, and the rest of Europe), Asia-Pacific (China, Japan, South Korea, India, Australia, and rest of Asia-Pacific), and LAMEA (Brazil, Chile, Argentina, Saudi Arabia, South Africa, and rest of LAMEA).
Ergonomic Chair Market

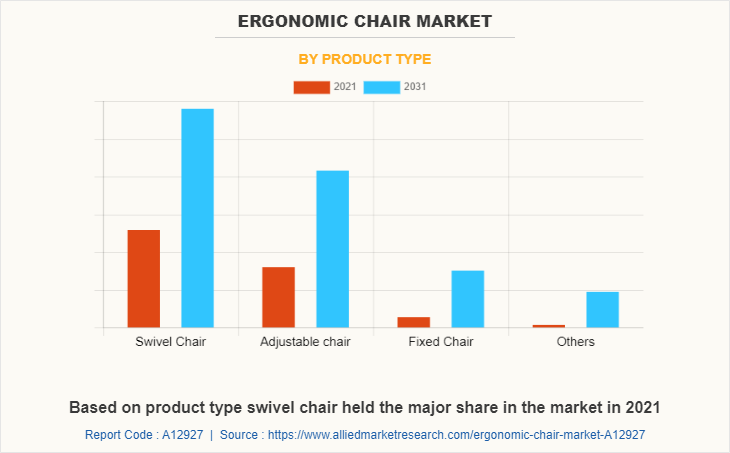
Based on product type, swivel chair held the major share in the market. Swivel chairs include adjustability, material, ergonomics, and durability. In terms of adjustability, chairs may have height adjustment, tilt, and recline functions, lumbar support, armrests, and headrests. However, the adjustable chair segment is projected to manifest the highest CAGR from 2022 to 2031. The market trend for ergonomic adjustable chairs has been growing steadily in recent years, driven by increasing awareness of the importance of ergonomics in the workplace, and the rise of remote work and the gig economy.
Ergonomic Chair Market

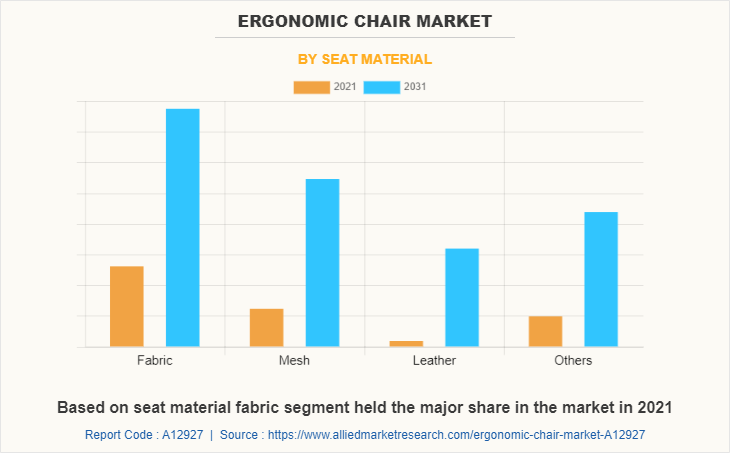
On the basis of seat material, the fabric segment held the major share in the ergonomic chair market and is expected to dominate during the forecast period. Fabric material ergonomic chairs typically include design, material, adjustability, and durability. In terms of design, fabric material ergonomic chairs may have a traditional, contemporary, or modern style. However, the mesh segment is projected to manifest the highest CAGR from 2022 to 2031.
Ergonomic Chair Market

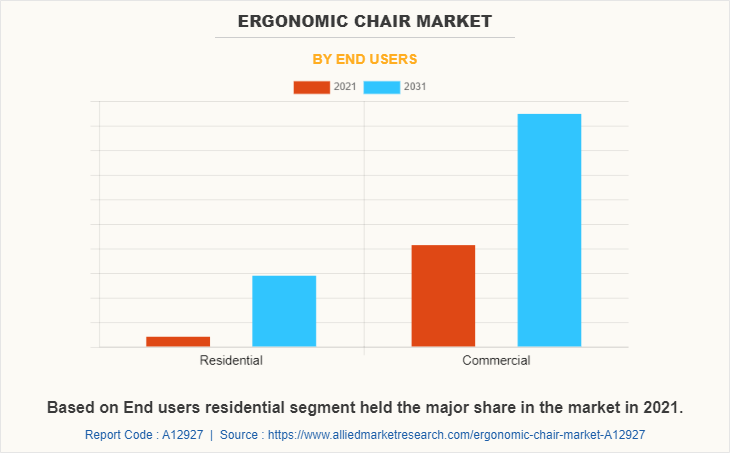
Based on end users, commercial segment held the major share in the ergonomic chair market. The market trend for ergonomic commercial chairs includes a focus on adjustability, ergonomics, sustainability, and multi-functionality, and there is an increasing demand for chairs that can be easily adjusted to fit the user's specific needs and promote proper posture. However, the residential segment is projected to manifest the highest CAGR from 2022 to 2031. The durability of residential ergonomic chairs is influenced by the choice of material and the quality of construction. High-quality materials and construction methods can ensure that the chair can withstand frequent use and last for a longer period.
Ergonomic Chair Market

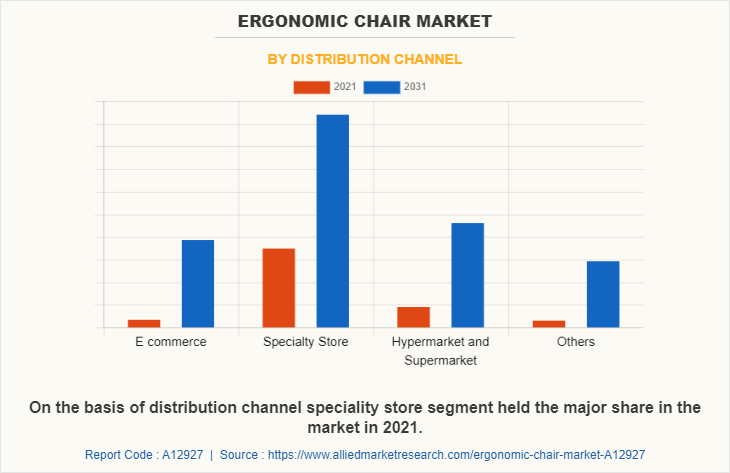
On the basis of distribution channel, specialty store segment held the major share in the market. The specialty store market for ergonomic chairs has grown in recent years due to the growing awareness of the health and comfort benefits of ergonomic products. Demand for ergonomic office furniture, ergonomic computer accessories, and ergonomic home products is increasing as more and more people spend more time in front of their computers at home. However, e-commerce segment is witnessing the highest CAGR from 2022 to 2031.
Ergonomic Chair Market

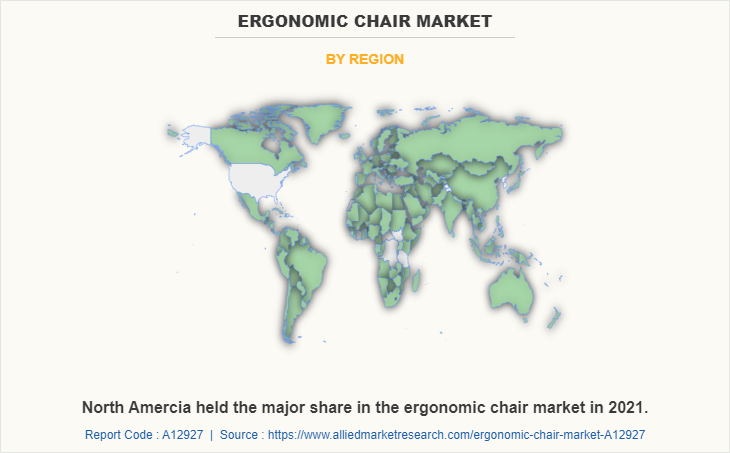
North America held the major share in the ergonomic chair market. The use of innovative technologies such as smart sensors, adjustable lumbar support, and adjustable armrests has increased the popularity of ergonomic chairs. However, the Asia-Pacific region is projected to manifest the highest CAGR from 2022 to 2031. In terms of market growth, the Asia-Pacific ergonomic chair market is expected to continue to grow rapidly in the coming years, driven by the increasing demand for ergonomic chairs in both residential and commercial settings, and the growing trend towards sustainable and eco-friendly products.

The major players operating in the global ergonomic chair are Steelcase Inc., Branch Office, Inc., MillerKnoll, Inc., Okamura Corporation, Bristol Technologies Sdn. Bhd., Huzhou Shenglong Furniture Co., Ltd., Haworth Inc., Featherlite, Nilkamal Limited, PSI Seating Ltd., Teknion Group, UE Furniture Co. Ltd, Kimball International, Inc., Eurotech Design Systems Pvt. Ltd, Jiangmen Shengshi Furniture Co., Ltd.

Key Benefits For Stakeholders

  • This report provides a quantitative analysis of the market segments, current trends, estimations, and dynamics of the ergonomic chair market analysis from 2021 to 2031 to identify the prevailing ergonomic chair market opportunities.
  • The market research is offered along with information related to key drivers, restraints, and opportunities.
  • Porter's five forces analysis highlights the potency of buyers and suppliers to enable stakeholders make profit-oriented business decisions and strengthen their supplier-buyer network.
  • In-depth analysis of the ergonomic chair market segmentation assists to determine the prevailing market opportunities.
  • Major countries in each region are mapped according to their revenue contribution to the global market.
  • Market player positioning facilitates benchmarking and provides a clear understanding of the present position of the market players.
  • The report includes the analysis of the regional as well as global ergonomic chair market trends, key players, market segments, application areas, and market growth strategies.

Ergonomic Chair Market Report Highlights

Aspects Details
Market Size By 2031 USD 16.4 billion
Growth Rate CAGR of 6.6%
Forecast period 2021 - 2031
Report Pages 250
By Product Type
  • Fixed Chair
  • Others
  • Swivel Chair
  • Adjustable chair
By Seat Material
  • Fabric
  • Mesh
  • Leather
  • Others
By End Users
  • Residential
  • Commercial
By Distribution Channel
  • E commerce
  • Specialty Store
  • Hypermarket and Supermarket
  • Others
By Region
  • North America  (U.S., Canada, Mexico)
  • Europe  (Germany, UK, France, Russia, Spain, Italy, Rest of Europe)
  • Asia-Pacific  (China, Japan, India, South Korea, Australia, Rest of Asia-Pacific)
  • LAMEA  (Brazil, Chile, Argentina, Saudi Arabia, South Africa, Rest of LAMEA)
Key Market Players Huzhou Shenglong Furniture Co., Ltd., PSI Seating Ltd., MillerKnoll, Inc., Kimball International, Inc., Haworth Inc., Teknion Group, Nilkamal Limited, Bristol Technologies Sdn. Bhd., Steelcase Inc., Featherlite, UE Furniture Co. Ltd, Jiangmen Shengshi Furniture Co., Ltd., Branch Office, Inc., Eurotech Design Systems Pvt. Ltd, Okamura Corporation

Analyst Review

A recent innovation in the ergonomic chair market is the use of dynamic seating. This type of chair uses technology such as air cushions, flexible materials, and adjustable supports to allow the chair to move and adapt to the user's movements throughout the day. This reduces pressure on specific areas of the body, improving posture and blood circulation. Another innovation is the use of intelligent sensors and tracking technology that can monitor the user's posture and provide feedback on how to adjust the chair for optimal comfort and support.

The rapid pace of urbanization, the increase in single and dual-living households, and the rise in the trend of a classy yet compact ergonomic chair for enhancing overall household aesthetics support the adoption of folding furniture. Additionally, minimal use of sustainable materials and online retailing of furniture also boosts the market demand among the various income groups. The trend of online shopping substantially influences the ergonomic chair market. Operating players in this market prefer to sell their products through e-commerce platforms for maximizing reach. Tie-ups between chair manufacturers are another trend gaining popularity in the industry and are acting as an emerging sales channel for the manufacturers.

 
  • CHAPTER 1: INTRODUCTION

    • 1.1. Report description

    • 1.2. Key market segments

    • 1.3. Key benefits to the stakeholders

    • 1.4. Research Methodology

      • 1.4.1. Primary research

      • 1.4.2. Secondary research

      • 1.4.3. Analyst tools and models

  • CHAPTER 2: EXECUTIVE SUMMARY

    • 2.1. CXO Perspective

  • CHAPTER 3: MARKET OVERVIEW

    • 3.1. Market definition and scope

    • 3.2. Key findings

      • 3.2.1. Top impacting factors

      • 3.2.2. Top investment pockets

    • 3.3. Porter’s five forces analysis

      • 3.3.1. Moderate threat of new entrants

      • 3.3.2. Moderate threat of substitutes

      • 3.3.3. Moderate intensity of rivalry

      • 3.3.4. Moderate bargaining power of buyers

      • 3.3.5. Moderate bargaining power of suppliers

    • 3.4. Market dynamics

      • 3.4.1. Drivers

        • 3.4.1.1. The shift towards working from home has increased demand for ergonomic chairs
        • 3.4.1.2. Growing awareness of ergonomic benefits

      • 3.4.2. Restraints

        • 3.4.2.1. Ergonomic chairs are often more expensive than traditional chairs
        • 3.4.2.2. Limited availability of the ergonomic chair in the market

      • 3.4.3. Opportunities

        • 3.4.3.1. Increase in a sedentary lifestyle
        • 3.4.3.2. Technological advancements

    • 3.5. COVID-19 Impact Analysis on the market

  • CHAPTER 4: ERGONOMIC CHAIR MARKET, BY PRODUCT TYPE

    • 4.1. Overview

      • 4.1.1. Market size and forecast

    • 4.2. Swivel Chair

      • 4.2.1. Key market trends, growth factors and opportunities

      • 4.2.2. Market size and forecast, by region

      • 4.2.3. Market share analysis by country

    • 4.3. Adjustable chair

      • 4.3.1. Key market trends, growth factors and opportunities

      • 4.3.2. Market size and forecast, by region

      • 4.3.3. Market share analysis by country

    • 4.4. Fixed Chair

      • 4.4.1. Key market trends, growth factors and opportunities

      • 4.4.2. Market size and forecast, by region

      • 4.4.3. Market share analysis by country

    • 4.5. Others

      • 4.5.1. Key market trends, growth factors and opportunities

      • 4.5.2. Market size and forecast, by region

      • 4.5.3. Market share analysis by country

  • CHAPTER 5: ERGONOMIC CHAIR MARKET, BY SEAT MATERIAL

    • 5.1. Overview

      • 5.1.1. Market size and forecast

    • 5.2. Fabric

      • 5.2.1. Key market trends, growth factors and opportunities

      • 5.2.2. Market size and forecast, by region

      • 5.2.3. Market share analysis by country

    • 5.3. Mesh

      • 5.3.1. Key market trends, growth factors and opportunities

      • 5.3.2. Market size and forecast, by region

      • 5.3.3. Market share analysis by country

    • 5.4. Leather

      • 5.4.1. Key market trends, growth factors and opportunities

      • 5.4.2. Market size and forecast, by region

      • 5.4.3. Market share analysis by country

    • 5.5. Others

      • 5.5.1. Key market trends, growth factors and opportunities

      • 5.5.2. Market size and forecast, by region

      • 5.5.3. Market share analysis by country

  • CHAPTER 6: ERGONOMIC CHAIR MARKET, BY END USERS

    • 6.1. Overview

      • 6.1.1. Market size and forecast

    • 6.2. Residential

      • 6.2.1. Key market trends, growth factors and opportunities

      • 6.2.2. Market size and forecast, by region

      • 6.2.3. Market share analysis by country

    • 6.3. Commercial

      • 6.3.1. Key market trends, growth factors and opportunities

      • 6.3.2. Market size and forecast, by region

      • 6.3.3. Market share analysis by country

  • CHAPTER 7: ERGONOMIC CHAIR MARKET, BY DISTRIBUTION CHANNEL

    • 7.1. Overview

      • 7.1.1. Market size and forecast

    • 7.2. E commerce

      • 7.2.1. Key market trends, growth factors and opportunities

      • 7.2.2. Market size and forecast, by region

      • 7.2.3. Market share analysis by country

    • 7.3. Specialty Store

      • 7.3.1. Key market trends, growth factors and opportunities

      • 7.3.2. Market size and forecast, by region

      • 7.3.3. Market share analysis by country

    • 7.4. Hypermarket and Supermarket

      • 7.4.1. Key market trends, growth factors and opportunities

      • 7.4.2. Market size and forecast, by region

      • 7.4.3. Market share analysis by country

    • 7.5. Others

      • 7.5.1. Key market trends, growth factors and opportunities

      • 7.5.2. Market size and forecast, by region

      • 7.5.3. Market share analysis by country

  • CHAPTER 8: ERGONOMIC CHAIR MARKET, BY REGION

    • 8.1. Overview

      • 8.1.1. Market size and forecast By Region

    • 8.2. North America

      • 8.2.1. Key trends and opportunities

      • 8.2.2. Market size and forecast, by Product Type

      • 8.2.3. Market size and forecast, by Seat Material

      • 8.2.4. Market size and forecast, by End Users

      • 8.2.5. Market size and forecast, by Distribution Channel

      • 8.2.6. Market size and forecast, by country

        • 8.2.6.1. U.S.
          • 8.2.6.1.1. Key market trends, growth factors and opportunities
          • 8.2.6.1.2. Market size and forecast, by Product Type
          • 8.2.6.1.3. Market size and forecast, by Seat Material
          • 8.2.6.1.4. Market size and forecast, by End Users
          • 8.2.6.1.5. Market size and forecast, by Distribution Channel
        • 8.2.6.2. Canada
          • 8.2.6.2.1. Key market trends, growth factors and opportunities
          • 8.2.6.2.2. Market size and forecast, by Product Type
          • 8.2.6.2.3. Market size and forecast, by Seat Material
          • 8.2.6.2.4. Market size and forecast, by End Users
          • 8.2.6.2.5. Market size and forecast, by Distribution Channel
        • 8.2.6.3. Mexico
          • 8.2.6.3.1. Key market trends, growth factors and opportunities
          • 8.2.6.3.2. Market size and forecast, by Product Type
          • 8.2.6.3.3. Market size and forecast, by Seat Material
          • 8.2.6.3.4. Market size and forecast, by End Users
          • 8.2.6.3.5. Market size and forecast, by Distribution Channel
    • 8.3. Europe

      • 8.3.1. Key trends and opportunities

      • 8.3.2. Market size and forecast, by Product Type

      • 8.3.3. Market size and forecast, by Seat Material

      • 8.3.4. Market size and forecast, by End Users

      • 8.3.5. Market size and forecast, by Distribution Channel

      • 8.3.6. Market size and forecast, by country

        • 8.3.6.1. Germany
          • 8.3.6.1.1. Key market trends, growth factors and opportunities
          • 8.3.6.1.2. Market size and forecast, by Product Type
          • 8.3.6.1.3. Market size and forecast, by Seat Material
          • 8.3.6.1.4. Market size and forecast, by End Users
          • 8.3.6.1.5. Market size and forecast, by Distribution Channel
        • 8.3.6.2. UK
          • 8.3.6.2.1. Key market trends, growth factors and opportunities
          • 8.3.6.2.2. Market size and forecast, by Product Type
          • 8.3.6.2.3. Market size and forecast, by Seat Material
          • 8.3.6.2.4. Market size and forecast, by End Users
          • 8.3.6.2.5. Market size and forecast, by Distribution Channel
        • 8.3.6.3. France
          • 8.3.6.3.1. Key market trends, growth factors and opportunities
          • 8.3.6.3.2. Market size and forecast, by Product Type
          • 8.3.6.3.3. Market size and forecast, by Seat Material
          • 8.3.6.3.4. Market size and forecast, by End Users
          • 8.3.6.3.5. Market size and forecast, by Distribution Channel
        • 8.3.6.4. Russia
          • 8.3.6.4.1. Key market trends, growth factors and opportunities
          • 8.3.6.4.2. Market size and forecast, by Product Type
          • 8.3.6.4.3. Market size and forecast, by Seat Material
          • 8.3.6.4.4. Market size and forecast, by End Users
          • 8.3.6.4.5. Market size and forecast, by Distribution Channel
        • 8.3.6.5. Spain
          • 8.3.6.5.1. Key market trends, growth factors and opportunities
          • 8.3.6.5.2. Market size and forecast, by Product Type
          • 8.3.6.5.3. Market size and forecast, by Seat Material
          • 8.3.6.5.4. Market size and forecast, by End Users
          • 8.3.6.5.5. Market size and forecast, by Distribution Channel
        • 8.3.6.6. Italy
          • 8.3.6.6.1. Key market trends, growth factors and opportunities
          • 8.3.6.6.2. Market size and forecast, by Product Type
          • 8.3.6.6.3. Market size and forecast, by Seat Material
          • 8.3.6.6.4. Market size and forecast, by End Users
          • 8.3.6.6.5. Market size and forecast, by Distribution Channel
        • 8.3.6.7. Rest of Europe
          • 8.3.6.7.1. Key market trends, growth factors and opportunities
          • 8.3.6.7.2. Market size and forecast, by Product Type
          • 8.3.6.7.3. Market size and forecast, by Seat Material
          • 8.3.6.7.4. Market size and forecast, by End Users
          • 8.3.6.7.5. Market size and forecast, by Distribution Channel
    • 8.4. Asia-Pacific

      • 8.4.1. Key trends and opportunities

      • 8.4.2. Market size and forecast, by Product Type

      • 8.4.3. Market size and forecast, by Seat Material

      • 8.4.4. Market size and forecast, by End Users

      • 8.4.5. Market size and forecast, by Distribution Channel

      • 8.4.6. Market size and forecast, by country

        • 8.4.6.1. China
          • 8.4.6.1.1. Key market trends, growth factors and opportunities
          • 8.4.6.1.2. Market size and forecast, by Product Type
          • 8.4.6.1.3. Market size and forecast, by Seat Material
          • 8.4.6.1.4. Market size and forecast, by End Users
          • 8.4.6.1.5. Market size and forecast, by Distribution Channel
        • 8.4.6.2. Japan
          • 8.4.6.2.1. Key market trends, growth factors and opportunities
          • 8.4.6.2.2. Market size and forecast, by Product Type
          • 8.4.6.2.3. Market size and forecast, by Seat Material
          • 8.4.6.2.4. Market size and forecast, by End Users
          • 8.4.6.2.5. Market size and forecast, by Distribution Channel
        • 8.4.6.3. India
          • 8.4.6.3.1. Key market trends, growth factors and opportunities
          • 8.4.6.3.2. Market size and forecast, by Product Type
          • 8.4.6.3.3. Market size and forecast, by Seat Material
          • 8.4.6.3.4. Market size and forecast, by End Users
          • 8.4.6.3.5. Market size and forecast, by Distribution Channel
        • 8.4.6.4. South Korea
          • 8.4.6.4.1. Key market trends, growth factors and opportunities
          • 8.4.6.4.2. Market size and forecast, by Product Type
          • 8.4.6.4.3. Market size and forecast, by Seat Material
          • 8.4.6.4.4. Market size and forecast, by End Users
          • 8.4.6.4.5. Market size and forecast, by Distribution Channel
        • 8.4.6.5. Australia
          • 8.4.6.5.1. Key market trends, growth factors and opportunities
          • 8.4.6.5.2. Market size and forecast, by Product Type
          • 8.4.6.5.3. Market size and forecast, by Seat Material
          • 8.4.6.5.4. Market size and forecast, by End Users
          • 8.4.6.5.5. Market size and forecast, by Distribution Channel
        • 8.4.6.6. Rest of Asia-Pacific
          • 8.4.6.6.1. Key market trends, growth factors and opportunities
          • 8.4.6.6.2. Market size and forecast, by Product Type
          • 8.4.6.6.3. Market size and forecast, by Seat Material
          • 8.4.6.6.4. Market size and forecast, by End Users
          • 8.4.6.6.5. Market size and forecast, by Distribution Channel
    • 8.5. LAMEA

      • 8.5.1. Key trends and opportunities

      • 8.5.2. Market size and forecast, by Product Type

      • 8.5.3. Market size and forecast, by Seat Material

      • 8.5.4. Market size and forecast, by End Users

      • 8.5.5. Market size and forecast, by Distribution Channel

      • 8.5.6. Market size and forecast, by country

        • 8.5.6.1. Brazil
          • 8.5.6.1.1. Key market trends, growth factors and opportunities
          • 8.5.6.1.2. Market size and forecast, by Product Type
          • 8.5.6.1.3. Market size and forecast, by Seat Material
          • 8.5.6.1.4. Market size and forecast, by End Users
          • 8.5.6.1.5. Market size and forecast, by Distribution Channel
        • 8.5.6.2. Chile
          • 8.5.6.2.1. Key market trends, growth factors and opportunities
          • 8.5.6.2.2. Market size and forecast, by Product Type
          • 8.5.6.2.3. Market size and forecast, by Seat Material
          • 8.5.6.2.4. Market size and forecast, by End Users
          • 8.5.6.2.5. Market size and forecast, by Distribution Channel
        • 8.5.6.3. Argentina
          • 8.5.6.3.1. Key market trends, growth factors and opportunities
          • 8.5.6.3.2. Market size and forecast, by Product Type
          • 8.5.6.3.3. Market size and forecast, by Seat Material
          • 8.5.6.3.4. Market size and forecast, by End Users
          • 8.5.6.3.5. Market size and forecast, by Distribution Channel
        • 8.5.6.4. Saudi Arabia
          • 8.5.6.4.1. Key market trends, growth factors and opportunities
          • 8.5.6.4.2. Market size and forecast, by Product Type
          • 8.5.6.4.3. Market size and forecast, by Seat Material
          • 8.5.6.4.4. Market size and forecast, by End Users
          • 8.5.6.4.5. Market size and forecast, by Distribution Channel
        • 8.5.6.5. South Africa
          • 8.5.6.5.1. Key market trends, growth factors and opportunities
          • 8.5.6.5.2. Market size and forecast, by Product Type
          • 8.5.6.5.3. Market size and forecast, by Seat Material
          • 8.5.6.5.4. Market size and forecast, by End Users
          • 8.5.6.5.5. Market size and forecast, by Distribution Channel
        • 8.5.6.6. Rest of LAMEA
          • 8.5.6.6.1. Key market trends, growth factors and opportunities
          • 8.5.6.6.2. Market size and forecast, by Product Type
          • 8.5.6.6.3. Market size and forecast, by Seat Material
          • 8.5.6.6.4. Market size and forecast, by End Users
          • 8.5.6.6.5. Market size and forecast, by Distribution Channel
  • CHAPTER 9: COMPETITIVE LANDSCAPE

    • 9.1. Introduction

    • 9.2. Top winning strategies

    • 9.3. Product Mapping of Top 10 Player

    • 9.4. Competitive Dashboard

    • 9.5. Competitive Heatmap

    • 9.6. Top player positioning, 2021

  • CHAPTER 10: COMPANY PROFILES

    • 10.1. Steelcase Inc.

      • 10.1.1. Company overview

      • 10.1.2. Key Executives

      • 10.1.3. Company snapshot

      • 10.1.4. Operating business segments

      • 10.1.5. Product portfolio

      • 10.1.6. Business performance

      • 10.1.7. Key strategic moves and developments

    • 10.2. Branch Office, Inc.

      • 10.2.1. Company overview

      • 10.2.2. Key Executives

      • 10.2.3. Company snapshot

      • 10.2.4. Operating business segments

      • 10.2.5. Product portfolio

      • 10.2.6. Key strategic moves and developments

    • 10.3. MillerKnoll, Inc.

      • 10.3.1. Company overview

      • 10.3.2. Key Executives

      • 10.3.3. Company snapshot

      • 10.3.4. Operating business segments

      • 10.3.5. Product portfolio

      • 10.3.6. Business performance

      • 10.3.7. Key strategic moves and developments

    • 10.4. Okamura Corporation

      • 10.4.1. Company overview

      • 10.4.2. Key Executives

      • 10.4.3. Company snapshot

      • 10.4.4. Operating business segments

      • 10.4.5. Product portfolio

      • 10.4.6. Business performance

      • 10.4.7. Key strategic moves and developments

    • 10.5. Bristol Technologies Sdn. Bhd.

      • 10.5.1. Company overview

      • 10.5.2. Key Executives

      • 10.5.3. Company snapshot

      • 10.5.4. Operating business segments

      • 10.5.5. Product portfolio

    • 10.6. Jiangmen Shengshi Furniture Co., Ltd.

      • 10.6.1. Company overview

      • 10.6.2. Key Executives

      • 10.6.3. Company snapshot

      • 10.6.4. Operating business segments

      • 10.6.5. Product portfolio

    • 10.7. Huzhou Shenglong Furniture Co., Ltd.

      • 10.7.1. Company overview

      • 10.7.2. Key Executives

      • 10.7.3. Company snapshot

      • 10.7.4. Operating business segments

      • 10.7.5. Product portfolio

    • 10.8. Haworth Inc.

      • 10.8.1. Company overview

      • 10.8.2. Key Executives

      • 10.8.3. Company snapshot

      • 10.8.4. Operating business segments

      • 10.8.5. Product portfolio

    • 10.9. Eurotech Design Systems Pvt. Ltd

      • 10.9.1. Company overview

      • 10.9.2. Key Executives

      • 10.9.3. Company snapshot

      • 10.9.4. Operating business segments

      • 10.9.5. Product portfolio

    • 10.10. Featherlite

      • 10.10.1. Company overview

      • 10.10.2. Key Executives

      • 10.10.3. Company snapshot

      • 10.10.4. Operating business segments

      • 10.10.5. Product portfolio

    • 10.11. Nilkamal Limited

      • 10.11.1. Company overview

      • 10.11.2. Key Executives

      • 10.11.3. Company snapshot

      • 10.11.4. Operating business segments

      • 10.11.5. Product portfolio

      • 10.11.6. Business performance

      • 10.11.7. Key strategic moves and developments

    • 10.12. PSI Seating Ltd.

      • 10.12.1. Company overview

      • 10.12.2. Key Executives

      • 10.12.3. Company snapshot

      • 10.12.4. Operating business segments

      • 10.12.5. Product portfolio

    • 10.13. Teknion Group

      • 10.13.1. Company overview

      • 10.13.2. Key Executives

      • 10.13.3. Company snapshot

      • 10.13.4. Operating business segments

      • 10.13.5. Product portfolio

    • 10.14. UE Furniture Co. Ltd

      • 10.14.1. Company overview

      • 10.14.2. Key Executives

      • 10.14.3. Company snapshot

      • 10.14.4. Operating business segments

      • 10.14.5. Product portfolio

      • 10.14.6. Key strategic moves and developments

    • 10.15. Kimball International, Inc.

      • 10.15.1. Company overview

      • 10.15.2. Key Executives

      • 10.15.3. Company snapshot

      • 10.15.4. Operating business segments

      • 10.15.5. Product portfolio

      • 10.15.6. Business performance

      • 10.15.7. Key strategic moves and developments

  • LIST OF TABLES

  • TABLE 01. GLOBAL ERGONOMIC CHAIR MARKET, BY PRODUCT TYPE, 2021-2031 ($MILLION)
    TABLE 02. ERGONOMIC CHAIR MARKET FOR SWIVEL CHAIR, BY REGION, 2021-2031 ($MILLION)
    TABLE 03. ERGONOMIC CHAIR MARKET FOR ADJUSTABLE CHAIR, BY REGION, 2021-2031 ($MILLION)
    TABLE 04. ERGONOMIC CHAIR MARKET FOR FIXED CHAIR, BY REGION, 2021-2031 ($MILLION)
    TABLE 05. ERGONOMIC CHAIR MARKET FOR OTHERS, BY REGION, 2021-2031 ($MILLION)
    TABLE 06. GLOBAL ERGONOMIC CHAIR MARKET, BY SEAT MATERIAL, 2021-2031 ($MILLION)
    TABLE 07. ERGONOMIC CHAIR MARKET FOR FABRIC, BY REGION, 2021-2031 ($MILLION)
    TABLE 08. ERGONOMIC CHAIR MARKET FOR MESH, BY REGION, 2021-2031 ($MILLION)
    TABLE 09. ERGONOMIC CHAIR MARKET FOR LEATHER, BY REGION, 2021-2031 ($MILLION)
    TABLE 10. ERGONOMIC CHAIR MARKET FOR OTHERS, BY REGION, 2021-2031 ($MILLION)
    TABLE 11. GLOBAL ERGONOMIC CHAIR MARKET, BY END USERS, 2021-2031 ($MILLION)
    TABLE 12. ERGONOMIC CHAIR MARKET FOR RESIDENTIAL, BY REGION, 2021-2031 ($MILLION)
    TABLE 13. ERGONOMIC CHAIR MARKET FOR COMMERCIAL, BY REGION, 2021-2031 ($MILLION)
    TABLE 14. GLOBAL ERGONOMIC CHAIR MARKET, BY DISTRIBUTION CHANNEL, 2021-2031 ($MILLION)
    TABLE 15. ERGONOMIC CHAIR MARKET FOR E COMMERCE, BY REGION, 2021-2031 ($MILLION)
    TABLE 16. ERGONOMIC CHAIR MARKET FOR SPECIALTY STORE, BY REGION, 2021-2031 ($MILLION)
    TABLE 17. ERGONOMIC CHAIR MARKET FOR HYPERMARKET AND SUPERMARKET, BY REGION, 2021-2031 ($MILLION)
    TABLE 18. ERGONOMIC CHAIR MARKET FOR OTHERS, BY REGION, 2021-2031 ($MILLION)
    TABLE 19. ERGONOMIC CHAIR MARKET, BY REGION, 2021-2031 ($MILLION)
    TABLE 20. NORTH AMERICA ERGONOMIC CHAIR MARKET, BY PRODUCT TYPE, 2021-2031 ($MILLION)
    TABLE 21. NORTH AMERICA ERGONOMIC CHAIR MARKET, BY SEAT MATERIAL, 2021-2031 ($MILLION)
    TABLE 22. NORTH AMERICA ERGONOMIC CHAIR MARKET, BY END USERS, 2021-2031 ($MILLION)
    TABLE 23. NORTH AMERICA ERGONOMIC CHAIR MARKET, BY DISTRIBUTION CHANNEL, 2021-2031 ($MILLION)
    TABLE 24. NORTH AMERICA ERGONOMIC CHAIR MARKET, BY COUNTRY, 2021-2031 ($MILLION)
    TABLE 25. U.S. ERGONOMIC CHAIR MARKET, BY PRODUCT TYPE, 2021-2031 ($MILLION)
    TABLE 26. U.S. ERGONOMIC CHAIR MARKET, BY SEAT MATERIAL, 2021-2031 ($MILLION)
    TABLE 27. U.S. ERGONOMIC CHAIR MARKET, BY END USERS, 2021-2031 ($MILLION)
    TABLE 28. U.S. ERGONOMIC CHAIR MARKET, BY DISTRIBUTION CHANNEL, 2021-2031 ($MILLION)
    TABLE 29. CANADA ERGONOMIC CHAIR MARKET, BY PRODUCT TYPE, 2021-2031 ($MILLION)
    TABLE 30. CANADA ERGONOMIC CHAIR MARKET, BY SEAT MATERIAL, 2021-2031 ($MILLION)
    TABLE 31. CANADA ERGONOMIC CHAIR MARKET, BY END USERS, 2021-2031 ($MILLION)
    TABLE 32. CANADA ERGONOMIC CHAIR MARKET, BY DISTRIBUTION CHANNEL, 2021-2031 ($MILLION)
    TABLE 33. MEXICO ERGONOMIC CHAIR MARKET, BY PRODUCT TYPE, 2021-2031 ($MILLION)
    TABLE 34. MEXICO ERGONOMIC CHAIR MARKET, BY SEAT MATERIAL, 2021-2031 ($MILLION)
    TABLE 35. MEXICO ERGONOMIC CHAIR MARKET, BY END USERS, 2021-2031 ($MILLION)
    TABLE 36. MEXICO ERGONOMIC CHAIR MARKET, BY DISTRIBUTION CHANNEL, 2021-2031 ($MILLION)
    TABLE 37. EUROPE ERGONOMIC CHAIR MARKET, BY PRODUCT TYPE, 2021-2031 ($MILLION)
    TABLE 38. EUROPE ERGONOMIC CHAIR MARKET, BY SEAT MATERIAL, 2021-2031 ($MILLION)
    TABLE 39. EUROPE ERGONOMIC CHAIR MARKET, BY END USERS, 2021-2031 ($MILLION)
    TABLE 40. EUROPE ERGONOMIC CHAIR MARKET, BY DISTRIBUTION CHANNEL, 2021-2031 ($MILLION)
    TABLE 41. EUROPE ERGONOMIC CHAIR MARKET, BY COUNTRY, 2021-2031 ($MILLION)
    TABLE 42. GERMANY ERGONOMIC CHAIR MARKET, BY PRODUCT TYPE, 2021-2031 ($MILLION)
    TABLE 43. GERMANY ERGONOMIC CHAIR MARKET, BY SEAT MATERIAL, 2021-2031 ($MILLION)
    TABLE 44. GERMANY ERGONOMIC CHAIR MARKET, BY END USERS, 2021-2031 ($MILLION)
    TABLE 45. GERMANY ERGONOMIC CHAIR MARKET, BY DISTRIBUTION CHANNEL, 2021-2031 ($MILLION)
    TABLE 46. UK ERGONOMIC CHAIR MARKET, BY PRODUCT TYPE, 2021-2031 ($MILLION)
    TABLE 47. UK ERGONOMIC CHAIR MARKET, BY SEAT MATERIAL, 2021-2031 ($MILLION)
    TABLE 48. UK ERGONOMIC CHAIR MARKET, BY END USERS, 2021-2031 ($MILLION)
    TABLE 49. UK ERGONOMIC CHAIR MARKET, BY DISTRIBUTION CHANNEL, 2021-2031 ($MILLION)
    TABLE 50. FRANCE ERGONOMIC CHAIR MARKET, BY PRODUCT TYPE, 2021-2031 ($MILLION)
    TABLE 51. FRANCE ERGONOMIC CHAIR MARKET, BY SEAT MATERIAL, 2021-2031 ($MILLION)
    TABLE 52. FRANCE ERGONOMIC CHAIR MARKET, BY END USERS, 2021-2031 ($MILLION)
    TABLE 53. FRANCE ERGONOMIC CHAIR MARKET, BY DISTRIBUTION CHANNEL, 2021-2031 ($MILLION)
    TABLE 54. RUSSIA ERGONOMIC CHAIR MARKET, BY PRODUCT TYPE, 2021-2031 ($MILLION)
    TABLE 55. RUSSIA ERGONOMIC CHAIR MARKET, BY SEAT MATERIAL, 2021-2031 ($MILLION)
    TABLE 56. RUSSIA ERGONOMIC CHAIR MARKET, BY END USERS, 2021-2031 ($MILLION)
    TABLE 57. RUSSIA ERGONOMIC CHAIR MARKET, BY DISTRIBUTION CHANNEL, 2021-2031 ($MILLION)
    TABLE 58. SPAIN ERGONOMIC CHAIR MARKET, BY PRODUCT TYPE, 2021-2031 ($MILLION)
    TABLE 59. SPAIN ERGONOMIC CHAIR MARKET, BY SEAT MATERIAL, 2021-2031 ($MILLION)
    TABLE 60. SPAIN ERGONOMIC CHAIR MARKET, BY END USERS, 2021-2031 ($MILLION)
    TABLE 61. SPAIN ERGONOMIC CHAIR MARKET, BY DISTRIBUTION CHANNEL, 2021-2031 ($MILLION)
    TABLE 62. ITALY ERGONOMIC CHAIR MARKET, BY PRODUCT TYPE, 2021-2031 ($MILLION)
    TABLE 63. ITALY ERGONOMIC CHAIR MARKET, BY SEAT MATERIAL, 2021-2031 ($MILLION)
    TABLE 64. ITALY ERGONOMIC CHAIR MARKET, BY END USERS, 2021-2031 ($MILLION)
    TABLE 65. ITALY ERGONOMIC CHAIR MARKET, BY DISTRIBUTION CHANNEL, 2021-2031 ($MILLION)
    TABLE 66. REST OF EUROPE ERGONOMIC CHAIR MARKET, BY PRODUCT TYPE, 2021-2031 ($MILLION)
    TABLE 67. REST OF EUROPE ERGONOMIC CHAIR MARKET, BY SEAT MATERIAL, 2021-2031 ($MILLION)
    TABLE 68. REST OF EUROPE ERGONOMIC CHAIR MARKET, BY END USERS, 2021-2031 ($MILLION)
    TABLE 69. REST OF EUROPE ERGONOMIC CHAIR MARKET, BY DISTRIBUTION CHANNEL, 2021-2031 ($MILLION)
    TABLE 70. ASIA-PACIFIC ERGONOMIC CHAIR MARKET, BY PRODUCT TYPE, 2021-2031 ($MILLION)
    TABLE 71. ASIA-PACIFIC ERGONOMIC CHAIR MARKET, BY SEAT MATERIAL, 2021-2031 ($MILLION)
    TABLE 72. ASIA-PACIFIC ERGONOMIC CHAIR MARKET, BY END USERS, 2021-2031 ($MILLION)
    TABLE 73. ASIA-PACIFIC ERGONOMIC CHAIR MARKET, BY DISTRIBUTION CHANNEL, 2021-2031 ($MILLION)
    TABLE 74. ASIA-PACIFIC ERGONOMIC CHAIR MARKET, BY COUNTRY, 2021-2031 ($MILLION)
    TABLE 75. CHINA ERGONOMIC CHAIR MARKET, BY PRODUCT TYPE, 2021-2031 ($MILLION)
    TABLE 76. CHINA ERGONOMIC CHAIR MARKET, BY SEAT MATERIAL, 2021-2031 ($MILLION)
    TABLE 77. CHINA ERGONOMIC CHAIR MARKET, BY END USERS, 2021-2031 ($MILLION)
    TABLE 78. CHINA ERGONOMIC CHAIR MARKET, BY DISTRIBUTION CHANNEL, 2021-2031 ($MILLION)
    TABLE 79. JAPAN ERGONOMIC CHAIR MARKET, BY PRODUCT TYPE, 2021-2031 ($MILLION)
    TABLE 80. JAPAN ERGONOMIC CHAIR MARKET, BY SEAT MATERIAL, 2021-2031 ($MILLION)
    TABLE 81. JAPAN ERGONOMIC CHAIR MARKET, BY END USERS, 2021-2031 ($MILLION)
    TABLE 82. JAPAN ERGONOMIC CHAIR MARKET, BY DISTRIBUTION CHANNEL, 2021-2031 ($MILLION)
    TABLE 83. INDIA ERGONOMIC CHAIR MARKET, BY PRODUCT TYPE, 2021-2031 ($MILLION)
    TABLE 84. INDIA ERGONOMIC CHAIR MARKET, BY SEAT MATERIAL, 2021-2031 ($MILLION)
    TABLE 85. INDIA ERGONOMIC CHAIR MARKET, BY END USERS, 2021-2031 ($MILLION)
    TABLE 86. INDIA ERGONOMIC CHAIR MARKET, BY DISTRIBUTION CHANNEL, 2021-2031 ($MILLION)
    TABLE 87. SOUTH KOREA ERGONOMIC CHAIR MARKET, BY PRODUCT TYPE, 2021-2031 ($MILLION)
    TABLE 88. SOUTH KOREA ERGONOMIC CHAIR MARKET, BY SEAT MATERIAL, 2021-2031 ($MILLION)
    TABLE 89. SOUTH KOREA ERGONOMIC CHAIR MARKET, BY END USERS, 2021-2031 ($MILLION)
    TABLE 90. SOUTH KOREA ERGONOMIC CHAIR MARKET, BY DISTRIBUTION CHANNEL, 2021-2031 ($MILLION)
    TABLE 91. AUSTRALIA ERGONOMIC CHAIR MARKET, BY PRODUCT TYPE, 2021-2031 ($MILLION)
    TABLE 92. AUSTRALIA ERGONOMIC CHAIR MARKET, BY SEAT MATERIAL, 2021-2031 ($MILLION)
    TABLE 93. AUSTRALIA ERGONOMIC CHAIR MARKET, BY END USERS, 2021-2031 ($MILLION)
    TABLE 94. AUSTRALIA ERGONOMIC CHAIR MARKET, BY DISTRIBUTION CHANNEL, 2021-2031 ($MILLION)
    TABLE 95. REST OF ASIA-PACIFIC ERGONOMIC CHAIR MARKET, BY PRODUCT TYPE, 2021-2031 ($MILLION)
    TABLE 96. REST OF ASIA-PACIFIC ERGONOMIC CHAIR MARKET, BY SEAT MATERIAL, 2021-2031 ($MILLION)
    TABLE 97. REST OF ASIA-PACIFIC ERGONOMIC CHAIR MARKET, BY END USERS, 2021-2031 ($MILLION)
    TABLE 98. REST OF ASIA-PACIFIC ERGONOMIC CHAIR MARKET, BY DISTRIBUTION CHANNEL, 2021-2031 ($MILLION)
    TABLE 99. LAMEA ERGONOMIC CHAIR MARKET, BY PRODUCT TYPE, 2021-2031 ($MILLION)
    TABLE 100. LAMEA ERGONOMIC CHAIR MARKET, BY SEAT MATERIAL, 2021-2031 ($MILLION)
    TABLE 101. LAMEA ERGONOMIC CHAIR MARKET, BY END USERS, 2021-2031 ($MILLION)
    TABLE 102. LAMEA ERGONOMIC CHAIR MARKET, BY DISTRIBUTION CHANNEL, 2021-2031 ($MILLION)
    TABLE 103. LAMEA ERGONOMIC CHAIR MARKET, BY COUNTRY, 2021-2031 ($MILLION)
    TABLE 104. BRAZIL ERGONOMIC CHAIR MARKET, BY PRODUCT TYPE, 2021-2031 ($MILLION)
    TABLE 105. BRAZIL ERGONOMIC CHAIR MARKET, BY SEAT MATERIAL, 2021-2031 ($MILLION)
    TABLE 106. BRAZIL ERGONOMIC CHAIR MARKET, BY END USERS, 2021-2031 ($MILLION)
    TABLE 107. BRAZIL ERGONOMIC CHAIR MARKET, BY DISTRIBUTION CHANNEL, 2021-2031 ($MILLION)
    TABLE 108. CHILE ERGONOMIC CHAIR MARKET, BY PRODUCT TYPE, 2021-2031 ($MILLION)
    TABLE 109. CHILE ERGONOMIC CHAIR MARKET, BY SEAT MATERIAL, 2021-2031 ($MILLION)
    TABLE 110. CHILE ERGONOMIC CHAIR MARKET, BY END USERS, 2021-2031 ($MILLION)
    TABLE 111. CHILE ERGONOMIC CHAIR MARKET, BY DISTRIBUTION CHANNEL, 2021-2031 ($MILLION)
    TABLE 112. ARGENTINA ERGONOMIC CHAIR MARKET, BY PRODUCT TYPE, 2021-2031 ($MILLION)
    TABLE 113. ARGENTINA ERGONOMIC CHAIR MARKET, BY SEAT MATERIAL, 2021-2031 ($MILLION)
    TABLE 114. ARGENTINA ERGONOMIC CHAIR MARKET, BY END USERS, 2021-2031 ($MILLION)
    TABLE 115. ARGENTINA ERGONOMIC CHAIR MARKET, BY DISTRIBUTION CHANNEL, 2021-2031 ($MILLION)
    TABLE 116. SAUDI ARABIA ERGONOMIC CHAIR MARKET, BY PRODUCT TYPE, 2021-2031 ($MILLION)
    TABLE 117. SAUDI ARABIA ERGONOMIC CHAIR MARKET, BY SEAT MATERIAL, 2021-2031 ($MILLION)
    TABLE 118. SAUDI ARABIA ERGONOMIC CHAIR MARKET, BY END USERS, 2021-2031 ($MILLION)
    TABLE 119. SAUDI ARABIA ERGONOMIC CHAIR MARKET, BY DISTRIBUTION CHANNEL, 2021-2031 ($MILLION)
    TABLE 120. SOUTH AFRICA ERGONOMIC CHAIR MARKET, BY PRODUCT TYPE, 2021-2031 ($MILLION)
    TABLE 121. SOUTH AFRICA ERGONOMIC CHAIR MARKET, BY SEAT MATERIAL, 2021-2031 ($MILLION)
    TABLE 122. SOUTH AFRICA ERGONOMIC CHAIR MARKET, BY END USERS, 2021-2031 ($MILLION)
    TABLE 123. SOUTH AFRICA ERGONOMIC CHAIR MARKET, BY DISTRIBUTION CHANNEL, 2021-2031 ($MILLION)
    TABLE 124. REST OF LAMEA ERGONOMIC CHAIR MARKET, BY PRODUCT TYPE, 2021-2031 ($MILLION)
    TABLE 125. REST OF LAMEA ERGONOMIC CHAIR MARKET, BY SEAT MATERIAL, 2021-2031 ($MILLION)
    TABLE 126. REST OF LAMEA ERGONOMIC CHAIR MARKET, BY END USERS, 2021-2031 ($MILLION)
    TABLE 127. REST OF LAMEA ERGONOMIC CHAIR MARKET, BY DISTRIBUTION CHANNEL, 2021-2031 ($MILLION)
    TABLE 128. STEELCASE INC.: KEY EXECUTIVES
    TABLE 129. STEELCASE INC.: COMPANY SNAPSHOT
    TABLE 130. STEELCASE INC.: PRODUCT SEGMENTS
    TABLE 131. STEELCASE INC.: PRODUCT PORTFOLIO
    TABLE 132. STEELCASE INC.: KEY STRATERGIES
    TABLE 133. BRANCH OFFICE, INC.: KEY EXECUTIVES
    TABLE 134. BRANCH OFFICE, INC.: COMPANY SNAPSHOT
    TABLE 135. BRANCH OFFICE, INC.: PRODUCT SEGMENTS
    TABLE 136. BRANCH OFFICE, INC.: PRODUCT PORTFOLIO
    TABLE 137. BRANCH OFFICE, INC.: KEY STRATERGIES
    TABLE 138. MILLERKNOLL, INC.: KEY EXECUTIVES
    TABLE 139. MILLERKNOLL, INC.: COMPANY SNAPSHOT
    TABLE 140. MILLERKNOLL, INC.: PRODUCT SEGMENTS
    TABLE 141. MILLERKNOLL, INC.: PRODUCT PORTFOLIO
    TABLE 142. MILLERKNOLL, INC.: KEY STRATERGIES
    TABLE 143. OKAMURA CORPORATION: KEY EXECUTIVES
    TABLE 144. OKAMURA CORPORATION: COMPANY SNAPSHOT
    TABLE 145. OKAMURA CORPORATION: PRODUCT SEGMENTS
    TABLE 146. OKAMURA CORPORATION: PRODUCT PORTFOLIO
    TABLE 147. OKAMURA CORPORATION: KEY STRATERGIES
    TABLE 148. BRISTOL TECHNOLOGIES SDN. BHD.: KEY EXECUTIVES
    TABLE 149. BRISTOL TECHNOLOGIES SDN. BHD.: COMPANY SNAPSHOT
    TABLE 150. BRISTOL TECHNOLOGIES SDN. BHD.: PRODUCT SEGMENTS
    TABLE 151. BRISTOL TECHNOLOGIES SDN. BHD.: PRODUCT PORTFOLIO
    TABLE 152. JIANGMEN SHENGSHI FURNITURE CO., LTD.: KEY EXECUTIVES
    TABLE 153. JIANGMEN SHENGSHI FURNITURE CO., LTD.: COMPANY SNAPSHOT
    TABLE 154. JIANGMEN SHENGSHI FURNITURE CO., LTD.: PRODUCT SEGMENTS
    TABLE 155. JIANGMEN SHENGSHI FURNITURE CO., LTD.: PRODUCT PORTFOLIO
    TABLE 156. HUZHOU SHENGLONG FURNITURE CO., LTD.: KEY EXECUTIVES
    TABLE 157. HUZHOU SHENGLONG FURNITURE CO., LTD.: COMPANY SNAPSHOT
    TABLE 158. HUZHOU SHENGLONG FURNITURE CO., LTD.: PRODUCT SEGMENTS
    TABLE 159. HUZHOU SHENGLONG FURNITURE CO., LTD.: PRODUCT PORTFOLIO
    TABLE 160. HAWORTH INC.: KEY EXECUTIVES
    TABLE 161. HAWORTH INC.: COMPANY SNAPSHOT
    TABLE 162. HAWORTH INC.: PRODUCT SEGMENTS
    TABLE 163. HAWORTH INC.: PRODUCT PORTFOLIO
    TABLE 164. EUROTECH DESIGN SYSTEMS PVT. LTD: KEY EXECUTIVES
    TABLE 165. EUROTECH DESIGN SYSTEMS PVT. LTD: COMPANY SNAPSHOT
    TABLE 166. EUROTECH DESIGN SYSTEMS PVT. LTD: PRODUCT SEGMENTS
    TABLE 167. EUROTECH DESIGN SYSTEMS PVT. LTD: PRODUCT PORTFOLIO
    TABLE 168. FEATHERLITE: KEY EXECUTIVES
    TABLE 169. FEATHERLITE: COMPANY SNAPSHOT
    TABLE 170. FEATHERLITE: PRODUCT SEGMENTS
    TABLE 171. FEATHERLITE: PRODUCT PORTFOLIO
    TABLE 172. NILKAMAL LIMITED: KEY EXECUTIVES
    TABLE 173. NILKAMAL LIMITED: COMPANY SNAPSHOT
    TABLE 174. NILKAMAL LIMITED: PRODUCT SEGMENTS
    TABLE 175. NILKAMAL LIMITED: PRODUCT PORTFOLIO
    TABLE 176. NILKAMAL LIMITED: KEY STRATERGIES
    TABLE 177. PSI SEATING LTD.: KEY EXECUTIVES
    TABLE 178. PSI SEATING LTD.: COMPANY SNAPSHOT
    TABLE 179. PSI SEATING LTD.: PRODUCT SEGMENTS
    TABLE 180. PSI SEATING LTD.: PRODUCT PORTFOLIO
    TABLE 181. TEKNION GROUP: KEY EXECUTIVES
    TABLE 182. TEKNION GROUP: COMPANY SNAPSHOT
    TABLE 183. TEKNION GROUP: PRODUCT SEGMENTS
    TABLE 184. TEKNION GROUP: PRODUCT PORTFOLIO
    TABLE 185. UE FURNITURE CO. LTD: KEY EXECUTIVES
    TABLE 186. UE FURNITURE CO. LTD: COMPANY SNAPSHOT
    TABLE 187. UE FURNITURE CO. LTD: PRODUCT SEGMENTS
    TABLE 188. UE FURNITURE CO. LTD: PRODUCT PORTFOLIO
    TABLE 189. UE FURNITURE CO. LTD: KEY STRATERGIES
    TABLE 190. KIMBALL INTERNATIONAL, INC.: KEY EXECUTIVES
    TABLE 191. KIMBALL INTERNATIONAL, INC.: COMPANY SNAPSHOT
    TABLE 192. KIMBALL INTERNATIONAL, INC.: PRODUCT SEGMENTS
    TABLE 193. KIMBALL INTERNATIONAL, INC.: PRODUCT PORTFOLIO
    TABLE 194. KIMBALL INTERNATIONAL, INC.: KEY STRATERGIES
  • LIST OF FIGURES

  • FIGURE 01. ERGONOMIC CHAIR MARKET, 2021-2031
    FIGURE 02. SEGMENTATION OF ERGONOMIC CHAIR MARKET, 2021-2031
    FIGURE 03. TOP INVESTMENT POCKETS IN ERGONOMIC CHAIR MARKET (2022-2031)
    FIGURE 04. PORTER FIVE-1
    FIGURE 05. PORTER FIVE-2
    FIGURE 06. PORTER FIVE-3
    FIGURE 07. PORTER FIVE-4
    FIGURE 08. PORTER FIVE-5
    FIGURE 09. DRIVERS, RESTRAINTS AND OPPORTUNITIES: GLOBALERGONOMIC CHAIR MARKET
    FIGURE 10. ERGONOMIC CHAIR MARKET, BY PRODUCT TYPE, 2021(%)
    FIGURE 11. COMPARATIVE SHARE ANALYSIS OF ERGONOMIC CHAIR MARKET FOR SWIVEL CHAIR, BY COUNTRY 2021-2031(%)
    FIGURE 12. COMPARATIVE SHARE ANALYSIS OF ERGONOMIC CHAIR MARKET FOR ADJUSTABLE CHAIR, BY COUNTRY 2021-2031(%)
    FIGURE 13. COMPARATIVE SHARE ANALYSIS OF ERGONOMIC CHAIR MARKET FOR FIXED CHAIR, BY COUNTRY 2021-2031(%)
    FIGURE 14. COMPARATIVE SHARE ANALYSIS OF ERGONOMIC CHAIR MARKET FOR OTHERS, BY COUNTRY 2021-2031(%)
    FIGURE 15. ERGONOMIC CHAIR MARKET, BY SEAT MATERIAL, 2021(%)
    FIGURE 16. COMPARATIVE SHARE ANALYSIS OF ERGONOMIC CHAIR MARKET FOR FABRIC, BY COUNTRY 2021-2031(%)
    FIGURE 17. COMPARATIVE SHARE ANALYSIS OF ERGONOMIC CHAIR MARKET FOR MESH, BY COUNTRY 2021-2031(%)
    FIGURE 18. COMPARATIVE SHARE ANALYSIS OF ERGONOMIC CHAIR MARKET FOR LEATHER, BY COUNTRY 2021-2031(%)
    FIGURE 19. COMPARATIVE SHARE ANALYSIS OF ERGONOMIC CHAIR MARKET FOR OTHERS, BY COUNTRY 2021-2031(%)
    FIGURE 20. ERGONOMIC CHAIR MARKET, BY END USERS, 2021(%)
    FIGURE 21. COMPARATIVE SHARE ANALYSIS OF ERGONOMIC CHAIR MARKET FOR RESIDENTIAL, BY COUNTRY 2021-2031(%)
    FIGURE 22. COMPARATIVE SHARE ANALYSIS OF ERGONOMIC CHAIR MARKET FOR COMMERCIAL, BY COUNTRY 2021-2031(%)
    FIGURE 23. ERGONOMIC CHAIR MARKET, BY DISTRIBUTION CHANNEL, 2021(%)
    FIGURE 24. COMPARATIVE SHARE ANALYSIS OF ERGONOMIC CHAIR MARKET FOR E COMMERCE, BY COUNTRY 2021-2031(%)
    FIGURE 25. COMPARATIVE SHARE ANALYSIS OF ERGONOMIC CHAIR MARKET FOR SPECIALTY STORE, BY COUNTRY 2021-2031(%)
    FIGURE 26. COMPARATIVE SHARE ANALYSIS OF ERGONOMIC CHAIR MARKET FOR HYPERMARKET AND SUPERMARKET, BY COUNTRY 2021-2031(%)
    FIGURE 27. COMPARATIVE SHARE ANALYSIS OF ERGONOMIC CHAIR MARKET FOR OTHERS, BY COUNTRY 2021-2031(%)
    FIGURE 28. ERGONOMIC CHAIR MARKET BY REGION, 2021
    FIGURE 29. U.S. ERGONOMIC CHAIR MARKET, 2021-2031 ($MILLION)
    FIGURE 30. CANADA ERGONOMIC CHAIR MARKET, 2021-2031 ($MILLION)
    FIGURE 31. MEXICO ERGONOMIC CHAIR MARKET, 2021-2031 ($MILLION)
    FIGURE 32. GERMANY ERGONOMIC CHAIR MARKET, 2021-2031 ($MILLION)
    FIGURE 33. UK ERGONOMIC CHAIR MARKET, 2021-2031 ($MILLION)
    FIGURE 34. FRANCE ERGONOMIC CHAIR MARKET, 2021-2031 ($MILLION)
    FIGURE 35. RUSSIA ERGONOMIC CHAIR MARKET, 2021-2031 ($MILLION)
    FIGURE 36. SPAIN ERGONOMIC CHAIR MARKET, 2021-2031 ($MILLION)
    FIGURE 37. ITALY ERGONOMIC CHAIR MARKET, 2021-2031 ($MILLION)
    FIGURE 38. REST OF EUROPE ERGONOMIC CHAIR MARKET, 2021-2031 ($MILLION)
    FIGURE 39. CHINA ERGONOMIC CHAIR MARKET, 2021-2031 ($MILLION)
    FIGURE 40. JAPAN ERGONOMIC CHAIR MARKET, 2021-2031 ($MILLION)
    FIGURE 41. INDIA ERGONOMIC CHAIR MARKET, 2021-2031 ($MILLION)
    FIGURE 42. SOUTH KOREA ERGONOMIC CHAIR MARKET, 2021-2031 ($MILLION)
    FIGURE 43. AUSTRALIA ERGONOMIC CHAIR MARKET, 2021-2031 ($MILLION)
    FIGURE 44. REST OF ASIA-PACIFIC ERGONOMIC CHAIR MARKET, 2021-2031 ($MILLION)
    FIGURE 45. BRAZIL ERGONOMIC CHAIR MARKET, 2021-2031 ($MILLION)
    FIGURE 46. CHILE ERGONOMIC CHAIR MARKET, 2021-2031 ($MILLION)
    FIGURE 47. ARGENTINA ERGONOMIC CHAIR MARKET, 2021-2031 ($MILLION)
    FIGURE 48. SAUDI ARABIA ERGONOMIC CHAIR MARKET, 2021-2031 ($MILLION)
    FIGURE 49. SOUTH AFRICA ERGONOMIC CHAIR MARKET, 2021-2031 ($MILLION)
    FIGURE 50. REST OF LAMEA ERGONOMIC CHAIR MARKET, 2021-2031 ($MILLION)
    FIGURE 51. TOP WINNING STRATEGIES, BY YEAR
    FIGURE 52. TOP WINNING STRATEGIES, BY DEVELOPMENT
    FIGURE 53. TOP WINNING STRATEGIES, BY COMPANY
    FIGURE 54. PRODUCT MAPPING OF TOP 10 PLAYERS
    FIGURE 55. COMPETITIVE DASHBOARD
    FIGURE 56. COMPETITIVE HEATMAP: ERGONOMIC CHAIR MARKET
    FIGURE 57. TOP PLAYER POSITIONING, 2021
    FIGURE 58. STEELCASE INC.: NET REVENUE, 2020-2022 ($MILLION)
    FIGURE 59. STEELCASE INC.: RESEARCH & DEVELOPMENT EXPENDITURE, 2020-2022 ($MILLION)
    FIGURE 60. STEELCASE INC.: REVENUE SHARE BY SEGMENT, 2022 (%)
    FIGURE 61. STEELCASE INC.: REVENUE SHARE BY REGION, 2022 (%)
    FIGURE 62. MILLERKNOLL, INC.: NET SALES, 2020-2022 ($MILLION)
    FIGURE 63. MILLERKNOLL, INC.: RESEARCH & DEVELOPMENT EXPENDITURE, 2020-2022 ($MILLION)
    FIGURE 64. MILLERKNOLL, INC.: REVENUE SHARE BY SEGMENT, 2022 (%)
    FIGURE 65. MILLERKNOLL, INC.: REVENUE SHARE BY REGION, 2022 (%)
    FIGURE 66. OKAMURA CORPORATION: NET SALES, 2019-2021 ($MILLION)
    FIGURE 67. OKAMURA CORPORATION: RESEARCH & DEVELOPMENT EXPENDITURE, 2019-2021 ($MILLION)
    FIGURE 68. OKAMURA CORPORATION: REVENUE SHARE BY SEGMENT, 2021 (%)
    FIGURE 69. NILKAMAL LIMITED: NET REVENUE, 2019-2021 ($MILLION)
    FIGURE 70. NILKAMAL LIMITED: REVENUE SHARE BY SEGMENT, 2021 (%)
    FIGURE 71. NILKAMAL LIMITED: REVENUE SHARE BY REGION, 2021 (%)
    FIGURE 72. KIMBALL INTERNATIONAL, INC.: NET SALES, 2019-2021 ($MILLION)
    FIGURE 73. KIMBALL INTERNATIONAL, INC.: RESEARCH & DEVELOPMENT EXPENDITURE, 2019-2021 ($MILLION)
    FIGURE 74. KIMBALL INTERNATIONAL, INC.: REVENUE SHARE BY SEGMENT, 2021 (%)
    FIGURE 75. KIMBALL INTERNATIONAL, INC.: REVENUE SHARE BY REGION, 2021 (%)


PURCHASE OPTIONS

Call or Email us

U.S.-Canada Toll-free: +1-800-792-5285
Int'l : +1-503-894-6022
Europe : +44-845-528-1300
Email : help@alliedmarketresearch.com
 
FREQUENTLY ASKED QUESTIONS?

A. Growing awareness of the importance of ergonomics in the workplace and the potential health benefits of using ergonomic chairs.

A. Swivel Chair is the leading product type of Ergonomic Chair Market.

A. North America is the largest regional market for Ergonomic Chair

A. The global ergonomic chair market was valued at $8,507.6 million in 2021, and is projected to reach $16,376.6 million by 2031, registering a CAGR of 6.6% from 2022 to 2031.

A. The major players operating in the global ergonomic chair are Steelcase Inc., Branch Office, Inc., MillerKnoll, Inc., Okamura Corporation, Bristol Technologies Sdn. Bhd., Huzhou Shenglong Furniture Co., Ltd., Haworth Inc., Featherlite, Nilkamal Limited, PSI Seating Ltd., Teknion Group, UE Furniture Co. Ltd, Kimball International, Inc., Eurotech Design Systems Pvt. Ltd, Jiangmen Shengshi Furniture Co., Ltd.

Looking for Customization?

 Customization Request

Have a Question?

 Speak with Analyst

Any Confusion?

 Inquire Before Buying

Have a glance of the Report

  Request Sample
RELATED TAGS

Purchase Full Report of
Ergonomic Chair Market

Start reading instantly.
This Report and over 67,540+ more Reports, Available with Avenue Library. T&C*.

  • Online Only
  • $3,570
  • Online cloud access only
  • Restricted print, copy, paste & download
  • Read only
  • Free industry update
    (Within 180 days)
  • Free report update in next update cycle
    (Feb 2024 - Feb 2025)
  • Data Pack
  • $3,840
  • Restricted to one authorized user
  • One print only
  • Available in
    Excel
  • Free industry update
    (Within 180 days)
  •   Free report update in next update cycle
    (Feb 2024 - Feb 2025)
  • Single User
  • $5,730
  • Restricted to one authorized user
  • One print only
  • Available in
    PDF
  • Free industry update
    (Within 180 days)
  •   Free report update in next update cycle
    (Feb 2024 - Feb 2025)
  • Five Users
  • $6,450
  • Limited to five authorized users
  • Print upto five copies
  • Available in
    PDF
  • Free industry update
    (Within 180 days)
  •   Free report update in next update cycle
    (Feb 2024 - Feb 2025)
  • Enterprise
    License/PDF

  • $9,600
  • Unlimited
    within
    company/enterprise
  • Available in Excel & PDF
  • Free industry update
    (Within 180 days)
  •   Free report update in next update cycle
    (Feb 2024 - Feb 2025)
  • Library
    Membership

  • $999 $ 1,175
    Per User/ Per month/ Billed annually
  • Published Content
    E-access
  • Company Profiles
    E-access
  • Newly Added Content Access
  • 10 PDF
    Downloads
  • 5 Excel Data
    Pack Downloads
  • 250 Company Profiles PDF Downloads
  • Buy Now

*Taxes/Fees, if applicable will be added during checkout. All prices in USD

RELATED REPORTS
 

Why Allied Market Research?


Infallible Methodology

To ensure high-level data integrity, accurate analysis, and impeccable forecasts

Analyst Support

For complete satisfaction

Customization

On-demand customization of scope of the report to exactly meet your needs

TARGETED MARKET VIEW

Targeted market view to provide pertinent information and save time of readers

Get fresh content delivered

Get insights on topics that are crucial for your business. Stay abreast of your interest areas.

Get Industry Data Alerts

Why Allied Market Research?

Infallible Methodology

To ensure high-level data integrity, accurate analysis, and impeccable forecasts

Analyst Support

For complete satisfaction

Customization

On-demand customization of scope of the report to exactly meet your needs

TARGETED MARKET VIEW

Targeted market view to provide pertinent information and save time of readers