
Erythropoietin Drugs Market Size & Trends
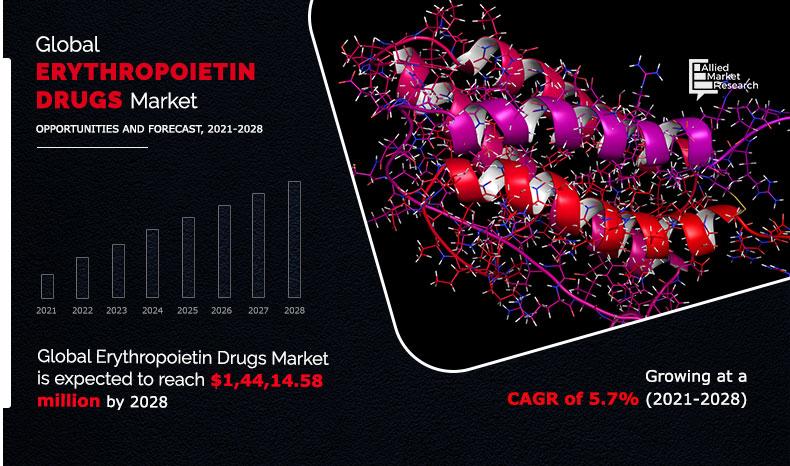
The erythropoietin drugs market size was valued at $9,243.12 million in 2020, and is projected to reach $14,414.59 million by 2028, registering a CAGR of 5.7% from 2021 to 2028.
Rise in prevalence of anemic conditions induced from end stage renal disease treatment, chemotherapy, and antiretroviral treatment (ART) is the primary factor that propels growth of the erythropoietin market. Hence, rise in number of treatment cycles for chemotherapy and increase in incidences of end stage renal diseases (dialysis) has increased demand for EPO. Side effects associated with EPO including arterial hypertension, iron deficiency, and influenza-like syndrome and longer duration of EPO treatment (4-6 weeks) restrain growth of the erythropoietin drugs market. In addition, rise in trends of commercialization for erythropoietin biosimilars, readily available reimbursements, favorable government regulations, and increase in level of awareness regarding benefits of EPO therapeutics boost growth of the erythropoietin drugs market.
Market Dynamics
Erythropoietin (EPO)/hematopoietin is a glycoprotein hormone that triggers production of red blood cells in the bone marrow through erythropoiesis. Erythropoietin drug was developed with the objective to treat anemic conditions caused from end stage renal disease (ESRD) disease treatments and dialysis procedures. Followed by ESRD anemic condition, EPO drugs have gained approvals for chemotherapy-induced anemia. After post-abbreviated new drug application (ANDA) approvals and high success rate of EPO applications for chemotherapy-induced anemia, original biopharmaceutical companies turned their attention to another form of induced anemia, namely ART-induced anemia (among HIV patients).
The outbreak of COVID-19 has disrupted workflows in the health care sector across the globe. The disease has forced a number of industries to shut their doors temporarily, including several sub-domains of health care. However, there has also been a positive effect and surge in demand for various medical services, including erythropoietin. As erythropoietin (EPO) is a drug for anemia and can be effective against COVID-19, as per scientists at Max Planck Institute of Experimental Medicine in Göttingen. According to them, when the SARS-CoV-2 attacks brain, growth aspect of erythropoietin can mitigate serious disease development and protect people from long-term neurological impacts.
Primary case studies suggest a favorable effect of erythropoietin. Currently, scientists are planning a randomized clinical trial to systematically investigate effects of treating COVID-19 using erythropoietin. It is a hormone/cytokine produced mainly by kidneys via hypoxia inducible factor-2 as its primary transcription factor and through inhibition of apoptosis of RBC precursors. However, EPO has other beneficial cytoprotective effects including anti-ischemic, regenerative, and anti-apoptotic effects in a variety of tissues including lung, kidney, cardiac muscle, nervous system, retina, pancreas, and endothelial cells. Through a special receptor; EPOR-ᵦcR, it conducts its protective effects following trauma in critically ill patients. Thus, impact of COVID-19 pandemic is expected to remain positive for key players in the erythropoietin drugs market.
By Therapeutic Class
Epoetin-alfa segment holds a dominant position in 2020 and would continue to maintain the lead over the forecast period.
Erythropoietin Drugs Market Segmentation
The global erythropoietin drugs market is segmented into product type, application, and region. On the basis of product type, the market is categorized into erythropoietin-alfa, erythropoietin-beta, and darbepoetin-alfa. By application, it is classified into anemia, kidney disorders, and others. Region wise, the market is analyzed across North America, Europe, Asia-Pacific, and LAMEA.
Segment Review
By product type, currently, the epoetin-alfa segment dominates the global market, and is expected maintain its dominance during the forecast period, owing to high usage rate in alleviating condition of anaemia in patients with cancer and chronic renal failure. By application, the kidney disorders segment is expected to generate highest revenue during the forecast period, owing to increase in prevalence of end stage renal disease and increase in demand for dialysis.
By Application
Kidney Disorders Segment is projected as one of the most lucrative segment.
Snapshot of Asia-Pacific Erythropoietin Drugs market
Asia-pacific is a promising market for growth of erythropoietin and majority of originator companies for erythropoietin are focusing on the Asia-pacific market. The region demonstrates largest share of the biosimilar industry, owing to development of biosimilars by major manufacturers in these regions. India and China are major erythropoietin biosimilar markets. The cost involved in development of biosimilars in India varies between $10 and $20 million, owing to industrial environment and government legislations. Moreover, development of biosimilars in majority of countries in Asia-pacific, such as India, do not require phase I/II studies, however, mandate phase III studies with minimum 100 patients. Hence, majority of biosimilar manufacturers in Asia-pacific can afford to launch biosimilar versions of erythropoietin at 25–40% less price than innovator products.
By Region
Asia Pacific region would exhibit the highest CAGR of 4.9% during 2021-2028.
Key Benefits for Stakeholders
- The study provides an in-depth analysis of the global erythropoietin drugs market along with the current trends and future estimations to elucidate the imminent investment pockets.
- A comprehensive analysis of the factors that drive and restrict the erythropoietin drugs market growth is provided in the report.
- Comprehensive quantitative analysis of the industry from 2020 to 2028 is provided to enable the stakeholders to capitalize on the prevailing erythropoietin drugs market opportunities.
- Extensive analysis of the key segments of the erythropoietin drugs industry helps to understand the application and products of erythropoietin used across the globe.
- Key market players and their strategies have been analyzed to understand the competitive outlook of the erythropoietin drugs market.
Erythropoietin Drugs Market Report Highlights
| Aspects | Details |
| By PRODUCTS |
|
| By APPLICATIONS |
|
| By GEOGRAPHY |
|
| Key Market Players | BIOCON, RANBAXY LABORATORIES LTD., HOSPIRA INC., AMGEN INC., JOHNSON AND JOHNSON, LG LIFE SCIENCES LTD., INTAS PHARMACEUTICALS, TEVA PHARMACEUTICAL INDUSTRIES LTD., CELLTRION, INC, ROCHE DIAGNOSTICS |
Analyst Review
This section provides opinions of the top level CXOs in the erythropoietin drugs market. According to the CXOs, erythropoietin (EPO) drugs are used for treatment of chemotherapy-induced anemia; a common side effect that occurs due to chemotherapy for ESRD, cancer, and HIV. Improved recombinant DNA technology has led to development of synthetic forms of erythropoietin such as epoetin-alfa, epoetin-beta, darbepoetin-alfa, epoetin-omega, and epoetin-delta.
As per CXOs, number of treatment cycles for chemotherapy and increase in number of cases of cancer, HIV, kidney disease, and anemia has increased demand for EPO. Moreover, favorable reimbursement and regulations for EPO treatment provide recordable growth for the erythropoietin drugs market. However, side effects associated with EPO including arterial hypertension, iron deficiency, and influenza-like syndrome and longer duration of EPO treatment (4-6 weeks) are expected to restrain the market growth. Moreover, commercialization of highly potent version of erythropoietin-alfa has provided high growth opportunities for the erythropoietin drugs market.
CXOs further added that erythropoietin-alfa segment is anticipated to grow with the highest revenue throughout the forecast period, owing to increase in sales of Epogen. In addition, kidney disorders segment accounted for a major share in 2020, and is expected to exhibit a prominent growth rate during the forecast period, owing to increase in cases of patients. Moreover, North America dominates the global erythropoietin drugs market, owing to the presence of several approved and commercialized erythropoietin biosimilars. Asia-Pacific and LAMEA offer promising growth opportunities for erythropoietin manufacturers as these regions are less explored for erythropoietin drugs as compared to North America and Europe.
The total market value of Erythropoietin Drugs Market is $9,243.12 million in 2020.
The forcast period for ErythropoietinHeparin market is 2021 to 2028
The market value of Erythropoietinmarket in 2021 is $9,808.80 million.
The base year is 2020 in Erythropoietin Drugs Market
Top companies such as Amgen Inc., Biocon, Celltrion, Inc., Intas Pharmaceuticals, Johnson & Johnso, LG Life Sciences Ltd., Pfizer (Hospira), Ranbaxy Laboratories Ltd., Roche, and Teva Pharmaceutical Industries Ltd held a high market position in 2020.
kidney disorders (ESRD and Dialysis) segment accounted for a major share in 2020 and is expected to exhibit a prominent growth rate during the forecast period, owing to increase in cases of patients with kidney disease.
Increase in number of treatment cycles for the chemotherapy and increasing number cases: including cancer, HIV, kidney disease and anaemia has increased the demand for EPO. Moreover, favorable reimbursement and regulations for EPO treatment provide recordable growth for the erythropoietin drugs market.
North America accounted for the largest share of the global erythropoietin drugs market in 2020, and is expected to remain dominant throughout the forecast period. This was attributed to the presence of several approved and commercialized erythropoietin biosimilars.
Erythropoietin/hematopoietin is a glycoprotein hormone that triggers the production of red blood cells in the bone marrow through erythropoiesis.
The erythropoietin drug was developed with the objective of treating anemic conditions caused from ESRD disease treatments and dialysis procedures.
Loading Table Of Content...

