0
2022
Fiber Management Systems Market

Fiber Management Systems Market

by Type (Fiber Cassette, Fiber Optic Boxes, Others), by Application (Telecommunications, Public Sector, Power Utilities, Healthcare, Industrial Automation, Others): Global Opportunity Analysis and Industry Forecast, 2021-2031

Report Code: A12930
Dec 2022 | Pages: 195
Tables: 123
Charts: 56
  • Formats*:

  • pdf

    Single User License, Five User
    License & Enterprise User License

  • xls

    Data Pack Excel License

  • ppt

    It comes with the additional cost
    of $2500.00 contact sales.


The global fiber management systems market was valued at $3.4 billion in 2021 and is projected to reach $9.3 billion by 2031, growing at a CAGR of 10.8% from 2022 to 2031

According to Himanshu Jangra, Lead Analyst, Semiconductor and Electronics, at Allied Market Research, the global fiber management system market is expected to showcase remarkable growth during the forecast period of 2022-2031. The report contains a thorough examination of the fiber management systems market size, fiber management systems market trends, key market players, sales analysis, major driving factors, and key investment pockets. The report on the global fiber management system market provides an overview of the market as well as market definition and scope. The ongoing technological advancements and surge in demand have an impact on market growth. Furthermore, the report provides a quantitative and qualitative analysis of the fiber management system market, as well as a breakdown of the pain points, value chain analysis, and key regulations.

A fiber management system (FMS) is a system that manages optical fiber connections from the outside of the fiber rack to the fiber routers. A fiber network is managed using the FMS method. It logs system operations and features like schematic design, asset physical locations, mechanical/fusion splice points, and more. Among its applications are the creation and distribution of cable capacity reports, the calculation of total cable lengths, the recording of fiber cable locations, splicing records, the verification of the presence of dark fiber cables, and the troubleshooting of fiber breakage.

To execute these tasks, most organizations rely on software-based platforms, databases, and spreadsheets. Managers and installers can utilize these technologies to save data on network components, connections, and testing, which can be useful for future upgrades or diagnosing problems if they arise. Reports from fiber optic management systems can reveal network statistics such as cable section lengths, loss budgets, network capacity, optical loss, and splice and termination sites. All of these factors contribute to the global expansion of fiber management solutions.

The outbreak of COVID-19 moderately impacted the growth of the fiber management system market in 2020, owing to a significant impact on prime players operating in the supply chain. However, the rise in demand for Internet of Things devices and solutions across prime sectors was one of the major factors that boosted the market growth during the COVID-19 pandemic. The market faced several obstacles amid the COVID-19 pandemic, such as a lack of skilled workforce availability and delay or cancelation of projects due to partial or complete lockdowns globally. The surge in demand for telecommunications, public sector, power utilities, healthcare, industrial automation, and other sectors is expected to strengthen fiber management system market opportunities post-COVID-19.

Fiber Management Systems Market

Fiber management solutions are most typically used in fiber optic communication networks. Cellular wireless technology has always relied on fiber networks and will continue to do so in the future. The use of the 5G network, the fifth generation of mobile network technology that promises faster speeds, cleaner connections, and higher capacity for individual devices, is widely expected to grow during the forecast period. As a result, in order to handle 5G cell installations, fiber management solutions will need to be significantly denser. The high manufacturing costs connected with the development of this technology, as well as its fragility and installation challenges, may hinder the market growth of fiber management systems.

The largest end-use industry for fiber optics is telecommunication, and the optical fiber is the primary medium for data transport from one location to another. The sector is quickly expanding as a result of the rising use of mobile devices and the associated bandwidth connectivity. Positive market developments in broadband services and big data management, such as 5G networks, AI implementation, and the Internet of Things, are propelling the telecommunications business. The number of connected devices continues to grow, and the use of fiber management solutions will follow the pace as device usage and connectivity grow.

The global fiber management systems market size is expected to witness notable growth during the forecast period, owing to a surge in demand for Internet of Things (IoT) devices. Moreover, the rise in the deployment of data centers and the rise in demand for higher bandwidth are expected to boost the fiber management systems market growth during the forecast period.

However, the lack of professionals to operate and install fiber optic cassette solutions is one of the prime factors that restrain the global fiber management systems market growth. On the contrary, the expansion of telecom infrastructure in developing economies is expected to provide lucrative opportunities for the growth of the fiber management systems market during the forecast period.

The fiber management systems market share is segmented into Type and Application.
Fiber Management Systems Market

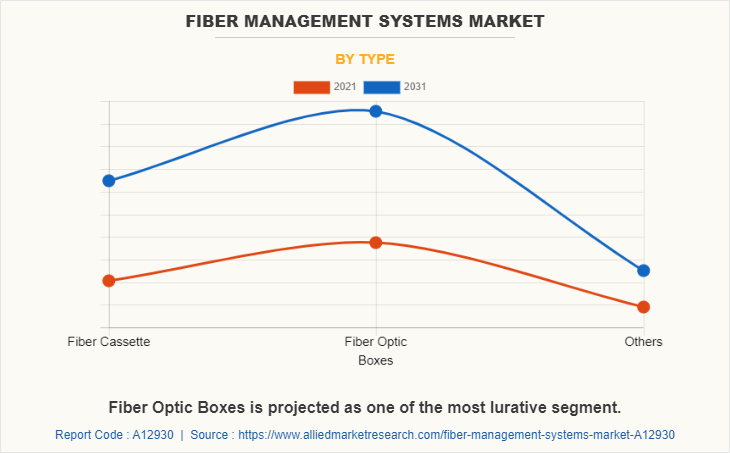
On the basis of type, the fiber management systems market outlook is divided into fiber cassettes, fiber optic boxes, and others. In 2021, the fiber optic box segment dominated the market in terms of revenue and is expected to follow the same trend during the forecast period.
Fiber Management Systems Market

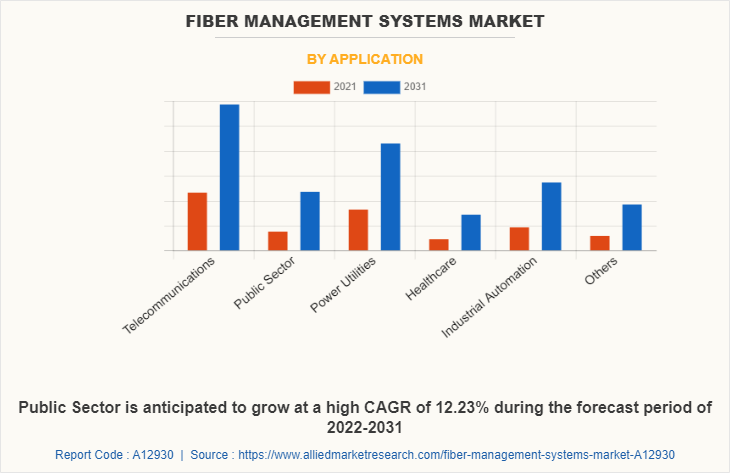
On the basis of application, the fiber management systems market opportunity is segregated into telecommunications, the public sector, power utilities, healthcare, industrial automation, and others. Thetelecommunicationssegment acquired the largest share in 2021 and is expected to grow at a significant CAGR from 2022 to 2031.
Fiber Management Systems Market

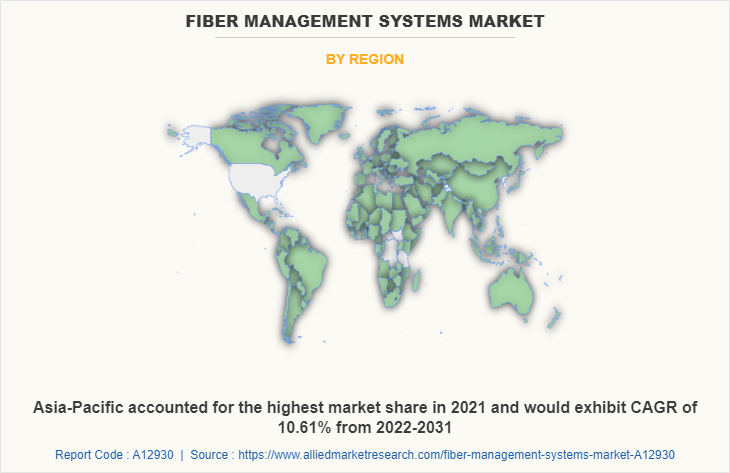
On the basis of region, the fiber management systems market trends are analyzed across North America (the U.S., Canada, and Mexico), Europe (UK, Germany, France, and the Rest of Europe), Asia-Pacific (China, Japan, India, South Korea, and Rest of Asia-Pacific), and LAMEA (Latin America, Middle East, and Africa). Asia-Pacific remains a significant participant in the fiber management system market. Major organizations and government institutions in the region are putting resources into technology.

COMPETITION ANALYSIS

Competitive analysis and profiles of the major global fiber management systems market players that have been provided in the report include 3M, Belden Inc., BUD Industries, Eaton Corporation Plc (Tripp Lite), HUBER+SUHNER, Molex, Panduit, Phoenix Contact, RockOm, Santron, and TE Connectivity Ltd.

Country Analysis

Country-wise, the U.S. acquired a prime share in the fiber management systems market forecast in the North American region and is expected to register a high CAGR of 10.87% during the forecast period of 2022-2031. The U.S. holds a dominant position in the fiber management system market, owing to a rise in investment by prime vendors to boost smart infrastructure solutions.

In Europe, Germany dominated the fiber management systems market in terms of revenue in 2021 and is expected to follow the same trend during the forecast period. However, the UK is expected to emerge as the fastest-growing country in Europe's fiber management system market with a CAGR of 12.33%, owing to significant developments in the Internet of Things devices in telecommunication, automotive, and other sectors in the country.

In Asia-Pacific, China is expected to emerge as a significant market for the fiber management system industry, owing to a significant rise in investment by prime players and government institutions to boost telecommunication sectors.

In the LAMEA region, Latin America garnered a significant fiber management systems industry share in 2021. The LAMEA fiber management system market has been witnessing improvement, owing to the growing inclination of companies towards research and development for enhanced connectivity for consumer electronics and smart factories across this region. The region has the potential for increased FTTH (fiber to the home) deployment. This is primarily due to new strategies being developed by the government and service providers to aid in the expansion of the FTTH network. Initially, only the healthcare industry and a few other businesses used fiber optic networks. Furthermore, as internet penetration has increased, so has the number of fiber optic rollouts. As a result of the transformation that many businesses are bringing about in the optical communication & network equipment industry, the market for fiber management systems is anticipated to expand rapidly during the forecast period.

Moreover, the Latin America region is expected to expand at a high CAGR of 12.82% from 2022 to 2031, owing to new developments and investments in fiber and an increase in the deployment of high-speed networks in the region. This is expected to reshape the growth of the fiber management system market in Latin America.

TOP IMPACTING FACTORS

Significant factors that impact the growth of the global fiber management system industry include the high demand for Internet of Things devices. Moreover, increased deployment of data centers around enterprises and government centers, rising demand for bandwidth for faster connectivity, and expansion of telecom infrastructure in developing economies are expected to drive market growth during the forecast period. However, the lack of professionals to operate and install fiber optic cassette solutions may hamper the growth of the market.

HISTORICAL DATA & INFORMATION

The global fiber management system market is highly competitive, owing to the strong presence of existing vendors. Vendors of fiber management systems with extensive technical and financial resources are expected to gain a competitive advantage over their competitors because they can cater to market demands. The competitive environment in this market is expected to worsen as technological innovations, product extensions, and different strategies adopted by key vendors increase.

KEY DEVELOPMENTS/STRATEGIES

Santron, Panduit, HUBER+SUHNER, Eaton Corporation Plc (Tripp Lite), and Phoenix Contact are the top 5 companies that hold a prime share in the fiber management system market. Top market players have adopted various strategies, such as product launch, branding, innovation, and acquisition to expand their foothold in the fiber management system market.

  • For instance, in January 2020, JO Software Engineering GmbH, a modern software company with over 30 years of experience in network technology and engineering, announced the launch of cables cut, which enables companies to comprehensively manage in one system all types and topologies of fiber optic and copper networks together with the transmission and connection technologies installed such as xWDM, xPON, xDSL and FTTx from one national location through the other location’s signal level.
  • In May 2021, HUBER+SUHNER, a company that offers a range of high-performance, innovative fiber management solutions that thrive in different environments, announced the launch of SYLFA HD, a fiber management system for customers who require a space-saving, structured cabling solution. With decades of expertise, it understands that time, accessibility, and protection are key elements for customers and should not be compromised, regardless of the environment’s size.

In March 2022, Panduit announced the launch of its new FlexCoreoptical distribution frame [ODF], a versatile front-access cabling system that provides the necessary protection for critical connections. Utilizing innovative cable management and simple, intuitive cable routing, the FlexCore ODF simplifies and reduces the time for moves, adds, and changes. Through standard doors with locks and optional locks for each enclosure, the FlexCore ODF solution enables multi-tiered security that is important for multiple client access.

Key Benefits For Stakeholders

  • This report provides a quantitative analysis of the market segments, current trends, estimations, and dynamics of the fiber management systems market analysis from 2021 to 2031 to identify the prevailing fiber management systems market opportunities.
  • Market research is offered along with information related to key drivers, restraints, and opportunities.
  • Porter's five forces analysis highlights buyers' and suppliers' potency to enable stakeholders to make profit-oriented business decisions and strengthen their supplier-buyer network.
  • In-depth analysis of the fiber management systems market segmentation assists in determining the prevailing market opportunities.
  • Major countries in each region are mapped according to their revenue contribution to the global market.
  • Market player positioning facilitates benchmarking and provides a clear understanding of the present position of the market players.
  • The report includes an analysis of regional and global fiber management systems market trends, key players, market segments, application areas, and market growth strategies.

Fiber Management Systems Market Report Highlights

Aspects Details
Market Size By 2031 USD 9.3 billion
Growth Rate CAGR of 10.8%
Forecast period 2021 - 2031
Report Pages 195
By Type
  • Fiber Cassette
  • Fiber Optic Boxes
  • Others
By Application
  • Telecommunications
  • Public Sector
  • Power Utilities
  • Healthcare
  • Industrial Automation
  • Others
By Region
  • North America  (U.S., Canada, Mexico)
  • Europe  (UK, Germany, France, Rest of Europe)
  • Asia-Pacific  (China, Japan, India, South Korea, Rest of Asia-Pacific)
  • LAMEA  (Latin America, Middle East, Africa)
Key Market Players Belden Inc., HUBER SUHNER, Eaton Corporation Plc (Tripp Lite), 3M Company, bud industries, inc., Corning Inc, RackOm System, phoenix contact, Molex, panduit, Santron Electronics, TE Connectivity Ltd.
 
  • CHAPTER 1:INTRODUCTION

    • 1.1.Report description

    • 1.2.Key market segments

    • 1.3.Key benefits to the stakeholders

    • 1.4.Research Methodology

      • 1.4.1.Secondary research

      • 1.4.2.Primary research

      • 1.4.3.Analyst tools and models

  • CHAPTER 2:EXECUTIVE SUMMARY

    • 2.1.Key findings of the study

    • 2.2.CXO Perspective

  • CHAPTER 3:MARKET OVERVIEW

    • 3.1.Market definition and scope

    • 3.2.Key findings

      • 3.2.1.Top investment pockets

    • 3.3.Porter’s five forces analysis

    • 3.4.Top player positioning

    • 3.5.Market dynamics

      • 3.5.1.Drivers

      • 3.5.2.Restraints

      • 3.5.3.Opportunities

    • 3.6.COVID-19 Impact Analysis on the market

  • CHAPTER 4: FIBER MANAGEMENT SYSTEMS MARKET, BY TYPE

    • 4.1 Overview

      • 4.1.1 Market size and forecast

    • 4.2 Fiber Cassette

      • 4.2.1 Key market trends, growth factors and opportunities

      • 4.2.2 Market size and forecast, by region

      • 4.2.3 Market share analysis by country

    • 4.3 Fiber Optic Boxes

      • 4.3.1 Key market trends, growth factors and opportunities

      • 4.3.2 Market size and forecast, by region

      • 4.3.3 Market share analysis by country

    • 4.4 Others

      • 4.4.1 Key market trends, growth factors and opportunities

      • 4.4.2 Market size and forecast, by region

      • 4.4.3 Market share analysis by country

  • CHAPTER 5: FIBER MANAGEMENT SYSTEMS MARKET, BY APPLICATION

    • 5.1 Overview

      • 5.1.1 Market size and forecast

    • 5.2 Telecommunications

      • 5.2.1 Key market trends, growth factors and opportunities

      • 5.2.2 Market size and forecast, by region

      • 5.2.3 Market share analysis by country

    • 5.3 Public Sector

      • 5.3.1 Key market trends, growth factors and opportunities

      • 5.3.2 Market size and forecast, by region

      • 5.3.3 Market share analysis by country

    • 5.4 Power Utilities

      • 5.4.1 Key market trends, growth factors and opportunities

      • 5.4.2 Market size and forecast, by region

      • 5.4.3 Market share analysis by country

    • 5.5 Healthcare

      • 5.5.1 Key market trends, growth factors and opportunities

      • 5.5.2 Market size and forecast, by region

      • 5.5.3 Market share analysis by country

    • 5.6 Industrial Automation

      • 5.6.1 Key market trends, growth factors and opportunities

      • 5.6.2 Market size and forecast, by region

      • 5.6.3 Market share analysis by country

    • 5.7 Others

      • 5.7.1 Key market trends, growth factors and opportunities

      • 5.7.2 Market size and forecast, by region

      • 5.7.3 Market share analysis by country

  • CHAPTER 6: FIBER MANAGEMENT SYSTEMS MARKET, BY REGION

    • 6.1 Overview

      • 6.1.1 Market size and forecast

    • 6.2 North America

      • 6.2.1 Key trends and opportunities

      • 6.2.2 North America Market size and forecast, by Type

      • 6.2.3 North America Market size and forecast, by Application

      • 6.2.4 North America Market size and forecast, by country

        • 6.2.4.1 U.S.
          • 6.2.4.1.1 Key market trends, growth factors and opportunities
          • 6.2.4.1.2 Market size and forecast, by Type
          • 6.2.4.1.3 Market size and forecast, by Application
        • 6.2.4.2 Canada
          • 6.2.4.2.1 Key market trends, growth factors and opportunities
          • 6.2.4.2.2 Market size and forecast, by Type
          • 6.2.4.2.3 Market size and forecast, by Application
        • 6.2.4.3 Mexico
          • 6.2.4.3.1 Key market trends, growth factors and opportunities
          • 6.2.4.3.2 Market size and forecast, by Type
          • 6.2.4.3.3 Market size and forecast, by Application
    • 6.3 Europe

      • 6.3.1 Key trends and opportunities

      • 6.3.2 Europe Market size and forecast, by Type

      • 6.3.3 Europe Market size and forecast, by Application

      • 6.3.4 Europe Market size and forecast, by country

        • 6.3.4.1 UK
          • 6.3.4.1.1 Key market trends, growth factors and opportunities
          • 6.3.4.1.2 Market size and forecast, by Type
          • 6.3.4.1.3 Market size and forecast, by Application
        • 6.3.4.2 Germany
          • 6.3.4.2.1 Key market trends, growth factors and opportunities
          • 6.3.4.2.2 Market size and forecast, by Type
          • 6.3.4.2.3 Market size and forecast, by Application
        • 6.3.4.3 France
          • 6.3.4.3.1 Key market trends, growth factors and opportunities
          • 6.3.4.3.2 Market size and forecast, by Type
          • 6.3.4.3.3 Market size and forecast, by Application
        • 6.3.4.4 Rest of Europe
          • 6.3.4.4.1 Key market trends, growth factors and opportunities
          • 6.3.4.4.2 Market size and forecast, by Type
          • 6.3.4.4.3 Market size and forecast, by Application
    • 6.4 Asia-Pacific

      • 6.4.1 Key trends and opportunities

      • 6.4.2 Asia-Pacific Market size and forecast, by Type

      • 6.4.3 Asia-Pacific Market size and forecast, by Application

      • 6.4.4 Asia-Pacific Market size and forecast, by country

        • 6.4.4.1 China
          • 6.4.4.1.1 Key market trends, growth factors and opportunities
          • 6.4.4.1.2 Market size and forecast, by Type
          • 6.4.4.1.3 Market size and forecast, by Application
        • 6.4.4.2 Japan
          • 6.4.4.2.1 Key market trends, growth factors and opportunities
          • 6.4.4.2.2 Market size and forecast, by Type
          • 6.4.4.2.3 Market size and forecast, by Application
        • 6.4.4.3 India
          • 6.4.4.3.1 Key market trends, growth factors and opportunities
          • 6.4.4.3.2 Market size and forecast, by Type
          • 6.4.4.3.3 Market size and forecast, by Application
        • 6.4.4.4 South Korea
          • 6.4.4.4.1 Key market trends, growth factors and opportunities
          • 6.4.4.4.2 Market size and forecast, by Type
          • 6.4.4.4.3 Market size and forecast, by Application
        • 6.4.4.5 Rest of Asia-Pacific
          • 6.4.4.5.1 Key market trends, growth factors and opportunities
          • 6.4.4.5.2 Market size and forecast, by Type
          • 6.4.4.5.3 Market size and forecast, by Application
    • 6.5 LAMEA

      • 6.5.1 Key trends and opportunities

      • 6.5.2 LAMEA Market size and forecast, by Type

      • 6.5.3 LAMEA Market size and forecast, by Application

      • 6.5.4 LAMEA Market size and forecast, by country

        • 6.5.4.1 Latin America
          • 6.5.4.1.1 Key market trends, growth factors and opportunities
          • 6.5.4.1.2 Market size and forecast, by Type
          • 6.5.4.1.3 Market size and forecast, by Application
        • 6.5.4.2 Middle East
          • 6.5.4.2.1 Key market trends, growth factors and opportunities
          • 6.5.4.2.2 Market size and forecast, by Type
          • 6.5.4.2.3 Market size and forecast, by Application
        • 6.5.4.3 Africa
          • 6.5.4.3.1 Key market trends, growth factors and opportunities
          • 6.5.4.3.2 Market size and forecast, by Type
          • 6.5.4.3.3 Market size and forecast, by Application
  • CHAPTER 7: COMPANY LANDSCAPE

    • 7.1. Introduction

    • 7.2. Top winning strategies

    • 7.3. Product Mapping of Top 10 Player

    • 7.4. Competitive Dashboard

    • 7.5. Competitive Heatmap

    • 7.6. Key developments

  • CHAPTER 8: COMPANY PROFILES

    • 8.1 Santron

      • 8.1.1 Company overview

      • 8.1.2 Company snapshot

      • 8.1.3 Operating business segments

      • 8.1.4 Product portfolio

      • 8.1.5 Business performance

      • 8.1.6 Key strategic moves and developments

    • 8.2 Panduit

      • 8.2.1 Company overview

      • 8.2.2 Company snapshot

      • 8.2.3 Operating business segments

      • 8.2.4 Product portfolio

      • 8.2.5 Business performance

      • 8.2.6 Key strategic moves and developments

    • 8.3 huber+suhner, inc.

      • 8.3.1 Company overview

      • 8.3.2 Company snapshot

      • 8.3.3 Operating business segments

      • 8.3.4 Product portfolio

      • 8.3.5 Business performance

      • 8.3.6 Key strategic moves and developments

    • 8.4 3M

      • 8.4.1 Company overview

      • 8.4.2 Company snapshot

      • 8.4.3 Operating business segments

      • 8.4.4 Product portfolio

      • 8.4.5 Business performance

      • 8.4.6 Key strategic moves and developments

    • 8.5 TE Connectivity Ltd.

      • 8.5.1 Company overview

      • 8.5.2 Company snapshot

      • 8.5.3 Operating business segments

      • 8.5.4 Product portfolio

      • 8.5.5 Business performance

      • 8.5.6 Key strategic moves and developments

    • 8.6 Belden Inc.

      • 8.6.1 Company overview

      • 8.6.2 Company snapshot

      • 8.6.3 Operating business segments

      • 8.6.4 Product portfolio

      • 8.6.5 Business performance

      • 8.6.6 Key strategic moves and developments

    • 8.7 bud industries, inc.

      • 8.7.1 Company overview

      • 8.7.2 Company snapshot

      • 8.7.3 Operating business segments

      • 8.7.4 Product portfolio

      • 8.7.5 Business performance

      • 8.7.6 Key strategic moves and developments

    • 8.8 Eaton Corporation Plc (Tripp Lite)

      • 8.8.1 Company overview

      • 8.8.2 Company snapshot

      • 8.8.3 Operating business segments

      • 8.8.4 Product portfolio

      • 8.8.5 Business performance

      • 8.8.6 Key strategic moves and developments

    • 8.9 molex

      • 8.9.1 Company overview

      • 8.9.2 Company snapshot

      • 8.9.3 Operating business segments

      • 8.9.4 Product portfolio

      • 8.9.5 Business performance

      • 8.9.6 Key strategic moves and developments

    • 8.10 phoenix contact

      • 8.10.1 Company overview

      • 8.10.2 Company snapshot

      • 8.10.3 Operating business segments

      • 8.10.4 Product portfolio

      • 8.10.5 Business performance

      • 8.10.6 Key strategic moves and developments

    • 8.11 RockOm

      • 8.11.1 Company overview

      • 8.11.2 Company snapshot

      • 8.11.3 Operating business segments

      • 8.11.4 Product portfolio

      • 8.11.5 Business performance

      • 8.11.6 Key strategic moves and developments

    • 8.12 Corning Inc

      • 8.12.1 Company overview

      • 8.12.2 Company snapshot

      • 8.12.3 Operating business segments

      • 8.12.4 Product portfolio

      • 8.12.5 Business performance

      • 8.12.6 Key strategic moves and developments

  • LIST OF TABLES

  • TABLE 1. GLOBAL FIBER MANAGEMENT SYSTEMS MARKET, BY TYPE, 2021-2031 (REVENUE, $MILLION)
    TABLE 2. FIBER MANAGEMENT SYSTEMS MARKET FOR FIBER CASSETTE, BY REGION, 2021-2031 (REVENUE, $MILLION)
    TABLE 3. FIBER MANAGEMENT SYSTEMS MARKET FOR FIBER CASSETTE, BY COUNTRY, 2021-2031 (REVENUE, $MILLION)
    TABLE 4. FIBER MANAGEMENT SYSTEMS MARKET FOR FIBER OPTIC BOXES, BY REGION, 2021-2031 (REVENUE, $MILLION)
    TABLE 5. FIBER MANAGEMENT SYSTEMS MARKET FOR FIBER OPTIC BOXES, BY COUNTRY, 2021-2031 (REVENUE, $MILLION)
    TABLE 6. FIBER MANAGEMENT SYSTEMS MARKET FOR OTHERS, BY REGION, 2021-2031 (REVENUE, $MILLION)
    TABLE 7. FIBER MANAGEMENT SYSTEMS MARKET FOR OTHERS, BY COUNTRY, 2021-2031 (REVENUE, $MILLION)
    TABLE 8. GLOBAL FIBER MANAGEMENT SYSTEMS MARKET, BY APPLICATION, 2021-2031 (REVENUE, $MILLION)
    TABLE 9. FIBER MANAGEMENT SYSTEMS MARKET FOR TELECOMMUNICATIONS, BY REGION, 2021-2031 (REVENUE, $MILLION)
    TABLE 10. FIBER MANAGEMENT SYSTEMS MARKET FOR TELECOMMUNICATIONS, BY COUNTRY, 2021-2031 (REVENUE, $MILLION)
    TABLE 11. FIBER MANAGEMENT SYSTEMS MARKET FOR PUBLIC SECTOR, BY REGION, 2021-2031 (REVENUE, $MILLION)
    TABLE 12. FIBER MANAGEMENT SYSTEMS MARKET FOR PUBLIC SECTOR, BY COUNTRY, 2021-2031 (REVENUE, $MILLION)
    TABLE 13. FIBER MANAGEMENT SYSTEMS MARKET FOR POWER UTILITIES, BY REGION, 2021-2031 (REVENUE, $MILLION)
    TABLE 14. FIBER MANAGEMENT SYSTEMS MARKET FOR POWER UTILITIES, BY COUNTRY, 2021-2031 (REVENUE, $MILLION)
    TABLE 15. FIBER MANAGEMENT SYSTEMS MARKET FOR HEALTHCARE, BY REGION, 2021-2031 (REVENUE, $MILLION)
    TABLE 16. FIBER MANAGEMENT SYSTEMS MARKET FOR HEALTHCARE, BY COUNTRY, 2021-2031 (REVENUE, $MILLION)
    TABLE 17. FIBER MANAGEMENT SYSTEMS MARKET FOR INDUSTRIAL AUTOMATION, BY REGION, 2021-2031 (REVENUE, $MILLION)
    TABLE 18. FIBER MANAGEMENT SYSTEMS MARKET FOR INDUSTRIAL AUTOMATION, BY COUNTRY, 2021-2031 (REVENUE, $MILLION)
    TABLE 19. FIBER MANAGEMENT SYSTEMS MARKET FOR OTHERS, BY REGION, 2021-2031 (REVENUE, $MILLION)
    TABLE 20. FIBER MANAGEMENT SYSTEMS MARKET FOR OTHERS, BY COUNTRY, 2021-2031 (REVENUE, $MILLION)
    TABLE 21. FIBER MANAGEMENT SYSTEMS MARKET, BY REGION, 2021-2031 (REVENUE, $MILLION)
    TABLE 22. NORTH AMERICA FIBER MANAGEMENT SYSTEMS MARKET, BY TYPE, 2021-2031 (REVENUE, $MILLION)
    TABLE 23. NORTH AMERICA FIBER MANAGEMENT SYSTEMS MARKET, BY APPLICATION, 2021-2031 (REVENUE, $MILLION)
    TABLE 24. NORTH AMERICA FIBER MANAGEMENT SYSTEMS MARKET, BY COUNTRY, 2021-2031 (REVENUE, $MILLION)
    TABLE 25. U.S. FIBER MANAGEMENT SYSTEMS MARKET, BY TYPE, 2021-2031 (REVENUE, $MILLION)
    TABLE 26. U.S. FIBER MANAGEMENT SYSTEMS MARKET, BY APPLICATION, 2021-2031 (REVENUE, $MILLION)
    TABLE 27. CANADA FIBER MANAGEMENT SYSTEMS MARKET, BY TYPE, 2021-2031 (REVENUE, $MILLION)
    TABLE 28. CANADA FIBER MANAGEMENT SYSTEMS MARKET, BY APPLICATION, 2021-2031 (REVENUE, $MILLION)
    TABLE 29. MEXICO FIBER MANAGEMENT SYSTEMS MARKET, BY TYPE, 2021-2031 (REVENUE, $MILLION)
    TABLE 30. MEXICO FIBER MANAGEMENT SYSTEMS MARKET, BY APPLICATION, 2021-2031 (REVENUE, $MILLION)
    TABLE 31. EUROPE FIBER MANAGEMENT SYSTEMS MARKET, BY TYPE, 2021-2031 (REVENUE, $MILLION)
    TABLE 32. EUROPE FIBER MANAGEMENT SYSTEMS MARKET, BY APPLICATION, 2021-2031 (REVENUE, $MILLION)
    TABLE 33. EUROPE FIBER MANAGEMENT SYSTEMS MARKET, BY COUNTRY, 2021-2031 (REVENUE, $MILLION)
    TABLE 34. UK FIBER MANAGEMENT SYSTEMS MARKET, BY TYPE, 2021-2031 (REVENUE, $MILLION)
    TABLE 35. UK FIBER MANAGEMENT SYSTEMS MARKET, BY APPLICATION, 2021-2031 (REVENUE, $MILLION)
    TABLE 36. GERMANY FIBER MANAGEMENT SYSTEMS MARKET, BY TYPE, 2021-2031 (REVENUE, $MILLION)
    TABLE 37. GERMANY FIBER MANAGEMENT SYSTEMS MARKET, BY APPLICATION, 2021-2031 (REVENUE, $MILLION)
    TABLE 38. FRANCE FIBER MANAGEMENT SYSTEMS MARKET, BY TYPE, 2021-2031 (REVENUE, $MILLION)
    TABLE 39. FRANCE FIBER MANAGEMENT SYSTEMS MARKET, BY APPLICATION, 2021-2031 (REVENUE, $MILLION)
    TABLE 40. REST OF EUROPE FIBER MANAGEMENT SYSTEMS MARKET, BY TYPE, 2021-2031 (REVENUE, $MILLION)
    TABLE 41. REST OF EUROPE FIBER MANAGEMENT SYSTEMS MARKET, BY APPLICATION, 2021-2031 (REVENUE, $MILLION)
    TABLE 42. ASIA-PACIFIC FIBER MANAGEMENT SYSTEMS MARKET, BY TYPE, 2021-2031 (REVENUE, $MILLION)
    TABLE 43. ASIA-PACIFIC FIBER MANAGEMENT SYSTEMS MARKET, BY APPLICATION, 2021-2031 (REVENUE, $MILLION)
    TABLE 44. ASIA-PACIFIC FIBER MANAGEMENT SYSTEMS MARKET, BY COUNTRY, 2021-2031 (REVENUE, $MILLION)
    TABLE 45. CHINA FIBER MANAGEMENT SYSTEMS MARKET, BY TYPE, 2021-2031 (REVENUE, $MILLION)
    TABLE 46. CHINA FIBER MANAGEMENT SYSTEMS MARKET, BY APPLICATION, 2021-2031 (REVENUE, $MILLION)
    TABLE 47. JAPAN FIBER MANAGEMENT SYSTEMS MARKET, BY TYPE, 2021-2031 (REVENUE, $MILLION)
    TABLE 48. JAPAN FIBER MANAGEMENT SYSTEMS MARKET, BY APPLICATION, 2021-2031 (REVENUE, $MILLION)
    TABLE 49. INDIA FIBER MANAGEMENT SYSTEMS MARKET, BY TYPE, 2021-2031 (REVENUE, $MILLION)
    TABLE 50. INDIA FIBER MANAGEMENT SYSTEMS MARKET, BY APPLICATION, 2021-2031 (REVENUE, $MILLION)
    TABLE 51. SOUTH KOREA FIBER MANAGEMENT SYSTEMS MARKET, BY TYPE, 2021-2031 (REVENUE, $MILLION)
    TABLE 52. SOUTH KOREA FIBER MANAGEMENT SYSTEMS MARKET, BY APPLICATION, 2021-2031 (REVENUE, $MILLION)
    TABLE 53. REST OF ASIA-PACIFIC FIBER MANAGEMENT SYSTEMS MARKET, BY TYPE, 2021-2031 (REVENUE, $MILLION)
    TABLE 54. REST OF ASIA-PACIFIC FIBER MANAGEMENT SYSTEMS MARKET, BY APPLICATION, 2021-2031 (REVENUE, $MILLION)
    TABLE 55. LAMEA FIBER MANAGEMENT SYSTEMS MARKET, BY TYPE, 2021-2031 (REVENUE, $MILLION)
    TABLE 56. LAMEA FIBER MANAGEMENT SYSTEMS MARKET, BY APPLICATION, 2021-2031 (REVENUE, $MILLION)
    TABLE 57. LAMEA FIBER MANAGEMENT SYSTEMS MARKET, BY COUNTRY, 2021-2031 (REVENUE, $MILLION)
    TABLE 58. LATIN AMERICA FIBER MANAGEMENT SYSTEMS MARKET, BY TYPE, 2021-2031 (REVENUE, $MILLION)
    TABLE 59. LATIN AMERICA FIBER MANAGEMENT SYSTEMS MARKET, BY APPLICATION, 2021-2031 (REVENUE, $MILLION)
    TABLE 60. MIDDLE EAST FIBER MANAGEMENT SYSTEMS MARKET, BY TYPE, 2021-2031 (REVENUE, $MILLION)
    TABLE 61. MIDDLE EAST FIBER MANAGEMENT SYSTEMS MARKET, BY APPLICATION, 2021-2031 (REVENUE, $MILLION)
    TABLE 62. AFRICA FIBER MANAGEMENT SYSTEMS MARKET, BY TYPE, 2021-2031 (REVENUE, $MILLION)
    TABLE 63. AFRICA FIBER MANAGEMENT SYSTEMS MARKET, BY APPLICATION, 2021-2031 (REVENUE, $MILLION)
    TABLE 64.SANTRON: COMPANY SNAPSHOT
    TABLE 65.SANTRON: OPERATING SEGMENTS
    TABLE 66.SANTRON: PRODUCT PORTFOLIO
    TABLE 67.SANTRON: NET SALES
    TABLE 68.SANTRON: KEY STRATERGIES
    TABLE 69.PANDUIT: COMPANY SNAPSHOT
    TABLE 70.PANDUIT: OPERATING SEGMENTS
    TABLE 71.PANDUIT: PRODUCT PORTFOLIO
    TABLE 72.PANDUIT: NET SALES
    TABLE 73.PANDUIT: KEY STRATERGIES
    TABLE 74.HUBER+SUHNER, INC.: COMPANY SNAPSHOT
    TABLE 75.HUBER+SUHNER, INC.: OPERATING SEGMENTS
    TABLE 76.HUBER+SUHNER, INC.: PRODUCT PORTFOLIO
    TABLE 77.HUBER+SUHNER, INC.: NET SALES
    TABLE 78.HUBER+SUHNER, INC.: KEY STRATERGIES
    TABLE 79.3M: COMPANY SNAPSHOT
    TABLE 80.3M: OPERATING SEGMENTS
    TABLE 81.3M: PRODUCT PORTFOLIO
    TABLE 82.3M: NET SALES
    TABLE 83.3M: KEY STRATERGIES
    TABLE 84.TE CONNECTIVITY LTD.: COMPANY SNAPSHOT
    TABLE 85.TE CONNECTIVITY LTD.: OPERATING SEGMENTS
    TABLE 86.TE CONNECTIVITY LTD.: PRODUCT PORTFOLIO
    TABLE 87.TE CONNECTIVITY LTD.: NET SALES
    TABLE 88.TE CONNECTIVITY LTD.: KEY STRATERGIES
    TABLE 89.BELDEN INC.: COMPANY SNAPSHOT
    TABLE 90.BELDEN INC.: OPERATING SEGMENTS
    TABLE 91.BELDEN INC.: PRODUCT PORTFOLIO
    TABLE 92.BELDEN INC.: NET SALES
    TABLE 93.BELDEN INC.: KEY STRATERGIES
    TABLE 94.BUD INDUSTRIES, INC.: COMPANY SNAPSHOT
    TABLE 95.BUD INDUSTRIES, INC.: OPERATING SEGMENTS
    TABLE 96.BUD INDUSTRIES, INC.: PRODUCT PORTFOLIO
    TABLE 97.BUD INDUSTRIES, INC.: NET SALES
    TABLE 98.BUD INDUSTRIES, INC.: KEY STRATERGIES
    TABLE 99.EATON CORPORATION PLC (TRIPP LITE): COMPANY SNAPSHOT
    TABLE 100.EATON CORPORATION PLC (TRIPP LITE): OPERATING SEGMENTS
    TABLE 101.EATON CORPORATION PLC (TRIPP LITE): PRODUCT PORTFOLIO
    TABLE 102.EATON CORPORATION PLC (TRIPP LITE): NET SALES
    TABLE 103.EATON CORPORATION PLC (TRIPP LITE): KEY STRATERGIES
    TABLE 104.MOLEX: COMPANY SNAPSHOT
    TABLE 105.MOLEX: OPERATING SEGMENTS
    TABLE 106.MOLEX: PRODUCT PORTFOLIO
    TABLE 107.MOLEX: NET SALES
    TABLE 108.MOLEX: KEY STRATERGIES
    TABLE 109.PHOENIX CONTACT: COMPANY SNAPSHOT
    TABLE 110.PHOENIX CONTACT: OPERATING SEGMENTS
    TABLE 111.PHOENIX CONTACT: PRODUCT PORTFOLIO
    TABLE 112.PHOENIX CONTACT: NET SALES
    TABLE 113.PHOENIX CONTACT: KEY STRATERGIES
    TABLE 114.ROCKOM: COMPANY SNAPSHOT
    TABLE 115.ROCKOM: OPERATING SEGMENTS
    TABLE 116.ROCKOM: PRODUCT PORTFOLIO
    TABLE 117.ROCKOM: NET SALES
    TABLE 118.ROCKOM: KEY STRATERGIES
    TABLE 119.CORNING INC: COMPANY SNAPSHOT
    TABLE 120.CORNING INC: OPERATING SEGMENTS
    TABLE 121.CORNING INC: PRODUCT PORTFOLIO
    TABLE 122.CORNING INC: NET SALES
    TABLE 123.CORNING INC: KEY STRATERGIES
  • LIST OF FIGURES

  • FIGURE 1.FIBER MANAGEMENT SYSTEMS MARKET SEGMENTATION
    FIGURE 2.FIBER MANAGEMENT SYSTEMS MARKET,2021-2031
    FIGURE 3.FIBER MANAGEMENT SYSTEMS MARKET,2021-2031
    FIGURE 4. TOP INVESTMENT POCKETS, BY REGION
    FIGURE 5.PORTER FIVE-1
    FIGURE 6.PORTER FIVE-2
    FIGURE 7.PORTER FIVE-3
    FIGURE 8.PORTER FIVE-4
    FIGURE 9.PORTER FIVE-5
    FIGURE 10.TOP PLAYER POSITIONING
    FIGURE 11.FIBER MANAGEMENT SYSTEMS MARKET:DRIVERS, RESTRAINTS AND OPPORTUNITIES
    FIGURE 12.FIBER MANAGEMENT SYSTEMS MARKET,BY TYPE,2021(%)
    FIGURE 13.COMPARATIVE SHARE ANALYSIS OF FIBER CASSETTE FIBER MANAGEMENT SYSTEMS MARKET,2021-2031(%)
    FIGURE 14.COMPARATIVE SHARE ANALYSIS OF FIBER OPTIC BOXES FIBER MANAGEMENT SYSTEMS MARKET,2021-2031(%)
    FIGURE 15.COMPARATIVE SHARE ANALYSIS OF OTHERS FIBER MANAGEMENT SYSTEMS MARKET,2021-2031(%)
    FIGURE 16.FIBER MANAGEMENT SYSTEMS MARKET,BY APPLICATION,2021(%)
    FIGURE 17.COMPARATIVE SHARE ANALYSIS OF TELECOMMUNICATIONS FIBER MANAGEMENT SYSTEMS MARKET,2021-2031(%)
    FIGURE 18.COMPARATIVE SHARE ANALYSIS OF PUBLIC SECTOR FIBER MANAGEMENT SYSTEMS MARKET,2021-2031(%)
    FIGURE 19.COMPARATIVE SHARE ANALYSIS OF POWER UTILITIES FIBER MANAGEMENT SYSTEMS MARKET,2021-2031(%)
    FIGURE 20.COMPARATIVE SHARE ANALYSIS OF HEALTHCARE FIBER MANAGEMENT SYSTEMS MARKET,2021-2031(%)
    FIGURE 21.COMPARATIVE SHARE ANALYSIS OF INDUSTRIAL AUTOMATION FIBER MANAGEMENT SYSTEMS MARKET,2021-2031(%)
    FIGURE 22.COMPARATIVE SHARE ANALYSIS OF OTHERS FIBER MANAGEMENT SYSTEMS MARKET,2021-2031(%)
    FIGURE 23.FIBER MANAGEMENT SYSTEMS MARKET BY REGION,2021
    FIGURE 24.U.S. FIBER MANAGEMENT SYSTEMS MARKET,2021-2031($MILLION)
    FIGURE 25.CANADA FIBER MANAGEMENT SYSTEMS MARKET,2021-2031($MILLION)
    FIGURE 26.MEXICO FIBER MANAGEMENT SYSTEMS MARKET,2021-2031($MILLION)
    FIGURE 27.UK FIBER MANAGEMENT SYSTEMS MARKET,2021-2031($MILLION)
    FIGURE 28.GERMANY FIBER MANAGEMENT SYSTEMS MARKET,2021-2031($MILLION)
    FIGURE 29.FRANCE FIBER MANAGEMENT SYSTEMS MARKET,2021-2031($MILLION)
    FIGURE 30.REST OF EUROPE FIBER MANAGEMENT SYSTEMS MARKET,2021-2031($MILLION)
    FIGURE 31.CHINA FIBER MANAGEMENT SYSTEMS MARKET,2021-2031($MILLION)
    FIGURE 32.JAPAN FIBER MANAGEMENT SYSTEMS MARKET,2021-2031($MILLION)
    FIGURE 33.INDIA FIBER MANAGEMENT SYSTEMS MARKET,2021-2031($MILLION)
    FIGURE 34.SOUTH KOREA FIBER MANAGEMENT SYSTEMS MARKET,2021-2031($MILLION)
    FIGURE 35.REST OF ASIA-PACIFIC FIBER MANAGEMENT SYSTEMS MARKET,2021-2031($MILLION)
    FIGURE 36.LATIN AMERICA FIBER MANAGEMENT SYSTEMS MARKET,2021-2031($MILLION)
    FIGURE 37.MIDDLE EAST FIBER MANAGEMENT SYSTEMS MARKET,2021-2031($MILLION)
    FIGURE 38.AFRICA FIBER MANAGEMENT SYSTEMS MARKET,2021-2031($MILLION)
    FIGURE 39. TOP WINNING STRATEGIES, BY YEAR
    FIGURE 40. TOP WINNING STRATEGIES, BY DEVELOPMENT
    FIGURE 41. TOP WINNING STRATEGIES, BY COMPANY
    FIGURE 42.PRODUCT MAPPING OF TOP 10 PLAYERS
    FIGURE 43.COMPETITIVE DASHBOARD
    FIGURE 44.COMPETITIVE HEATMAP OF TOP 10 KEY PLAYERS
    FIGURE 45.SANTRON.: NET SALES ($MILLION)
    FIGURE 46.PANDUIT.: NET SALES ($MILLION)
    FIGURE 47.HUBER+SUHNER, INC..: NET SALES ($MILLION)
    FIGURE 48.3M.: NET SALES ($MILLION)
    FIGURE 49.TE CONNECTIVITY LTD..: NET SALES ($MILLION)
    FIGURE 50.BELDEN INC..: NET SALES ($MILLION)
    FIGURE 51.BUD INDUSTRIES, INC..: NET SALES ($MILLION)
    FIGURE 52.EATON CORPORATION PLC (TRIPP LITE).: NET SALES ($MILLION)
    FIGURE 53.MOLEX.: NET SALES ($MILLION)
    FIGURE 54.PHOENIX CONTACT.: NET SALES ($MILLION)
    FIGURE 55.ROCKOM.: NET SALES ($MILLION)
    FIGURE 56.CORNING INC.: NET SALES ($MILLION)


The fiber management system market is anticipated to depict prominent growth during the forecast period, owing to an increase in demand for IoT devices for various applications such as digital signage, data centers, smart infrastructure, and others. In addition, the need for fiber management systems for interactive kiosks, and networking solutions such as cloud computing, automated inspection, and others are increasing rapidly.  

Demand for fiber management systems among manufacturing businesses has surged as IoT, big data, and machine learning have advanced globally. The value of data has changed significantly through IT efficiencies. In this period of industry transformation and growth, more and more devices are being connected using fiber optic boxes. The demand for higher bandwidths and high-switching servers that can handle a variety of workloads and specific functions is skyrocketing as a result of the rise in the deployment of fiber optic technology globally. Fiber management systems are currently used as platforms for local or edge-level workload convergence and customized workload consolidation due to their effective performance and low power consumption.  

For instance, in March 2022, R&M, a globally active developer and supplier of cabling systems for high-quality network infrastructures announced the launch of fiber-to-the-home (FTTH) products and services in the U.S. in order to provide end-to-end connectivity. According to Paulo Campos, Executive VP, of Americas, and president of R&M USA Inc., R&M will offer its high-end fiber optic portfolio and international expertise in FTTH projects to the U.S. to help telecommunications customers meet the demand for virtually unlimited bandwidth in the digital era.

PURCHASE OPTIONS

Call or Email us

U.S.-Canada Toll-free: +1-800-792-5285
Int'l : +1-503-894-6022
Europe : +44-845-528-1300
Email : help@alliedmarketresearch.com
 
FREQUENTLY ASKED QUESTIONS?

A. Asia-Pacific is the largest regional market for Fiber Management Systems.

A. Thetelecommunicationssegment acquired the largest share in 2021 and is expected to grow at a significant CAGR from 2022 to 2031.

A. The global fiber management system market was valued at $3,357.8 million in 2021 and is projected to reach $9,264.8 million by 2031, registering a CAGR of 10.84% from 2022 to 2031.

A. high demand for Internet of Things devices. Moreover, increased deployment of data centers around enterprises and government centers, rising demand for bandwidth for faster connectivity, and expansion of telecom infrastructure in developing economies are expected to drive market growth during the forecast period.

A. Santron, Panduit, HUBER+SUHNER, Eaton Corporation Plc (Tripp Lite), and Phoenix Contact are the top 5 companies that hold a prime share in the fiber management system market.

Looking for Customization?

 Customization Request

Have a Question?

 Speak with Analyst

Any Confusion?

 Inquire Before Buying

Have a glance of the Report

  Request Sample
RELATED TAGS

Purchase Full Report of
Fiber Management Systems Market

Start reading instantly.
This Report and over 66,782+ more Reports, Available with Avenue Library. T&C*.

  • Online Only
  • $3,570
  • Online cloud access only
  • Restricted print, copy, paste & download
  • Read only
  • Free industry update
    (Within 180 days)
  • Free report update in next update cycle
    (Dec 2023 - Dec 2024)
  • Data Pack
  • $3,840
  • Restricted to one authorized user
  • One print only
  • Available in
    Excel
  • Free industry update
    (Within 180 days)
  •   Free report update in next update cycle
    (Dec 2023 - Dec 2024)
  • Single User
  • $5,730
  • Restricted to one authorized user
  • One print only
  • Available in
    PDF
  • Free industry update
    (Within 180 days)
  •   Free report update in next update cycle
    (Dec 2023 - Dec 2024)
  • Five Users
  • $6,450
  • Limited to five authorized users
  • Print upto five copies
  • Available in
    PDF
  • Free industry update
    (Within 180 days)
  •   Free report update in next update cycle
    (Dec 2023 - Dec 2024)
  • Enterprise
    License/PDF

  • $9,600
  • Unlimited
    within
    company/enterprise
  • Available in Excel & PDF
  • Free industry update
    (Within 180 days)
  •   Free report update in next update cycle
    (Dec 2023 - Dec 2024)
  • Library
    Membership

  • $999 $ 1,175
    Per User/ Per month/ Billed annually
  • Published Content
    E-access
  • Company Profiles
    E-access
  • Newly Added Content Access
  • 10 PDF
    Downloads
  • 5 Excel Data
    Pack Downloads
  • 250 Company Profiles PDF Downloads
  • Buy Now

*Taxes/Fees, if applicable will be added during checkout. All prices in USD

RELATED REPORTS
 

Why Allied Market Research?


Infallible Methodology

To ensure high-level data integrity, accurate analysis, and impeccable forecasts

Analyst Support

For complete satisfaction

Customization

On-demand customization of scope of the report to exactly meet your needs

TARGETED MARKET VIEW

Targeted market view to provide pertinent information and save time of readers

Get fresh content delivered

Get insights on topics that are crucial for your business. Stay abreast of your interest areas.

Get Industry Data Alerts

Why Allied Market Research?

Infallible Methodology

To ensure high-level data integrity, accurate analysis, and impeccable forecasts

Analyst Support

For complete satisfaction

Customization

On-demand customization of scope of the report to exactly meet your needs

TARGETED MARKET VIEW

Targeted market view to provide pertinent information and save time of readers